

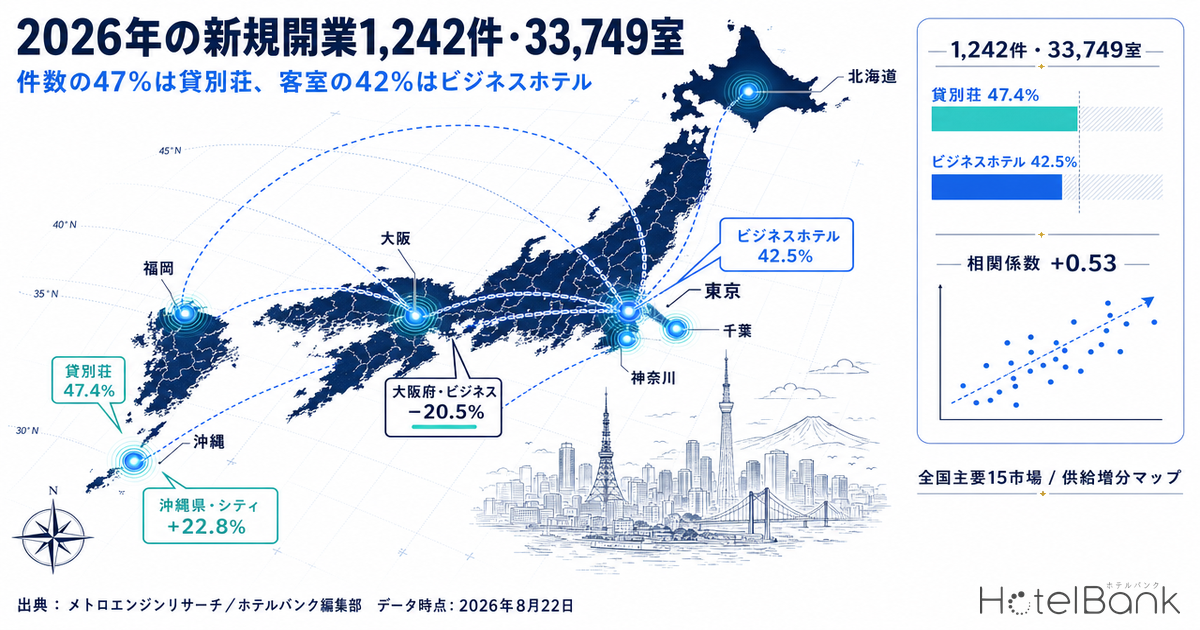
Lodging facilities that opened in Japan in 2026 (including those confirmed as scheduled to open) total 1,242 properties and 33,749 rooms. The largest group by property count is vacation rentals at 589 properties, or 47.4% of the total — yet they account for only 953 rooms, just 2.8% of all rooms. Business hotels are the mirror image: only 139 properties (11.2%), but 14,336 rooms, 42.5% of the national total. Headlines that count how many properties opened this year describe a completely different distribution from the competitive pressure those openings create as room inventory. Nor is it true that markets with larger supply increments saw settled ADR fall — across the 15 major markets examined here, the nine markets where rooms grew by 5% or more relative to existing stock posted a median January–July 2026 ADR of +5.7% year on year, while the six markets with increments below 5% posted a median of −0.5%.
Scope: 1,242 properties / 33,749 rooms opening nationwide in 2026; a planning pipeline of 41 projects / 6,737 rooms; and estimated settled ADR for 15 major markets (prefecture x format), N=14–913 properties. The price metric used throughout is estimated settled ADR (a transaction-level price level inferred from OTA and other sales data, tax-exclusive equivalent). Definitions appear at the end of the article. Data as of August 22, 2026.
- — 1,242 properties and 33,749 rooms opened in 2026. Vacation rentals account for 47.4% of properties but only 2.8% of rooms — the distribution of property counts and the competitive pressure of actual inventory are entirely different things.
- — Business, resort and city hotels — three formats making up 18.7% of properties — supply 71.9% of rooms. Average size runs from 1.6 rooms for a vacation rental to 126.1 rooms for a city hotel, a gap of nearly 80x.
- — Across the 15 major markets, the correlation between supply increment rate and YoY ADR is +0.53. The nine markets with increments of 5% or more posted a median YoY of +5.7%, the six below 5% posted −0.5% — more supply does not equal lower rates.
- — Tokyo business hotels added only 0.8% in supply, yet ADR turned −4.7% in June and −5.3% in July. What moves rates is the demand calendar, not supply.
- — The planning pipeline stands at 41 projects and 6,737 rooms, of which 55.5% is scheduled for completion in 2027. Median project size is 134 rooms, and projects of 200 rooms or more account for 59.2% of the room total.
47% of properties are vacation rentals; 42% of rooms are business hotels
Start by breaking 2026 openings down on both counts — properties and rooms. The 1,242 properties nationwide average 27.2 rooms each, but that average carries almost no information: rooms per property by format range from 1.6 to 126, a spread of nearly 80x.
The largest bloc by property count is vacation rentals at 589 — 47.4% of the total, meaning roughly one in every two properties that opened in 2026 was a vacation rental. But at an average of 1.6 rooms each, they add up to just 953 rooms. Guesthouses (65 properties, 4.2 rooms average, 274 rooms) and machiya townhouses (33 properties, 1.7 rooms average, 56 rooms) are likewise numerous but account for less than 1% of rooms each. For where this whole-house inventory is concentrating geographically, see Vacation Rentals Take 45% of Japan’s 2026 New Hotel Openings (247 Villas), which tracks it region by region.
Against that, business hotels contributed 139 properties and 14,336 rooms (103.1 average), resort hotels 58 properties and 5,522 rooms (95.2 average), and city hotels 35 properties and 4,415 rooms (126.1 average). Those three formats alone total 232 properties and 24,273 rooms — 18.7% of properties but 71.9% of rooms. Competitive pressure as inventory is therefore concentrated not in the formats that top the opening count, but in the three large-format categories that are a minority by count.
2026 openings (including scheduled openings), 1,242 properties / 33,749 rooms nationwide, based on confirmed OTA listings. Source: MetroEngines Research; compiled by the HotelBank Editorial Team.
| Format | Properties | Property share | Rooms | Room share | Avg per property |
|---|---|---|---|---|---|
| Business hotel | 139 | 11.2% | 14,336 | 42.5% | 103.1 rooms |
| Resort hotel | 58 | 4.7% | 5,522 | 16.4% | 95.2 rooms |
| City hotel | 35 | 2.8% | 4,415 | 13.1% | 126.1 rooms |
| Hostel | 68 | 5.5% | 1,170 | 3.5% | 17.2 rooms |
| Vacation rental | 589 | 47.4% | 953 | 2.8% | 1.6 rooms |
| Ryokan | 42 | 3.4% | 651 | 1.9% | 15.5 rooms |
| Cottage | 44 | 3.5% | 488 | 1.4% | 11.1 rooms |
| Guesthouse | 65 | 5.2% | 274 | 0.8% | 4.2 rooms |
| Machiya townhouse | 33 | 2.7% | 56 | 0.2% | 1.7 rooms |
| Other formats (15 categories combined) | 169 | 13.6% | 5,884 | 17.4% | 34.8 rooms |
| Total | 1,242 | 100% | 33,749 | 100% | 27.2 rooms |
2026 openings (including scheduled openings), 1,242 properties / 33,749 rooms nationwide, based on confirmed OTA listings. Source: MetroEngines Research; compiled by the HotelBank Editorial Team.
The timing of openings is skewed as well. January through July accounts for 1,170 properties and 28,106 rooms, while only 72 properties and 5,643 rooms have so far been confirmed for August through December. Rooms peaked in April at 6,279, followed by July at 5,212 — those two months alone put 11,491 rooms, 34.0% of the annual total, into the market. Large projects cluster in the first half of the year, which reads as openings timed to the period when both business and leisure demand ramp up.
New-opening counts in this article are based on confirmed OTA listings. Advance listings typically begin several months before opening, and a meaningful number of properties are only confirmed after they open, so counts for August–December and later months will rise as further listings are confirmed. The 72 properties / 5,643 rooms shown for the second half of the year are structurally understated and should be read as a floor based on what can be confirmed today.
Supply increment and settled ADR are not inversely correlated — reconciling 15 major markets
“More supply means lower rates” is the revenue manager’s instinct, but the 2026 data is not that simple. At the prefecture x format level, dividing 2026 new-opening rooms by the existing room stock in the same market gives a supply increment rate, which the chart and table below place alongside estimated settled ADR for the same market (average of confirmed months, January–July 2026 vs the same period in 2025).
Supply increment from 2026 new openings (confirmed OTA listings, N=1,242 properties); ADR compares confirmed months of estimated settled ADR (N=14–913 properties). Source: MetroEngines Research; compiled by the HotelBank Editorial Team.
The largest supply increment is Okinawa city hotels: 4 new properties and 728 rooms against an existing 3,192, an increment of 22.8%. Yet estimated settled ADR in that market averaged ¥19,545 for January–July 2026 (N=14 properties), up 16.9% from ¥16,713 in the same period a year earlier (N=11 properties). The next largest increments all rose too — Chiba resort hotels (increment 8.7%) at +5.7%, Okinawa resort hotels (5.4%) at +19.2%, and Kanagawa city hotels (5.3%) at +17.6%.
At the other end, Osaka business hotels — among the smallest increments, with 1,022 new rooms against an existing 97,167, or 1.1% — averaged ¥8,965 for January–July (N=497 properties), down 20.5% from ¥11,275 a year earlier (N=502 properties). Osaka city hotels, with a 2.9% increment, fell 11.6%. The payback from a market that carried major international event demand in 2025 is hitting rates far harder than any supply factor. For how that payback deepened month by month, see Osaka Settled ADR June 2026: City −26.3%, Business −32.8% Post-Expo, which breaks it down by month.
Across all 15 markets, the correlation coefficient between supply increment rate and YoY ADR is +0.53 (N=15 markets). Far from negative, it is positive. The nine markets with increments of 5% or more show a median YoY ADR of +5.7%; the six below 5% show a median of −0.5%. Supply is deployed toward markets where demand is strong, so the size of the supply increment doubles as a proxy for the strength of that demand — that is the straightforward reading. In day-to-day revenue management, the sequence is to suspend the reflex of “a new property opened next door, so cut rates” and first establish, from the demand side, why that supply chose to land there.
| Market (prefecture x format) | 2026 new | Existing rooms | Supply increment | Estimated settled ADR Jan–Jul 2026 average | Prior-year period | YoY | N(26/25) |
|---|---|---|---|---|---|---|---|
| Okinawa — City | 4 props / 728 rooms | 3,192 | +22.8% | ¥19,545 | ¥16,713 | +16.9% | 14/11 |
| Chiba — Resort | 3 props / 899 rooms | 10,399 | +8.7% | ¥16,348 | ¥15,463 | +5.7% | 70/65 |
| Kagawa — Business | 5 props / 653 rooms | 9,751 | +6.7% | ¥7,192 | ¥7,016 | +2.5% | 92/86 |
| Saitama — Business | 6 props / 1,194 rooms | 18,362 | +6.5% | ¥7,663 | ¥7,555 | +1.4% | 147/148 |
| Fukuoka — City | 3 props / 552 rooms | 8,593 | +6.4% | ¥17,801 | ¥16,228 | +9.7% | 40/37 |
| Okayama — Business | 3 props / 856 rooms | 14,030 | +6.1% | ¥7,109 | ¥6,914 | +2.8% | 93/98 |
| Kumamoto — Business | 6 props / 841 rooms | 15,078 | +5.6% | ¥6,912 | ¥6,762 | +2.2% | 119/115 |
| Okinawa — Resort | 10 props / 1,675 rooms | 31,046 | +5.4% | ¥16,830 | ¥14,120 | +19.2% | 279/266 |
| Kanagawa — City | 2 props / 504 rooms | 9,493 | +5.3% | ¥15,695 | ¥13,342 | +17.6% | 42/41 |
| Shizuoka — Resort | 6 props / 503 rooms | 10,617 | +4.7% | ¥17,874 | ¥17,435 | +2.5% | 151/132 |
| Osaka — City | 6 props / 813 rooms | 28,366 | +2.9% | ¥12,507 | ¥14,146 | −11.6% | 97/90 |
| Hokkaido — Business | 9 props / 969 rooms | 57,137 | +1.7% | ¥8,733 | ¥8,251 | +5.8% | 432/421 |
| Osaka — Business | 14 props / 1,022 rooms | 97,167 | +1.1% | ¥8,965 | ¥11,275 | −20.5% | 497/502 |
| Tokyo — City | 2 props / 316 rooms | 40,738 | +0.8% | ¥26,357 | ¥26,939 | −2.2% | 107/107 |
| Tokyo — Business | 14 props / 1,156 rooms | 153,992 | +0.8% | ¥14,059 | ¥13,872 | +1.3% | 913/902 |
Estimated settled ADR is a confirmed value for both January–July 2026 and January–July 2025. N = number of properties in the settled-ADR aggregation. Source: MetroEngines Research; compiled by the HotelBank Editorial Team.
The seasonal shape of Tokyo business hotels has not changed
Even in markets that look quiet on an annual average, the month-by-month shape changes from year to year. The chart below overlays monthly estimated settled ADR for 2025 and 2026 in Tokyo business hotels, the deepest sample in the country (N=894–924 properties).
Source: MetroEngines Research; compiled by the HotelBank Editorial Team.
January through May 2026 ran consistently ahead of the prior year: ¥15,670 in March (vs ¥15,226, +2.9%), a full-year high of ¥17,802 in April (vs ¥17,138, +3.9%), and ¥14,890 in May (vs ¥14,085, +5.7%). June then turned at ¥11,890 (vs ¥12,474, −4.7%), and July stayed below the prior year at ¥12,306 (vs ¥12,990, −5.3%). The January–July average of ¥14,059 against ¥13,872 is +1.3%, so on an annual average the market looks “broadly flat” — but in reality the early-summer decline cancelled out the first-half gains. August stands at ¥11,979 on an estimate based on current selling conditions (N=901 properties), but because that is not a confirmed value, a direct comparison against the confirmed ¥12,689 of August 2025 has to wait for month-end confirmation.
Back to supply: Tokyo business hotels added 14 properties and 1,156 rooms, an increment of just 0.8% against an existing stock of 153,992 rooms. Rates still fell below the prior year in early summer. Here again, what explains monthly rate movement is the demand calendar, not supply. For a format-level breakdown of Tokyo’s 2026 openings, see Tokyo 2026: 2,055 New Rooms, 55.6% Business Hotels, ADR Turns Negative.
The planning pipeline is 41 projects / 6,737 rooms, concentrated in 2027
Next, the supply still to come. Planned projects with completion dates from August 2026 onward number, after removing duplicates, 41 projects and 6,737 rooms (of which 34 projects / 6,010 rooms have a confirmed construction start date and 7 projects / 727 rooms do not). Median project size is 134 rooms, and the 13 large projects of 200 rooms or more — 3,989 rooms — make up 59.2% of the room total.
By scheduled completion year: 8 projects / 1,326 rooms within 2026, 22 projects / 3,738 rooms in 2027, 9 projects / 1,473 rooms in 2028, and 2 projects / 200 rooms in 2029 or later. The peak therefore falls in 2027, not in the next 18 months. By prefecture, Tokyo leads with 16 projects / 1,899 rooms, followed by Chiba with 2 projects / 1,238 rooms (one of them a 1,000-room-class mixed-use complex scheduled for completion at the end of 2027), Hokkaido with 5 / 910, Okayama with 2 / 490, Kanagawa with 2 / 398, Hyogo with 4 / 354, Osaka with 2 / 337, and Tochigi with 1 / 300.
Worth noting is that many of these are not standalone hotels but mixed-use developments combining offices, retail, residential or bathing facilities. Mixed-use projects lift the surrounding foot traffic once complete, so rooms and demand grow together. The positive correlation between supply increment and ADR seen in the previous section partly reflects this structure.
| Scheduled completion year | Properties | Rooms | Room share |
|---|---|---|---|
| 2026 (August onward) | 8 | 1,326 | 19.7% |
| 2027 | 22 | 3,738 | 55.5% |
| 2028 | 9 | 1,473 | 21.9% |
| 2029 or later | 2 | 200 | 3.0% |
| Total | 41 | 6,737 | 100% |
Planned projects with completion from August 2026 onward (duplicates with identical address and room count removed); planning-record basis, N=41 projects / 6,737 rooms. Source: MetroEngines Research; compiled by the HotelBank Editorial Team.
This data aggregates planned projects whose registration could be confirmed as of the survey date. Of these, 34 projects / 6,010 rooms have a confirmed construction start date; the remaining 7 projects / 727 rooms do not. Because projects are registered and broken ground one to two years before opening, project and room counts for 2027 and later are expected to rise as further plans are added. Read these figures as a floor for the currently confirmed pipeline.
Which group is your market in? Three scenarios and a property-count x format sensitivity grid
The figures so far are actuals for the nation and for 15 major markets. To help place your own market within that distribution, the two yardsticks below — a scenario table and a sensitivity grid — rearrange only the measured values already presented in this article. Neither adds new assumptions or forward projections; both are re-aggregations of published figures.
Yardstick A: three scenarios for YoY ADR. The actual distribution across 15 markets is split into three groups at a 5% supply increment. Which group your own market falls into changes the central YoY figure you should be referencing.
| Scenario | Group | Markets | YoY ADR median | Actual range | Market at range edge | Applied to a ¥10,000 property ADR |
|---|---|---|---|---|---|---|
| Optimistic | 9 markets with supply increment of 5% or more | 9 markets | +5.7% | +1.4% to +19.2% | Okinawa — Resort +19.2% | ¥10,570 |
| Mid | All 15 markets | 15 markets | +2.5% | −20.5% to +19.2% | Kagawa — Business +2.5% | ¥10,250 |
| Pessimistic | 6 markets with supply increment below 5% | 6 markets | −0.5% | −20.5% to +5.8% | Osaka — Business −20.5% | ¥9,950 |
Re-aggregated from the 15-market actuals presented in this article. The rightmost column is a simple conversion assuming a property settled ADR of ¥10,000, not a forecast. Source: MetroEngines Research; compiled by the HotelBank Editorial Team.
The three scenarios span 6.2 points between medians and 39.7 points between the edges of the actual range. Even among markets that are “adding supply,” Okinawa resorts at +19.2% and Osaka business hotels at −20.5% swing in opposite directions. Setting the direction of a rate revision on a national-average intuition, without first establishing which group your market belongs to, risks getting the direction itself wrong.
Yardstick B: rooms added, as a function of how many properties opened x in which format. The risk of measuring competitive pressure by property count is shown on two axes — average rooms per property from the opening of this article (1.6 to 126.1 rooms) and the number of openings. Cells show rooms added; those of 100 rooms or more are shaded.
| Format | Avg per property | 1 property | 2 properties | 3 properties | 5 properties | 10 properties |
|---|---|---|---|---|---|---|
| Vacation rental | 1.6 rooms | 2 rooms | 3 rooms | 5 rooms | 8 rooms | 16 rooms |
| Guesthouse | 4.2 rooms | 4 rooms | 8 rooms | 13 rooms | 21 rooms | 42 rooms |
| Cottage | 11.1 rooms | 11 rooms | 22 rooms | 33 rooms | 56 rooms | 111 rooms |
| Ryokan | 15.5 rooms | 16 rooms | 31 rooms | 46 rooms | 78 rooms | 155 rooms |
| Hostel | 17.2 rooms | 17 rooms | 34 rooms | 52 rooms | 86 rooms | 172 rooms |
| Resort hotel | 95.2 rooms | 95 rooms | 190 rooms | 286 rooms | 476 rooms | 952 rooms |
| Business hotel | 103.1 rooms | 103 rooms | 206 rooms | 309 rooms | 516 rooms | 1,031 rooms |
| City hotel | 126.1 rooms | 126 rooms | 252 rooms | 378 rooms | 630 rooms | 1,261 rooms |
Average rooms per property are measured values from this article’s format aggregation (1,242 properties / 33,749 rooms opening in 2026). Cells are the simple product of average rooms and property count. Source: MetroEngines Research; compiled by the HotelBank Editorial Team.
The reading is simple but it bites. Ten vacation rentals opening adds 16 rooms; a single city hotel adds 126. The same “ten openings” produces an inventory impact that differs by nearly 8x depending on format. Of the 40 cells, only resort, business and city hotels exceed 100 rooms, and each needs two or more properties to do so. Put the other way: if even one property in those three formats is scheduled for your area, it is worth adding it to the comp set in advance rather than waiting for the opening-count headlines. Note too that the national average of 27.2 rooms is not the center of this distribution — it is a quarter of a single business hotel.
For revenue managers operating in a rising-supply market — implications and an action plan
(1) Re-measure competitive pressure by rooms added, not by openings. Vacation rentals are 589 of the 1,242 openings nationwide, or 47.4%, yet only 953 rooms, or 2.8%. When you see a headline saying “N properties opened in our area this year,” whether the mix is a format averaging 1.6 rooms or business hotels averaging 103.1 rooms changes the weight on your own inventory by an order of magnitude. Review the comp set on a room basis, not a property basis.
(2) Suspend the reflex that more supply means lower prices. Across these 15 markets the correlation between supply increment rate and YoY ADR was +0.53; the nine markets with increments of 5% or more had a median YoY of +5.7%, and the six below 5% had −0.5%. Markets where supply concentrates are also markets where the investment side expects demand to be strong. If your area’s supply increment is large, the first thing to establish is why capital landed there — which demand segments are expanding — not a defensive price cut.
(3) Rates are moved by the demand calendar more than by supply. Tokyo business hotels added only 0.8% in supply, yet 2026 ran ahead of the prior year from January to May before turning in early summer, at −4.7% in June and −5.3% in July. Osaka business hotels likewise averaged −20.5% for January–July on a 1.1% increment. Judging the market “flat” from the annual average alone means missing the reversals happening month to month. Rebuild the rate-revision calendar monthly rather than annually, against the confirmed value for the same month a year earlier.
(4) The impact lands in 2027. Of the 6,737 rooms in the planning pipeline, 55.5% is scheduled for completion in 2027, with Tokyo the largest at 16 projects / 1,899 rooms. Rather than the inventory of the next 18 months, there is room to start observing now which segments the large mixed-use projects opening in 2027 will target. A median of 134 rooms per project, with projects of 200 rooms or more accounting for 59.2% of rooms, points to growing capacity for corporate, group and tour demand.
The table below sets out a time-phased action plan on that basis. Every numeric trigger ties back to a figure presented in this article.
| Time frame | Action | Decision trigger | Objective |
|---|---|---|---|
| Today to this week | Rebuild the comp set from a property basis to a room basis | If most of the new openings in your area are formats averaging vacation-rental scale (1.6 rooms), consider removing them from the comp set | Avoid cutting rates in response to competitive pressure that does not exist |
| Reconcile your property’s ADR for the latest confirmed month (July 2026) against the market value | If your property remains below the January–July average for its market (e.g. Tokyo business ¥14,059 / Osaka business ¥8,965 / Okinawa resort ¥16,830), separate whether the cause is demand or pricing | Establish your position within the market range | |
| Within two weeks | Redefine the demand segments for months where YoY turned negative | If your monthly figures show a reversal pattern like Tokyo business hotels’ −4.7% in June and −5.3% in July, identify the segments those months depended on | Avoid confusing a single-month dip with a structural decline |
| Update your public-facing assets (photos, plan names, copy) so the format difference comes through | Where new supply in your area is dominated by small formats averaging 1.6–4.2 rooms (vacation rentals, guesthouses), there is room to differentiate on value delivered rather than on price | Get compared on axes other than price | |
| Next month through 2027 | Review minimum-stay and multi-night conditions, starting with the months of largest supply increment | If your area’s supply increment matches the upper group here (+5% or more), reset minimum-stay loosening or tightening month by month on the assumption that demand is growing too | Find the balance point between occupancy and rate within growing inventory |
| Add large projects scheduled for 2027 completion to the competitor watch list in advance | Where your area ranks high in the pipeline (Tokyo 16 projects / 1,899 rooms, Chiba 2 / 1,238, Hokkaido 5 / 910, etc.) | Settle price band and segment strategy before the opening, not after |
Source: MetroEngines Research; compiled by the HotelBank Editorial Team.
Summary — three yardsticks for reading supply
Yardstick 1: rooms, not properties. Vacation rentals are 47.4% of the 1,242 properties that opened in 2026 but 2.8% of rooms. Conversely, business, resort and city hotels are 18.7% of properties and 71.9% of rooms. The property count in the headlines and the room count that acts on your inventory are different things.
Yardstick 2: supply increment doubles as a proxy for demand strength. Across 15 markets the correlation between supply increment rate and YoY ADR is +0.53. Okinawa city hotels, with a 22.8% increment, were +16.9%; Osaka business hotels, with 1.1%, were −20.5%. Rates do not fall because supply rises — supply moves toward the markets that are rising.
Yardstick 3: the peak is 2027. Of the 41 projects / 6,737 rooms in the planning pipeline, 55.5% is scheduled for completion in 2027. Median project size is 134 rooms and projects of 200 rooms or more account for 59.2% of rooms. The right planning horizon is the year after next, not next year.
About the data
- Estimated settled ADR: a transaction-level price level inferred from OTA and other sales data (lowest-plan level x format-specific coefficient, ensembled across multiple channels), tax-exclusive equivalent. Past months are confirmed values; the current and future months are estimates based on current selling conditions. Median error against published operating results is 6.6%. All year-on-year figures in this article compare confirmed months only; August 2026 (a current-point estimate) is not used in any YoY calculation.
- Sample N: properties included in the settled-ADR aggregation, by market — Tokyo business hotels 913 (July 2026) / 902 (July 2025); Osaka business hotels 497 / 502; Hokkaido business hotels 432 / 421; Okinawa resort hotels 279 / 266; Shizuoka resort hotels 151 / 132; Saitama business hotels 147 / 148; Kumamoto business hotels 119 / 115; Tokyo city hotels 107 / 107; Osaka city hotels 97 / 90; Okayama business hotels 93 / 98; Kagawa business hotels 92 / 86; Chiba resort hotels 70 / 65; Kanagawa city hotels 42 / 41; Fukuoka city hotels 40 / 37; Okinawa city hotels 14 / 11. Categories are the three classes business hotel, city hotel and resort hotel.
- New openings: 1,242 properties / 33,749 rooms nationwide registered as opening (including scheduled openings) in 2026. Formats are classified into 24 categories; the nine largest by property count are shown in the table and the remaining 15 are combined as “other formats.” The supply increment rate uses existing rooms in the same prefecture x format as the denominator and 2026 new-opening rooms as the numerator.
- Planning pipeline: 41 projects / 6,737 rooms with a scheduled completion date on or after August 22, 2026 (after removing one duplicate with identical address and room count). Of these, 34 projects / 6,010 rooms have a confirmed construction start date and 7 projects / 727 rooms do not. Mixed-use projects that are not hotel-only are included, and stated room counts are as of the planning stage.
- This article covers only the price metric (estimated settled ADR) and supply counts of properties and rooms; estimated occupancy and booking curves are not used.
- Data as of August 22, 2026.Selling conditions and inventory change daily, so the figures here are a snapshot as of the retrieval date.
■ Data sources
2026 new openings (1,242 properties / 33,749 rooms nationwide, 24 format categories, based on confirmed OTA listings); monthly estimated settled ADR series by prefecture x format (past months = confirmed values; current and future months = estimates based on current selling conditions); and planned projects with a scheduled completion date on or after August 22, 2026 (41 projects / 6,737 rooms). All are aggregated data from MetroEngines Research. Data as of August 22, 2026.
■ Calculation assumptions
Supply increment rate = 2026 new-opening rooms in the same prefecture x format divided by existing rooms in that market. YoY ADR is calculated from confirmed months only (January–July 2026 average vs January–July 2025 average); August 2026, a current-point estimate, is excluded from every YoY calculation. The correlation coefficient is a Pearson product-moment correlation across the 15 markets. The scenario and sensitivity tables re-aggregate measured values already presented in the body text and contain no new forecasts or extrapolation.
■ Limitations and caveats
Because new openings are based on confirmed OTA listings, the most recent months from August onward are structurally understated and should be read as a floor. Of the 41 pipeline projects, 7 (727 rooms) have no registered construction start date, while 34 (6,010 rooms) are confirmed as having broken ground. Estimated settled ADR has a median error of 6.6% against published operating results, and markets with few properties (such as Okinawa city hotels at N=14) are more exposed to the influence of individual properties. This article covers only the price metric and supply counts of properties and rooms; estimated occupancy and booking curves are not used.
Related reading
- Hotel Supply Pressure Ranking 2026-2027: Ozu Kumamoto Tops at 30.8%
- Tokyo 2026: 2,055 New Rooms, 55.6% Business Hotels, ADR Turns Negative
- Tokyo 23 Wards Supply Pressure 2026: Arakawa 16.0%, Minato Just 4.5%
- Okinawa 2026: 2,842 New Rooms, 0.6% Business vs 22.1% City Inventory
- Hiroshima 2026: 1,003 New Rooms, City Settled ADR Turns -4.1% in July
- 1,002 New Japan Openings H1 2026: ADR 1.14x, Ryokan Lag +18.8pt
- Vacation Rentals Take 45% of Japan’s 2026 New Hotel Openings (247 Villas)
- Osaka Settled ADR June 2026: City −26.3%, Business −32.8% Post-Expo