

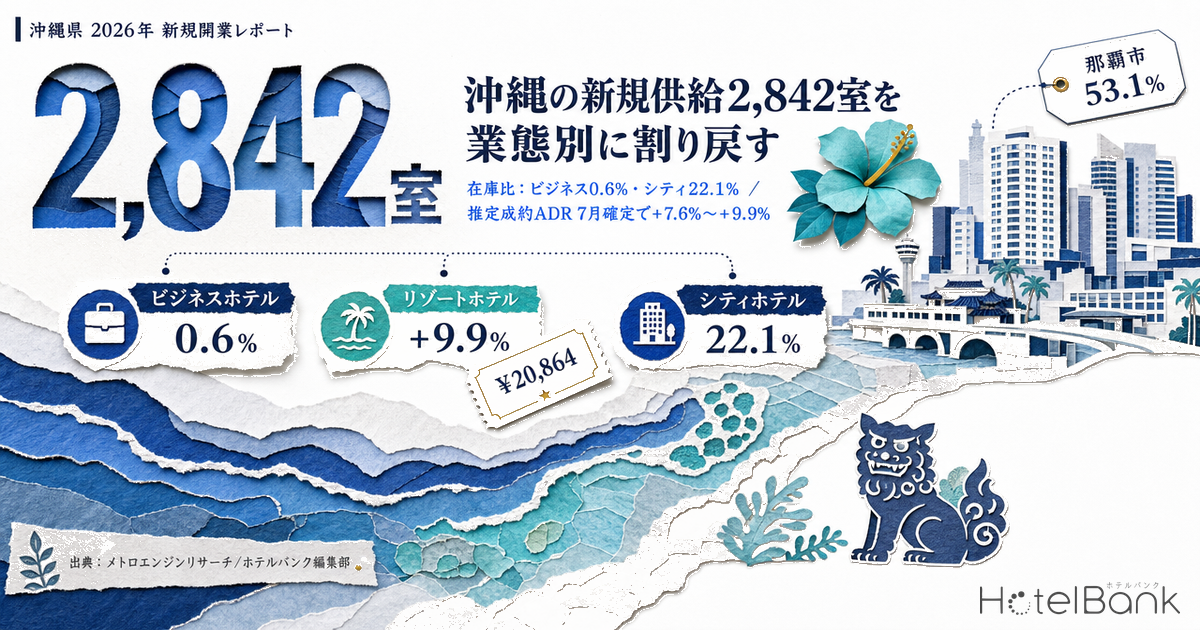
Okinawa has 73 lodging properties totalling 2,842 rooms opening in 2026. Against the previous year (2025) — 127 properties and 2,074 rooms — the property count fell by 54 while the room count rose by 768. Fewer projects, more rooms: the average project has got bigger. But carrying those 2,842 rooms straight into your own pricing decisions as “supply pressure across the prefecture” will lead you astray. Divide the new rooms back out by property type, and the share they represent of the sellable inventory in the same type ranges from 0.6% for business hotels to 22.1% for city hotels — a gap of several dozen times. Meanwhile estimated settled ADR for July 2026 (finalised) landed at ¥9,496 for business hotels (+7.6% YoY), ¥20,864 for resort hotels (+9.9%) and ¥20,706 for city hotels (+9.0%) — all above the prior year. This article builds the procedure for dividing a supply count back out by property type, using Okinawa’s actual data.
Scope: business, resort and city hotels in Okinawa, N=195/279/14 properties (July 2026, estimated settled ADR). The price metric in this article is estimated settled ADR (the transaction price level estimated from OTA and other sales data, roughly tax-exclusive); occupancy is an estimate based on OTA-listed inventory. Definitions for both appear at the end of the article. Data as of 14 August 2026.
- — Okinawa’s 2026 openings total 73 properties and 2,842 rooms. Against 127 properties and 2,074 rooms a year earlier, the count is down 54 while rooms are up 768 — the average project has got bigger.
- — Divided back out by the sellable inventory of the same property type, the shares are 0.6% for business hotels (100 rooms), 6.7% for resort hotels (1,675 rooms) and 22.1% for city hotels (696 rooms). The prefecture-wide average of 5.4% matches no property type’s lived experience.
- — Naha accounts for 53.1% of the new rooms (1,510 rooms), and Naha, Miyakojima, Onna and Chatan together hold 93.2% — far ahead of Nago (63 rooms), Motobu (51 rooms) and Ishigaki (40 rooms).
- — Estimated settled ADR was above the prior year in every property type in finalised July 2026 (business +7.6%, resort +9.9%, city +9.0%). Rising supply has not translated directly into falling rates.
- — The peak of the pricing calendar falls in a different month for each type — business hotels peak in February at ¥10,648, while resort hotels peak in July and August. Borrowing another type’s sense of seasonality is worth auditing.
Half the projects, double the rooms in three years — Okinawa’s openings have got bigger
Start by lining up three years of openings for the prefecture as a whole. 2024: 137 properties, 1,328 rooms. 2025: 127 properties, 2,074 rooms. 2026: 73 properties, 2,842 rooms. The property count is down 64 over two years while the room count is up 1,514. Average rooms per property has moved 9.7 → 16.3 → 38.9.
That rise in the average does not, on its own, say anything about what the supply actually is. Small-scale inventory such as vacation rentals and cottages has long made up the bulk of Okinawa’s opening count, so the average is strongly dragged around by shifts in the mix. So we stack the room counts across four property groups instead.
This chart and the opening figures below are compiled on an OTA-listing-confirmed basis. Only about 19% of properties are listed on an OTA before opening, and more than half are listed only after opening, so the property and room counts for the most recent year (2026) may rise as further listings are confirmed (2026 is a partial-year tally). We recommend reading these alongside the building-plan pipeline based on construction applications (MLIT, Statistical Survey on Building Construction).
Source: MetroEngines Research & Consulting (OTA-listing-confirmed basis / 2026 is a partial-year tally, N=73 properties), compiled by the HotelBank Editorial Team
Isolate the hotel property types alone (city, resort, business, deluxe and capsule) and the room counts run 916 rooms (26 projects) → 1,714 rooms (20 projects) → 2,471 rooms (16 projects). While the project count falls from 26 to 16, rooms multiply by 2.7, and average rooms per hotel-type project jumps 35.2 → 85.7 → 154.4. Hotel property types account for 86.9% of the new rooms in 2026, up 17.9 points from 69.0% in 2024.
| Property group | 2024 projects / rooms | 2025 projects / rooms | 2026 projects / rooms |
|---|---|---|---|
| Hotel property types (city / resort / business / deluxe / capsule) | 26 / 916 rooms | 20 / 1,714 rooms | 16 / 2,471 rooms |
| Hostels and guesthouses | 20 / 280 rooms | 17 / 197 rooms | 6 / 96 rooms |
| Vacation rentals, cottages and other small-scale inventory | 91 / 132 rooms | 90 / 163 rooms | 45 / 90 rooms |
| Unclassified | 0 / 0 rooms | 0 / 0 rooms | 6 / 185 rooms |
| Total | 137 / 1,328 rooms | 127 / 2,074 rooms | 73 / 2,842 rooms |
Annual openings in Okinawa (annual tally, OTA-listing-confirmed basis; 2026 is a partial-year tally) / Source: MetroEngines Research & Consulting, compiled by the HotelBank Editorial Team
Look only at “73 properties” and supply appears to have calmed down; look only at “2,842 rooms” and it appears to be the largest increase in three years. The same data for the same year gives opposite impressions depending on the cut. What revenue management actually needs is neither of those two numbers, but how many rooms that compete with your own inventory have been added.
Dividing back out by property type — 0.6% of inventory for business hotels, 22.1% for city hotels
The procedure is simple. (1) Break the new rooms down by property type. (2) Put the existing sellable inventory (room count) of the same property type in the denominator. (3) Take the ratio. For the denominator we use the room count observed as sellable inventory in the prefecture as of July 2026 (median within the month). Prefecture-wide that is 52,243 rooms (1,033–1,181 properties observed).
| Property type | 2026 openings | Sellable inventory in prefecture (July 2026, median) | Share of inventory |
|---|---|---|---|
| City hotels | 3 / 696 rooms | 3,155 rooms (N=13–14 properties) | 22.1% |
| Resort hotels | 10 / 1,675 rooms | 24,832 rooms (N=229–245 properties) | 6.7% |
| Business hotels | 3 / 100 rooms | 16,804 rooms (N=176–181 properties) | 0.6% |
| (Reference) all property types | 73 / 2,842 rooms | 52,243 rooms (N=1,033–1,181 properties) | 5.4% |
The denominator is the median room count of sellable inventory in the prefecture across daily observations in July 2026 / Source: MetroEngines Research, compiled by the HotelBank Editorial Team
The headline “5.4%” is only an average that fits no property type. If you run a business hotel, the directly competing new inventory is 100 rooms, or 0.6% of inventory. For city hotels the denominator is a small 3,155 rooms, so 696 new rooms amount to 22.1% of it. In the same prefecture, in the same year, supply pressure differs by roughly 37 times. The 90 rooms of vacation rentals and cottages and the 96 rooms of hostels and guesthouses sit in different price bands and serve different reasons for staying, so there is little basis for adding them into hotel inventory as direct competition.
Location changes the effect too. Of the 2,842 rooms opening in 2026, Naha holds 1,510 rooms (53.1%), Miyakojima 535 rooms, Onna 394 rooms and Chatan 209 rooms — those four municipalities alone account for 2,648 rooms, or 93.2% of the total. Within Naha, the centre of gravity is five properties totalling 1,357 rooms: three city hotels with 696 rooms and two resort hotels with 661 rooms, with vacation rentals contributing just two projects and four rooms. Conversely, of Onna’s 8 projects and 394 rooms, three resort hotels account for 379 rooms; of Miyakojima’s 13 projects and 535 rooms, two resort hotels account for 410 rooms. “2,842 rooms in the prefecture” in fact collapses almost entirely into two clusters: large hotels in Naha and large resorts in the resort areas. In areas such as Nago (63 rooms), Motobu (51 rooms) and Ishigaki (40 rooms), the absolute volume of new inventory is small to begin with. For how rates are tiered on the outlying islands including Miyakojima and Ishigaki, see Autumn on Japan’s Islands: 2.37x ADR Gap Across 10 Municipalities, which breaks the picture down to the municipal level.
Estimated settled ADR beat the prior year in every type in finalised July — business +7.6%, resort +9.9%
More supply does not necessarily mean lower rates. Comparing finalised months against each other (July 2026 vs July 2025), estimated settled ADR for business hotels went ¥8,828 → ¥9,496 (+7.6%), resort hotels ¥18,983 → ¥20,864 (+9.9%) and city hotels ¥19,004 → ¥20,706 (+9.0%). All three types are above the same month a year earlier.
Source: MetroEngines Research, compiled by the HotelBank Editorial Team
Overlaying the years, the 2026 line runs above the 2025 line for both types across the finalised months of January to July (the dotted lines from August are current estimates and represent a mid-sale snapshot). What stands out is the shape. Business hotels post an annual peak of ¥10,648 in February (¥8,359 the same month a year earlier, +27.4%), above July’s ¥9,496. Resort hotels build a large peak across July and August, with July 2026 at ¥20,864. Within the same prefecture, the peaks of the pricing calendar for business and resort hotels fall in different months. Averaged across the seven finalised months of January to July, business hotels went ¥7,835 → ¥9,186 (+17.3%), resort hotels ¥14,120 → ¥16,830 (+19.2%) and city hotels ¥16,713 → ¥19,545 (+16.9%) — double-digit growth in every case.
| Scope | July 2026 (finalised) | July 2025 (finalised) | YoY | Jan–Jul average YoY |
|---|---|---|---|---|
| Okinawa, business hotels | ¥9,496 (N=195) | ¥8,828 (N=196) | +7.6% | +17.3% |
| Okinawa, resort hotels | ¥20,864 (N=279) | ¥18,983 (N=266) | +9.9% | +19.2% |
| Okinawa, city hotels | ¥20,706 (N=14) | ¥19,004 (N=11) | +9.0% | +16.9% |
| Naha, business hotels | ¥9,248 (N=103) | ¥8,918 (N=106) | +3.7% | +22.2% |
| Naha, city hotels | ¥21,078 (N=13) | ¥19,249 (N=10) | +9.5% | +17.2% |
Estimated settled ADR (roughly tax-exclusive), finalised months compared / Source: MetroEngines Research, compiled by the HotelBank Editorial Team
Here too the granularity changes what you see. In the single month of July, business hotels prefecture-wide are at +7.6% while business hotels in Naha grew less, at +3.7%. Yet on the January-to-July average, Naha is at +22.2%, ahead of the prefecture as a whole (+17.3%). Since the ranking flips between the single month and the cumulative figure, it is premature to conclude from one month alone that “Naha’s rates are being held down by new supply”. The two things worth holding on to as decision inputs are that the market level is running above the prior year, and that the number of properties in the city-hotel estimated settled ADR calculation has risen from 11 (July 2025) to 14 (July 2026) — in other words, new inventory is starting to enter the market’s own aggregation base. The pattern in which estimated settled ADR keeps beating the prior year even in a year of rising supply is not unique to Okinawa: applying the same lens to Nagasaki, where 2026 new supply reached 23 properties and 521 rooms — 2.6 times the prior year — business-hotel estimated settled ADR still ran above the prior year for seven consecutive finalised months.
Current booking pace — business hotels add 14.5 points from 45 days out
Now set supply and rates against the demand pace on the ground. Looking at the booking curve from 45 days before the stay date up to the present, business hotels in Okinawa for the Saturday 22 August 2026 stay date went from an estimated occupancy of 71.3% at 45 days out (22 August 2026 stay date, 45-day mark) to 78.3% at 30 days out and 85.8% with 10 days remaining (168–179 properties observed). The build-up over that period is +14.5 points.
Source: MetroEngines Research, compiled by the HotelBank Editorial Team
Later dates are still mid-curve. The Saturday 5 September stay date went from 72.7% at 45 days out to 78.6% at 30 days out; Saturday 12 September went from 70.3% to 76.0% (+5.7 points). In both cases the 45-day level sits in the low 70s, essentially the same starting point as 22 August. Resort hotels run a notch higher: 22 August went 81.4% at 45 days out → 84.4% at 30 days out → 88.5% with 10 days remaining (+7.1 points, 218–242 properties observed). Business hotels start low at 45 days and climb close in; resort hotels start high at 45 days and add little afterwards — two different shapes coexisting in the same prefecture. For the resort side broken down to individual properties, see Okinawa 176 Resorts: Obon vs Early Sep, 3.0pt Gap at 30 Days Out, which also covers the gap between Obon and early September at the 30-day mark.
Results from the month just past point the same way. Estimated occupancy (OTA-listed inventory basis) for July 2026 was 91.0% prefecture-wide (1,033–1,181 properties observed), 91.6% for business hotels (176–181 properties), 91.7% for resort hotels (229–245 properties) and 93.4% for city hotels (13–14 properties). By day of week, business hotels ran 96.1% on Saturdays against 88.6% on Mondays — a 7.5-point gap — and city hotels 97.7% on Saturdays against 91.7% on Mondays, a 6.0-point gap. Resort hotels stayed within 2.3 points (93.5% on Saturdays, 91.2% on Thursdays), the flattest day-of-week profile of the three. For the same reason that supply has to be divided back out by property type, the shape of day-of-week demand needs to be read by property type too.
For revenue managers running hotels in Okinawa — implications and an action plan
(1) Do not write “2,842 new rooms in the prefecture” into your own report as-is. When you share supply impact internally, first divide it back out against the denominator for your own property type. For a business hotel that is 0.6% of inventory; for a resort hotel 6.7%; for a city hotel 22.1% — and the conclusion changes with it. The 90 rooms of vacation rentals and cottages and the 96 rooms of hostels and guesthouses sit in different price bands and serve different reasons for staying, so before adding them in as direct competition, confirm whether they are actually taking bookings away from you.
(2) Divide back out by location as well as by property type. Naha holds 53.1% of the rooms opening in 2026, and Naha, Miyakojima, Onna and Chatan together hold 93.2%. If you operate in an area such as Nago (63 rooms), Motobu (51 rooms) or Ishigaki (40 rooms), there is a real distance between the impression the prefecture-wide total gives and the competitive environment in front of you. Conversely, the city- and resort-hotel band in Naha is the segment where new inventory is largest relative to its denominator anywhere in the prefecture.
(3) The market is not turning “more supply” into “lower rates”. Comparing finalised months, business +7.6%, resort +9.9% and city +9.0% (all July 2026 vs July 2025). If your own ADR for that month is growing well below those rates, there is room to look for the explanatory variable in your own pricing design and inventory allocation rather than in the supply environment.
(4) The peak of the pricing calendar falls in a different month for each property type. Business-hotel estimated settled ADR reaches a high of ¥10,648 in February, while resort hotels build their peak across July and August. It is worth checking your rate-revision calendar against the shape of the finalised results to make sure you are not borrowing another property type’s sense of seasonality.
| Horizon | Action | Decision trigger (tied to figures in this article) | Purpose |
|---|---|---|---|
| Today to this week | Re-divide the supply count against your own property type’s denominator | If internal material is built on “2,842 rooms in the prefecture”, replace it with the inventory share of 0.6% / 6.7% / 22.1% | Correcting over- and under-stated views of supply |
| Overlay your own pace for the first half of September on the market curve | The market for the 5 September stay date is at 78.6% at 30 days out (business). If you are well below that at the same days remaining, investigate | Early detection of a lagging pace | |
| Within two weeks | Match day-of-week inventory allocation to your property type’s shape | Business hotels ran 96.1% on Saturdays and 88.6% on Mondays (7.5pt gap); resort hotels 2.3pt (July 2026) | Reducing lost business on trough days |
| Compare your own July ADR against the market’s finalised figures | The market is ¥9,496 (business) / ¥20,864 (resort) / ¥20,706 (city). If your YoY growth is well below the market, break down the drivers | Re-confirming your price-band position | |
| Looking to next month | Rebuild the rate-revision calendar around each property type’s seasonal shape | The shape of the finalised figures: business hotels peak in February at ¥10,648, resort hotels in July and August | Avoiding lost business in peak months |
| Rebuild the competitive set around “same property type, same area” | Work from the location concentration: Naha 1,510 rooms / Miyakojima 535 / Onna 394 / Chatan 209 | Improving the accuracy of the compset |
Source: MetroEngines Research, compiled by the HotelBank Editorial Team
Summary — three yardsticks for reading supply
1. Align the denominator by property type. Okinawa’s 2,842 new rooms in 2026 mean 100 rooms and an inventory share of 0.6% to a business hotel, and 696 rooms and 22.1% to a city hotel. The headline 5.4% matches no property type’s lived experience.
2. Align the denominator by location. 93.2% of the new rooms sit in four municipalities. For many areas, the prefecture-wide average is an overstatement.
3. Read rates by comparing finalised months. In finalised July 2026, business +7.6%, resort +9.9% and city +9.0%. Even in a year of rising supply, market rates ran above the prior year — so if your own growth is below the market, that gap needs to be explained by something other than supply. Figures for the current and future months are estimates based on the sales position at the time, and a straight comparison with the prior year’s finalised figures should wait for month-end finalisation.
About the Data
■ Data sources
Sources are MetroEngines Research & Consulting aggregations (OTA-listing-confirmed basis), compiled by the HotelBank Editorial Team. Breakdown of N: for estimated settled ADR, business hotels in Okinawa N=195 properties (July 2026) / N=196 properties (July 2025), resort hotels N=279 / 266 properties, city hotels N=14 / 11 properties; business hotels in Naha N=103 / 106 properties, city hotels N=13 / 10 properties. Properties observed for estimated occupancy: 1,033–1,181 prefecture-wide, 176–181 business, 229–245 resort, 13–14 city (range of daily observations in July 2026). Properties observed for the booking curves: 161–179 business, 211–242 resort. Openings are an annual tally for Okinawa: 137 properties in 2024, 127 in 2025, 73 in 2026. The recommended companion source for the building-plan pipeline is MLIT’s Statistical Survey on Building Construction.
■ Calculation assumptions
Definition of estimated occupancy: OTA-listed-inventory-based occupancy = 100 − 100 × rooms remaining on OTA listings ÷ total rooms. Scope is Okinawa; the completed-month result is July 2026, and the pace snapshots are the stay dates of 22 August, 5 September and 12 September 2026. The booking curves are based on observations from 45 days before the stay date up to the present. Definition of estimated settled ADR: the settled price level (roughly tax-exclusive) estimated from OTA and other sales data (lowest-plan level × property-type coefficient, ensembled across multiple channels). Past months are finalised values; current and future months are estimates based on the sales position at the time. Median error against published operating results is 6.6%. Inventory share is calculated as “new rooms opening in the year ÷ sellable inventory rooms of the same property type in the prefecture”, with the denominator taken as the median across daily observations in July 2026 (52,243 rooms prefecture-wide).
■ Limitations and caveats
Openings are compiled on an OTA-listing-confirmed basis. Only about 19% of properties are listed on an OTA before opening and more than half are listed only after opening, so the property and room counts for the most recent year (2026) may rise as further listings are confirmed (2026 is a partial-year tally). Estimated occupancy is an estimate based on the take-up of inventory sold on OTAs, and its definition differs from actual room occupancy (it reads higher). Estimated settled ADR for current and future months is a mid-sale snapshot, so a straight comparison with the prior year’s finalised figures should wait for month-end finalisation. For city hotels the calculation base has grown from 11 properties (July 2025) to 14 (July 2026), so the figures are affected by the change in sample. Data as of 14 August 2026. Sales positions and inventory move daily, so the figures in this article are a snapshot as at the time of retrieval.