

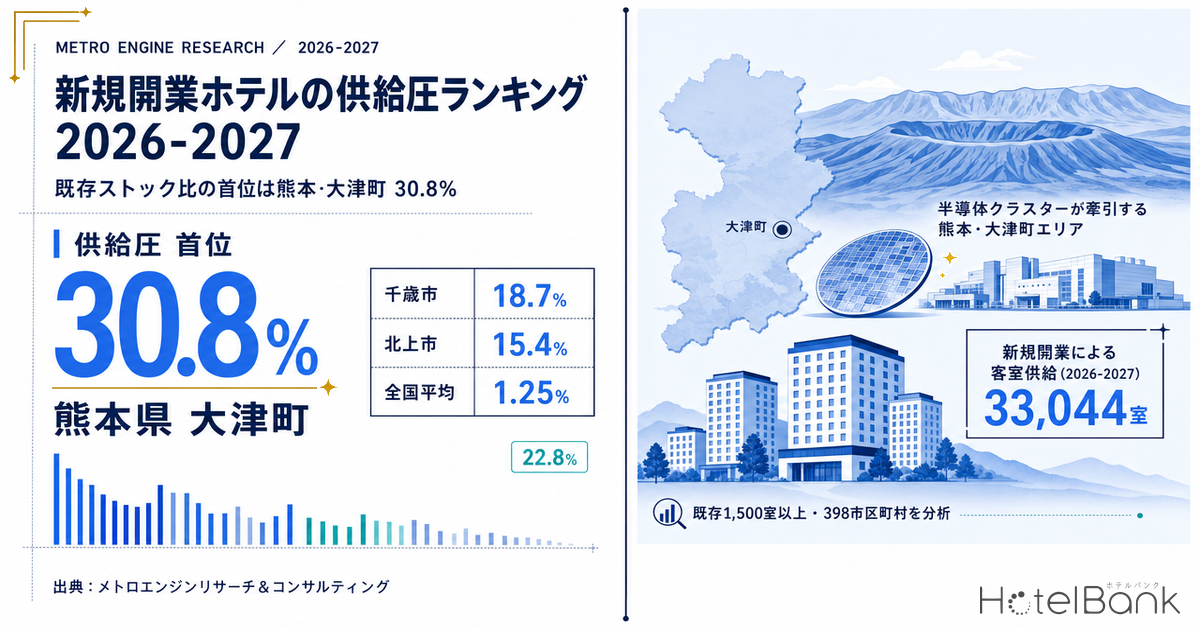
When we talk about new hotel openings, we almost always rank them by an absolute number: how many rooms were built. Line up the 1,172 properties and 33,044 rooms that opened across Japan in 2026 (as captured by MetroEngines Research, as of August 14, 2026) by municipality and by room count, and the top of the list is exactly what you would expect from the big cities — Naha 1,510 rooms, Chuo Ward in Osaka 1,275 rooms, Chuo Ward in Sapporo 902 rooms. But that ordering completely ignores how much room stock already exists. The same 500 rooms mean something entirely different when they land in a city with 20,000 existing rooms than when they land in a town with 1,500.
So in this article we re-measure supply pressure for every municipality in Japan using a ratio: rooms opened in 2026 divided by existing room stock. To strip out noise, we narrow the population to the 398 municipalities with at least 1,500 existing rooms, then sort by ratio. The top of that list is Ozu, Kumamoto (熊本県大津町) at 30.8%, followed by Chitose, Hokkaido at 18.7% and Kitakami, Iwate at 15.4% — and the regulars from the absolute-room-count ranking almost entirely disappear. We then connect the ranking to the construction pipeline for 2027 and beyond, to see which towns move into the same position next.
Metric Definitions Used in This Article
- Supply pressure (ratio to existing stock): per municipality, “rooms confirmed to have opened between January 1 and December 31, 2026 ÷ rooms already open as of the end of 2025” (properties with an unknown opening date are counted on the existing-stock side). Properties confirmed closed are excluded from both sides.
- ADR (average daily rate): an estimated settled rate (tax-excluded equivalent) calculated by applying a category-specific adjustment coefficient to the lowest published plan level each property lists on OTAs (double occupancy, per-room rate, tax included). Cross-checked against property-level results disclosed by listed hotel REITs (91 properties, most recent 3 months), the median error is about 7%. This is an estimate and differs from each property’s actual transacted rates and accounting figures. Area-level ADR is the median across the target properties (the level of a typical property in that area).
- OCC (occupancy rate): rooms sold as a share of total rooms in the area (estimated from OTA sales inventory). Used only at the prefecture level in this article.
- Data sources: MetroEngines Research & Consulting (based on confirmed OTA listings) / Ministry of Land, Infrastructure, Transport and Tourism (MLIT), “Construction Statistics Survey”
- — Re-rank the 33,044 rooms that opened in 2026 by ratio to existing stock and the leader is Ozu, Kumamoto at 30.8%. Naha, which tops the absolute count with 1,510 rooms, comes to just 6.2% against its 24,437 existing rooms.
- — Across the 398-municipality population (1,500+ existing rooms), combined supply pressure is 1.25%. Only nine municipalities exceed 10%, so supply pressure is extremely concentrated.
- — The leaders are not tourist destinations but business-demand cities pulled up by manufacturing capital investment. In the top three — Ozu, Chitose and Kitakami — zero rooms were rebrands, so the entire volume is genuinely new.
- — High supply pressure does not automatically mean falling rates. Ozu, at 30.8%, saw estimated settled ADR fall 11.1% year on year, but Chitose at 18.7% held +1.3% and Kure at 13.6% held +5.4%.
- — The confirmed pipeline from 2027 onward is 15 projects and 3,216 rooms (8 projects and 1,428 rooms in 2028). The 1,000 rooms planned for Mihama Ward in Chiba equal roughly 23% of its 4,329 existing rooms, so the ratio ranking can easily reshuffle.
Rank by absolute rooms and you get big cities; rank by ratio and a different map appears
First, we want to put the gap between absolute rooms and ratio on a single chart. The scatter below plots rooms opened in 2026 on the horizontal axis and the ratio to existing stock on the vertical axis, with bubble size representing the scale of existing room stock. The population is the 57 municipalities with at least 1,500 existing rooms and at least 150 rooms opened in 2026.
Source: MetroEngines Research & Consulting (based on confirmed OTA listings, N=57 municipalities)
The row strung out along the bottom right is the group of large cities that rank high on absolute rooms but land in the 1–3% range by ratio. Naha received the largest new supply in the country at 1,510 rooms, but against 24,437 existing rooms that is 6.2%. In Chuo Ward, Osaka, 1,275 rooms against 41,576 existing rooms is 3.1%; Minato Ward in Tokyo is 406 rooms, or just 1.2%. In central urban markets, new openings dissolve into an ocean of existing stock.
Ozu, Kumamoto sits alone in the upper left by contrast. Its 469 new rooms rank only 14th nationally in absolute terms, but against 1,523 existing rooms that is 30.8%. Rooms equal to roughly one third of the existing stock joined the market within a single year. Chitose, Hokkaido (635 rooms, 18.7%) and Kitakami, Iwate (392 rooms, 15.4%) sit in the same quadrant. None of the three stands out on the absolute ranking, where they place 8th, 14th and 20th.
Summed across the 398-municipality population, 24,961 rooms opened in 2026 against 1,989,992 existing rooms — a ratio of 1.25%. That is the national average supply pressure. At least one room was confirmed to have opened in 190 municipalities; of those, 32 are at 5% or above and only nine are at 10% or above. Supply pressure is extremely concentrated in a handful of towns.
The top 12 by supply pressure — 398 municipalities with 1,500+ existing rooms
The table below lists the top 12 by ratio. “Of which rebrand” shows the rooms where a brand-change date is recorded on the same day as the opening date — cases where the property is most likely an existing building that simply changed brands (we return to this point later).
| Rank | Municipality | Existing rooms | Opened 2026 | Properties | Of which rebrand | Supply pressure |
|---|---|---|---|---|---|---|
| 1 | Ozu, Kumamoto | 1,523 | 469 | 3 | 0 | 30.8% |
| 2 | Chitose, Hokkaido | 3,397 | 635 | 4 | 0 | 18.7% |
| 3 | Kitakami, Iwate | 2,545 | 392 | 2 | 0 | 15.4% |
| 4 | Kure, Hiroshima | 1,641 | 223 | 3 | 0 | 13.6% |
| 5 | Isahaya, Nagasaki | 1,740 | 230 | 3 | 0 | 13.2% |
| 6 | Hachimantai, Iwate | 1,904 | 237 | 2 | 229 | 12.4% |
| 7 | Kumagaya, Saitama | 2,122 | 245 | 1 | 0 | 11.5% |
| 8 | Nishinari Ward, Osaka | 4,733 | 531 | 6 | 308 | 11.2% |
| 9 | Maebashi, Gunma | 2,517 | 256 | 2 | 0 | 10.2% |
| 10 | Komatsu, Ishikawa | 1,806 | 171 | 1 | 0 | 9.5% |
| 11 | Tomakomai, Hokkaido | 2,041 | 176 | 4 | 48 | 8.6% |
| 12 | Matsuyama, Ehime | 8,675 | 696 | 7 | 245 | 8.0% |
Source: MetroEngines Research & Consulting (based on confirmed OTA listings, population N=398 municipalities with 1,500+ existing rooms)
Source: MetroEngines Research & Consulting (based on confirmed OTA listings)
The names at the top share a consistent character. Ozu neighbors Kikuyo, home to TSMC’s first Kumamoto fab, and all three properties that opened there in 2026 are new builds: Tabino Hotel Aso Kumamoto Airport (たびのホテル阿蘇熊本空港), the brand’s first location in Kyushu (213 rooms, opened April 17, 2026); the extended-stay Workers Hotel Kumamoto Ozu (ワーカーズホテル熊本大津, 202 rooms); and THE STILL HOTEL (54 rooms). Chitose is likewise dominated by new builds serving Rapidus-related business demand: Comfort Hotel Chitose (201 rooms) and Dormy Inn Chitose with its Tsurumai-no-Yu natural hot spring (天然温泉 鶴舞の湯 ドーミーイン千歳, 198 rooms) opened in June 2026, and Super Hotel Premier Chitose Natural Hot Spring (スーパーホテルPremier千歳天然温泉, 212 rooms) in August. Kitakami follows the same pattern, with Toyoko Inn Kitakami-eki Nishiguchi (東横INN北上駅西口, 225 rooms, March 2026) joined at the end of September by Sotetsu Fresa Inn Kitakami Ekimae (相鉄フレッサイン北上駅前, 167 rooms).
In other words, the top of the ratio-based supply pressure ranking is almost entirely made up of business-demand cities pulled up by manufacturing capital investment, not tourist destinations. Toyoko Inn Kure-eki in Kure (東横INN呉駅, 218 rooms, opened July 3, 2026 — the chain’s 349th location in Japan and 10th in Hiroshima Prefecture) and Super Hotel Nagasaki Isahaya Natural Hot Spring in Isahaya (スーパーホテル長崎・諫早天然温泉, 152 rooms, opened March 14, 2026 — the chain’s first location in Nagasaki Prefecture) are likewise aimed at business demand around the station. The smaller a town’s existing stock, the more a single building rewrites the entire market.
What happened to rates in the towns that absorbed supply — estimated settled ADR, year on year
High supply pressure does not necessarily weigh on rates. The chart below compares estimated settled ADR in July 2026 against the same month a year earlier for the top 10 municipalities. Kumagaya, Saitama is excluded because municipality-level aggregation was not available.
Source: MetroEngines Research & Consulting
| Municipality | Supply pressure | ADR Jul 2025 | ADR Jul 2026 | YoY | Properties |
|---|---|---|---|---|---|
| Ozu, Kumamoto | 30.8% | ¥9,100 | ¥8,100 | -11.1% | 13 |
| Chitose, Hokkaido | 18.7% | ¥16,500 | ¥16,700 | +1.3% | 25 |
| Kitakami, Iwate | 15.4% | ¥6,000 | ¥6,100 | +1.8% | 22 |
| Kure, Hiroshima | 13.6% | ¥5,700 | ¥6,100 | +5.4% | 23 |
| Isahaya, Nagasaki | 13.2% | ¥6,500 | ¥6,400 | -2.3% | 21 |
| Hachimantai, Iwate | 12.4% | ¥10,700 | ¥10,200 | -4.1% | 14 |
| Nishinari Ward, Osaka | 11.2% | ¥3,900 | ¥4,700 | +22.5% | 32 |
| Maebashi, Gunma | 10.2% | ¥7,500 | ¥7,100 | -4.6% | 31 |
| Komatsu, Ishikawa | 9.5% | ¥7,100 | ¥7,100 | +0.9% | 21 |
| Matsuyama, Ehime | 8.0% | ¥9,200 | ¥8,800 | -3.9% | 90 |
Source: MetroEngines Research & Consulting (property count is the number of properties used to calculate estimated settled ADR)
The results are not uniform. Ozu, at 30.8% supply pressure, fell 11.1% year on year — the sharpest rate decline in the top 10. That is a straightforward move immediately after rooms equal to a third of the existing stock arrived at once. Chitose, at 18.7%, held +1.3%, and Kitakami, at 15.4%, held +1.8% — both absorbing supply while staying positive. Kure, at 13.6%, managed +5.4%.
There is no simple inverse relationship between supply pressure and rate movement. What the data shows instead is the obvious structure: what determines rates is not the size of the supply shock but whether local demand is keeping pace with the added rooms. In Chitose’s case, the city has stated that before Rapidus arrived there were 29 hotels with roughly 2,800 rooms in the city, and that after its arrival 13 properties with roughly 1,300 rooms are expected to be added by 2029. In areas where demand growth is assumed to absorb the new supply, rates have not broken down even with double-digit supply pressure.
It is worth looking at estimated prefecture-level OCC alongside this. Estimated occupancy for July 2026 (all property categories) was 92.3% in Hokkaido (N=1,293 properties), 86.8% in Iwate (N=266), 86.8% in Hiroshima (N=372), 84.6% in Ehime (N=253), 84.2% in Kumamoto (N=436) and 81.7% in Nagasaki (N=381). For reference, Tokyo was 93.1% (N=1,354). Hokkaido is close to Tokyo’s level, which is consistent with Chitose holding its rate despite supply pressure.
How the ranking moves when the definition changes — supply pressure sensitivity
Everything so far rests on a single definition. But supply pressure is a metric whose value and ranking both shift depending on what you count as new, and presenting one point estimate is not enough to support an investment decision. So we varied the definition three ways and re-listed the values for the top 12 municipalities.
| Rank (scenario 1) | Municipality | 1. Listing basis this article | 2. Genuinely new basis rebrands excluded | 3. Full-year outlook basis unobserved pro-rated | Rank move under 2 |
|---|---|---|---|---|---|
| 1 | Ozu, Kumamoto | 30.8% | 30.8% | 33.4% | — |
| 2 | Chitose, Hokkaido | 18.7% | 18.7% | 20.3% | — |
| 3 | Kitakami, Iwate | 15.4% | 15.4% | 16.7% | — |
| 4 | Kure, Hiroshima | 13.6% | 13.6% | 14.7% | — |
| 5 | Isahaya, Nagasaki | 13.2% | 13.2% | 14.3% | — |
| 6 | Hachimantai, Iwate | 12.4% | 0.4% | 13.5% | ▼6 |
| 7 | Kumagaya, Saitama | 11.5% | 11.5% | 12.5% | ▲1 |
| 8 | Nishinari Ward, Osaka | 11.2% | 4.7% | 12.2% | ▼3 |
| 9 | Maebashi, Gunma | 10.2% | 10.2% | 11.0% | ▲2 |
| 10 | Komatsu, Ishikawa | 9.5% | 9.5% | 10.3% | ▲2 |
| 11 | Tomakomai, Hokkaido | 8.6% | 6.3% | 9.3% | ▲2 |
| 12 | Matsuyama, Ehime | 8.0% | 5.2% | 8.7% | ▲2 |
Source: MetroEngines Research & Consulting (based on confirmed OTA listings) ※ Scenario 1 is identical to the ranking in the body text. Scenario 2 subtracts the “of which rebrand” rooms from the numerator. Scenario 3 assumes that the 2,765 rooms confirmed nationally as scheduled to open on or after August 15, 2026 — equal to +8.4% of the 33,044 rooms already observed — are added uniformly to every municipality at the same rate (the pro-rating is an assumption; actual distribution will be skewed by town)
Scenario 2, the genuinely-new basis, is the one that bites. The five leading municipalities with zero rebrand rooms (Ozu, Chitose, Kitakami, Kure and Isahaya) do not move at all, while Hachimantai, Iwate — where 229 of 237 rooms were rebrands — falls from 12.4% to 0.4% and drops from 6th to 12th. Nishinari Ward in Osaka, with 308 of 531 rooms, falls from 11.2% to 4.7% (8th to 11th). Conversely, the definitional change benefits Maebashi, Komatsu, Tomakomai and Matsuyama, each of which climbs two places. The stability of a town’s rank is itself a test of whether its supply pressure is backed by something real.
Scenario 3, the full-year outlook basis, lifts the absolute levels at the top but does not reshuffle the order at all. Ozu rises to 33.4% and Chitose to 20.3%. Thin observation affects the level of the values, not the structure of the ranking. Put differently, the ranking in this article is robust to observation timing.
Positioning on two axes: supply pressure and rates
Cross supply pressure with the direction of rates and the leading municipalities split into four quadrants. For investment purposes, the quadrants worth watching are “high supply pressure but rates holding” and “mid-range supply pressure yet rates falling.”
| ADR YoY positive | ADR YoY negative | |
|---|---|---|
| Supply pressure: high 15% and above | Chitose, Hokkaido +1.3% Kitakami, Iwate +1.8% | Ozu, Kumamoto -11.1% |
| Supply pressure: mid 10–15% | Nishinari Ward, Osaka +22.5% Kure, Hiroshima +5.4% | Isahaya, Nagasaki -2.3% Hachimantai, Iwate -4.1% Maebashi, Gunma -4.6% |
| Supply pressure: low below 10% | Komatsu, Ishikawa +0.9% | Matsuyama, Ehime -3.9% |
Source: MetroEngines Research & Consulting (based on confirmed OTA listings, estimated settled ADR, July 2025 vs July 2026) ※ Kumagaya, Saitama is excluded because municipality-level ADR is not available, leaving 9 municipalities
Two of the three municipalities above 15% supply pressure (Chitose and Kitakami) sit on the positive side. In the 10–15% band, meanwhile, three municipalities cluster on the negative side: Isahaya, Hachimantai and Maebashi. This layout supports the observation in this article that the absolute level of supply pressure and the direction of rates are close to independent. Note that Nishinari Ward’s +22.5% comes with 308 of its 531 rooms being rebrands, so it substantially reflects a change in price positioning as existing properties switched brands and should be discounted accordingly.
The 15-year supply curve — what happened to a market that had not moved in 12 years
In towns where the ratio comes out high, supply had often been almost static right up until that point. We traced 15 years of year-end room stock for the representative trade areas of the top two municipalities.
Source: MetroEngines Research & Consulting (properties open and not yet closed as of each year-end)
Around Aso Kumamoto Airport (a 3 km radius centered on Tabino Hotel Aso Kumamoto Airport), room count actually edged down over 12 years, from 859 rooms across 9 properties in 2012 to 809 rooms across 9 properties in 2024. Then came 1,241 rooms across 12 properties in 2025 and 1,488 rooms across 13 properties in 2026 — a jump of +84% in two years. A market that had stood still for a long time was restructured wholesale in two years.
Chitose (a 3 km radius centered on Super Hotel Premier Chitose Natural Hot Spring) looks different. It built up steadily over 12 years, from 1,758 rooms across 15 properties in 2012 to 2,771 rooms across 30 properties in 2024 (+58%), then added another +25% over the past two years, reaching 2,831 rooms in 2025 and 3,466 in 2026. Here, additional depth landed on a market whose stock formation was already well advanced. Even within the same “top of the supply pressure ranking,” the premises an investor should start from are completely different.
From an investment standpoint, the shape of this curve is the essential information. A sharp increase after long stagnation (the Ozu pattern) suggests existing properties are likely still optimized in facilities and price band for an older pattern of demand, leaving room for a new entrant to compete on grade. In the continuous build-up pattern (the Chitose pattern), by contrast, the competitive environment has been refreshed repeatedly, so differentiation has to rest on something other than price band.
Geographic distribution of the top 10 municipalities by supply pressure
Plot the ratio leaders on a map and the scatter contrasts sharply with the absolute-room-count ranking, which concentrates in the major metropolitan areas. Circle size represents supply pressure, and color likewise represents its intensity.
Source: MetroEngines Research & Consulting ※ Coordinates are the locations of a representative property that opened in 2026 in each municipality
Hokkaido (Chitose), Iwate (Kitakami and Hachimantai), Gunma (Maebashi), Saitama (Kumagaya), Ishikawa (Komatsu), Osaka (Nishinari), Hiroshima (Kure), Ehime (Matsuyama), Nagasaki (Isahaya), Kumamoto (Ozu). They are spread almost evenly from north to south, which shows that “supply pressure in regional core cities” is not a phenomenon confined to any particular part of the country. We have also examined absorption capacity in regional core cities in our analysis of eight cities using Golden Week 2026 sellout observations and new openings, but re-ranking the whole country by ratio widens the field further.
Hotel rooms are not the only capacity a trade area has
If supply pressure is measured as a ratio to existing stock, what goes into the denominator becomes a live question. Bring short-term rental inventory into view alongside hotel rooms and the depth of capacity a trade area holds looks somewhat different. For the representative trade areas of the top two municipalities, we normalized short-term rental capacity per 100 hotel rooms.
| Trade area (3 km radius) | Short-term rental listings | Total listed capacity | Capacity per 100 hotel rooms |
|---|---|---|---|
| Centered on Tabino Hotel Aso Kumamoto Airport | 28 | 275 guests | 34.0 guests |
| Centered on Super Hotel Premier Chitose Natural Hot Spring | 70 | 308 guests | 13.3 guests |
Source: MetroEngines Research (as of August 14, 2026 / 3 km radius from each central property, identical query) ※ The denominator for normalization is the sum of rooms across hotels whose room counts could be determined in that trade area (808 rooms around Aso Kumamoto Airport, 2,309 rooms in Chitose), which covers a different set of properties from the 15-year supply curve above
Chitose has more listings at 70, but normalized by hotel rooms the area around Aso Kumamoto Airport is 2.6 times deeper at 34.0 guests per 100 rooms. The smaller a trade area’s hotel stock, the larger the relative presence of short-term rental inventory. That said, differences in volume reflect the regulatory environment — local ordinances and the like — at least as much as differences in demand. Note also that “short-term rental” in this article is not limited to the Private Lodging Business Act; it refers to listing-based short-term inventory including properties operating under the Hotel Business Act and special-zone rules. Listing counts do not match the number of filings recorded by the authorities.
22.8% of “2026 openings” are new in appearance only
Two caveats must always be applied when reading the figures above.
The first is rebrand contamination. Of the 33,044 rooms recorded as opening in 2026, 7,537 rooms — 22.8% — have a brand-change date recorded on the same day as the opening date. These are most likely rebrandings of existing buildings or changes of operator, not a net addition of rooms to the market. Within the ranking as well, 229 of Hachimantai’s 237 rooms, 308 of Nishinari Ward’s 531 rooms and 245 of Matsuyama’s 696 rooms fall into this category. Conversely, the top three (Ozu, Chitose and Kitakami) all have zero rebrand rooms, so the entire volume was genuinely new. That is part of why the top three are as strong as they are.
Source: MetroEngines Research & Consulting (based on confirmed OTA listings)
The second is asymmetry in the aggregation. In this article, properties whose opening date cannot be confirmed are counted on the existing-stock side. That is a conservative treatment designed to avoid overstating the new side, but it does make the ratios come out slightly modest. In addition, because OTA listings only appear a few months before opening, observation thins out for the most recent months onward. In fact, 31 properties with 2,765 rooms are already confirmed as scheduled to open on or after August 15, 2026, so the full-year 2026 figure will rise further. The ratios in this article should therefore be read as a floor as observed on August 14, 2026.
Distinguishing a genuinely new property from a rebrand at the individual level requires checking official announcements. Every leading property named in this article has been confirmed as a new build or new opening through the operator’s own press release. On how rates at newly opened properties ramp up, see also our ramp-up analysis of 91 properties that opened in 2025.
The pipeline from 2027 — where does the ratio spike next
Everything so far concerns what has already happened. So where will the same phenomenon occur from 2027 onward? Using construction plan data from MLIT’s “Construction Statistics Survey,” we aggregated project counts and room counts by scheduled completion year.
Source: Compiled by MetroEngines Research & Consulting from MLIT, “Construction Statistics Survey”
Scheduled for completion in 2027: 15 projects and 3,216 rooms; in 2028, 8 projects and 1,428 rooms; in 2029, 1 project and 100 rooms. Project counts decline year by year, but this must not be read as “plans dry up after 2028.” Because building confirmation applications are normally filed one to two years before opening, later years are structurally undercounted. The current figures are a floor for the confirmed pipeline and will certainly rise as further applications are filed.
| Scheduled completion | Location | Rooms | Type |
|---|---|---|---|
| December 2027 | Hibino, Mihama Ward, Chiba, Chiba Prefecture | 1,000 | New build |
| May 2027 | Kitanaka-dori, Naka Ward, Yokohama, Kanagawa Prefecture | 272 | New build |
| August 2027 | Uchi-Kanda, Chiyoda Ward, Tokyo | 261 | New build |
| April 2027 | Dojimahama, Kita Ward, Osaka, Osaka Prefecture | 220 | — |
| December 2027 | Shimogoryo, Furano, Hokkaido | 200 | New build |
| April 2027 | Ekimae-cho, Kita Ward, Okayama, Okayama Prefecture | 190 | New build |
| April 2027 | Kita 6-jo Nishi, Kita Ward, Sapporo, Hokkaido | 168 | New build |
| April 2027 | Kasakake-machi, Midori, Gunma Prefecture | 150 | — |
| September 2027 | Shokokuji Monzen-cho, Kamigyo Ward, Kyoto, Kyoto Prefecture | 135 | New build |
| February 2027 | Takata, Rikuzentakata, Iwate Prefecture | 134 | — |
Source: Compiled by MetroEngines Research & Consulting from MLIT, “Construction Statistics Survey” (top 10 by room count among projects scheduled for completion in 2027)
Read this list through the lens of the ratio to existing stock and three entries stand out: Mihama Ward in Chiba, Midori in Gunma and Rikuzentakata in Iwate. The 1,000 rooms in Mihama Ward correspond to the ¥30bn mixed-use development in front of Kaihin-Makuhari Station, equal to roughly 23% of the ward’s 4,329 existing rooms; since the ward already absorbed 301 rooms (7.0%) in 2026, that is an addition reaching close to 30% over two years. Midori, Gunma and Rikuzentakata, Iwate fall outside this article’s population because their existing stock is below 1,500 rooms, but 150 and 134 rooms respectively are extremely large relative to those towns’ stock. The smaller the existing base, the more completely a single project can rewrite the top of the ratio ranking.
The pipeline from 2027 also has to be read alongside soaring construction costs and constraints on securing staff. We cover that in detail in our analysis of the 2027–2029 opening map under +41% construction costs and a labor crunch. Higher construction costs raise the bar for new entrants, but for existing properties they are also an upside factor on the capacity side, keeping the competitive environment relatively benign.
Conclusion — manage supply pressure as a ratio, not a room count
Three points follow from this analysis.
First, an absolute room-count ranking cannot capture market impact on its own. Combined supply pressure across the 398 municipalities is just 1.25%, yet the top nine exceed 10%. Between Naha’s 1,510 rooms (6.2%) and Ozu’s 469 rooms (30.8%), it is the latter that moves its market by far the most. If you want to know where your own town stands, start by dividing by existing stock.
Second, high supply pressure does not translate directly into falling rates. Ozu, at 30.8%, saw estimated settled ADR fall 11.1% year on year, while Chitose at 18.7% held +1.3% and Kure at 13.6% held +5.4%. The dividing line is whether demand growth can absorb the supply, and business demand tied to manufacturing capital investment can supply that absorption. Put the other way round, entering the top of the supply pressure ranking does not in itself mean the market has lost its ability to support rates.
Third, the shape of the 15-year supply curve separates the premises of an investment decision. A market that was essentially flat for 12 years, like the area around Aso Kumamoto Airport, and one that built up continuously, like Chitose, differ completely in both the competitive environment a new entrant faces and the scope for existing properties to be renewed. The ratio ranking is an entry point; beyond it, a look at the time series is always required.
And then there is 2027 onward. The pipeline confirmed today is 3,216 rooms in 2027 and 1,428 rooms in 2028, but that is a floor and will grow. A single large project entering a town with a small existing stock is enough to reshuffle the ratio ranking. As long as supply pressure is tracked by absolute room count, that shift stays out of view.
⚠ Note on aggregation methods
- Room and property counts in this article are based on confirmed OTA listings within the scope captured by MetroEngines Research; they are not a complete census. Ryokan, minshuku and simple lodging facilities not listed on OTAs are excluded.
- Because OTA listings appear only a few months before opening, observation thins out for the most recent months onward. The full-year 2026 opening total will increase as further listings are confirmed (31 properties and 2,765 rooms are already confirmed as scheduled to open between August 15 and December 31, 2026).
- Properties whose opening date cannot be confirmed are counted on the existing-stock side. This avoids overstating the new side, but it does make the ratios come out modest.
- Construction plan data is based on building confirmation applications as of the survey date. Project and room counts are expected to increase as further applications are filed, so treat the current figures as a floor for the confirmed pipeline.
- “2026 openings” include apparent new supply arising from rebrands and renamings (7,537 rooms, or 22.8%, nationally). Distinguishing individual properties requires checking the operator’s official announcements.
Related Reading
- Supply Absorption Capacity in 8 Regional Core Cities — GW2026 Sellout Rates × New Openings
- Construction +41% & Labor Crunch Erase Japan’s 2027-2029 Hotel Supply
- TSMC Fab 2 & Kumamoto’s Chip Corridor: Kikuyo–Koshi–Ozu ADR 2024–2026
- Chitose & Tomakomai Worker Lodging — 7 New Hotels, 738 Rooms in 2026
- New Hotel ADR Ramp-Up: 91 Japan Openings Split Into 4 Pricing Types
- Kaihin-Makuhari 1,000-Room ¥30bn Mixed-Use: Breakeven ADR ¥13,200
- Iwate Hotel Market 2026: 2.2x ADR Gap, Morioka ¥200 Lodging Tax
References and Sources
■ Data sources
Room stock, newly opened rooms and closure information were aggregated by municipality from the property master that MetroEngines Research & Consulting maintains through confirmed OTA listings (as of August 14, 2026). Estimated settled ADR uses finalized monthly area aggregates (July 2025 / July 2026); estimated occupancy uses monthly prefecture-level estimates based on OTA sales inventory (July 2026). The pipeline from 2027 onward aggregates construction plan data from MLIT’s “Construction Statistics Survey” by scheduled completion year. Short-term rental inventory uses listing counts and listed capacity from an identical query within a 3 km radius of each central property.
■ Calculation assumptions
Supply pressure = “rooms confirmed to have opened between January 1 and December 31, 2026 ÷ rooms already open as of the end of 2025.” Properties with an unknown opening date are counted on the existing side, and properties confirmed closed are excluded from both numerator and denominator. To remove noise, the population is limited to the 398 municipalities with at least 1,500 existing rooms. In the sensitivity analysis, scenario 2 (genuinely new basis) subtracts from the numerator the rooms whose opening date and brand-change date are the same day; scenario 3 (full-year outlook basis) assumes that the nationally unobserved balance (the 2,765 rooms confirmed as scheduled to open on or after August 15, equal to +8.4% of the 33,044 rooms observed) is added uniformly to every municipality, though the actual distribution will be skewed by town. ADR is an estimated settled rate (tax-excluded equivalent) derived by applying a category-specific adjustment coefficient to the lowest published rate for double occupancy, per room, tax included; cross-checked against property-level results disclosed by listed hotel REITs (91 properties, most recent 3 months), the median error is about 7%.
■ Limitations and caveats
(1) Room and property counts in this article are based on confirmed OTA listings and are not a complete census; ryokan, minshuku and simple lodging facilities not listed on OTAs are excluded. (2) Because OTA listings appear only a few months before opening, observation thins out for the most recent months onward, so the ratios here are a floor as of August 14, 2026. (3) “2026 openings” include 7,537 rooms nationally (22.8%) that are new in appearance only due to rebrands or renamings; distinguishing individual properties requires confirming the operator’s official announcements. (4) Construction plan data is based on building confirmation applications and is structurally undercounted for later years, so it should be read as a floor for the confirmed pipeline. (5) Estimated settled ADR and estimated occupancy are both estimates and differ from each property’s actual transacted rates and accounting figures. (6) Short-term rental inventory is listing-based counts and capacity, does not match the number of filings recorded by the authorities, and the denominator used for normalization (the sum of rooms across hotels whose room counts could be determined in each trade area) covers a different set of properties from the 15-year supply curve. Occupancy of that inventory is outside the scope of observation, so it is not compared with hotel occupancy metrics.
■ Market data
- MetroEngines Research & Consulting — room stock and newly opened rooms (based on confirmed OTA listings), estimated settled ADR, estimated occupancy, trade-area supply time series, short-term rental listing counts
■ Government statistics and public data
- Ministry of Land, Infrastructure, Transport and Tourism (MLIT), “Construction Statistics Survey” (construction plan data, aggregated by scheduled completion year)
■ News and press releases
- Sun Frontier Fudousan, “Tabino Hotel brand’s first Kyushu location, Tabino Hotel Aso Kumamoto Airport, opens April 17, 2026”
- Super Hotel, “Super Hotel Nagasaki Isahaya Natural Hot Spring grand opening March 14, 2026” (PR TIMES)
- Toyoko Inn, “Toyoko INN Kure-eki opens July 3” (PR TIMES)
- Real Economy, “Comfort Hotel and Dormy Inn to open in Chitose in June 2026”
- Hokkaido Shimbun, “Rapidus effect drives hotel construction rush — 11 properties added in Chitose and Eniwa since 2023”
- Toyoko Inn, “Toyoko INN Kitakami-eki Nishiguchi opens March 2” (PR TIMES / 225 rooms, opened March 2, 2026)
- Chugoku Shimbun, “Toyoko Inn to open near JR Kure Station in 2026”