

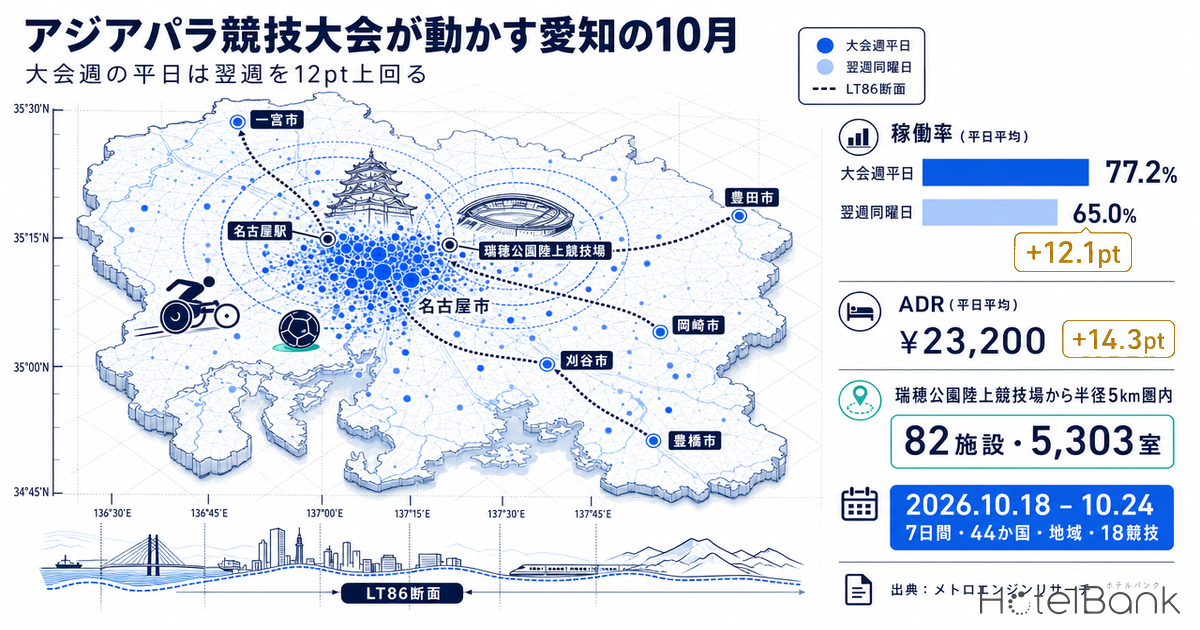
From Sunday 18 October to Saturday 24 October 2026, Aichi Prefecture will host the 5th Asian Para Games (2026 / Aichi-Nagoya). It is the first Asian Para Games ever held in Japan, bringing together roughly 2,700 athletes from 44 countries and regions across 18 sports at 19 venues within the prefecture. Seen from the lodging market, these seven days carry a demand shape that departs from the usual “weekends fill up” pattern. This article lines up Aichi’s October inventory take-up and pricing at an identical lead-time cross-section, and reads quantitatively what is already taking shape on the weekdays of the Games period.
Metric Definitions Used in This Article
- LT (lead time): the number of days remaining until the check-in date. LT0 = same day. Every comparison in this article is made at an identical LT cross-section (for each date, the point at which the same number of days remains until check-in).
- Occupancy rate (estimated, based on OTA-listed inventory): the share of rooms sold against the total room count within the area. The formula is (total rooms − remaining rooms) ÷ total rooms. It is an estimate based on the take-up of inventory offered for sale on OTAs, and differs from each property’s actual occupancy rate.
- Average price: the mean of listed prices observed at the same cross-section (double occupancy, per-room rate, tax included).
- ADR (average daily rate): an estimated settled rate (tax-exclusive equivalent) calculated by applying a category-specific adjustment coefficient to the lowest published plan level each property offers on OTAs. Cross-checked against property-level results disclosed by listed hotel REITs, the median error is approximately 7%. It is an estimate and differs from each property’s actual transacted rates or accounting figures. Area-level ADR is the median across the properties covered.
- Data source: MetroEngines Research
- — Across the seven days of the Games (18–24 October), estimated occupancy sits within a 76.1–78.0% band at the LT86 cross-section, and the weekday-versus-weekend gap all but disappears.
- — The five weekdays of the Games week average 77.2% against 65.0% for the same weekdays the following week — a gap of 12.1pt. Average price is also 27.6% higher, at ¥23,200 versus ¥18,200.
- — The largest uplift lands on business hotels: 14.3pt and a price gap of roughly 60%. Ryokan at 5.7pt and resort hotels at 3.0pt split the picture sharply by category.
- — On the supply side, the 5km radius around the main venue holds only 82 properties and 5,303 rooms, leaving the 386 properties and 43,010 rooms within 5km of Nagoya Station as the primary corridor.
- — Estimated settled ADR in the outlying host cities runs from ¥8,600 in Ichinomiya to ¥13,300 in Toyohashi, still 20–50% below Nakamura-ku, Nagoya at ¥18,100.
The Framework of the Games — Seven Days, 44 Countries and Regions, 18 Sports at 19 Venues
First, the givens of the Games, confirmed against primary sources. According to the outline published by the Japanese Para Sports Association, the official name is the 5th Asian Para Games (2026 / Aichi-Nagoya); the competition period runs seven days, from Sunday 18 October to Saturday 24 October 2026; the host area is Nagoya City, Aichi Prefecture and beyond; and participation covers 44 countries and regions with roughly 2,700 athletes. Operations are led by the Asian Paralympic Committee (APC) together with the Aichi-Nagoya 2026 Asian Games and Asian Para Games Organising Committee (AINAGOC). Eighteen sports are on the programme, and the official site lists 19 competition venues within the prefecture.
What matters for lodging demand is that the venues, while concentrated in Nagoya City, are also meaningfully dispersed into surrounding cities. The main athletics venue is Mizuho Park Athletic Stadium in Nagoya; boccia and swimming are at the Nagoya City General Gymnasium; wheelchair basketball is at Aichi International Arena. Meanwhile badminton is in Ichinomiya, goalball in Toyohashi, table tennis in Toyota (Skyhall Toyota), archery and sitting volleyball at Okazaki Chuo Sogo Park, and wheelchair rugby in Kariya (Wing Arena Kariya) — five cities outside Nagoya carry venues. Cycling alone, both track and road, is held at venues in the Izu area of Shizuoka Prefecture.
| Item | Details |
|---|---|
| Name of the Games | 5th Asian Para Games (2026 / Aichi-Nagoya) |
| Competition period | Sunday 18 October – Saturday 24 October 2026 / 7 days |
| Host area | Nagoya City, Aichi Prefecture and beyond |
| Scale of participation | 44 countries and regions / approx. 2,700 athletes |
| Sports on the programme | 18 sports (19 competition venues listed on the official site) |
| Main venue | Mizuho Park Athletic Stadium, Nagoya (athletics) |
| Host cities outside Nagoya | Ichinomiya, Toyohashi, Toyota, Okazaki, Kariya (plus cycling in the Izu area, Shizuoka Prefecture) |
Source: Japanese Para Sports Association, “Outline of the 5th Asian Para Games (2026 / Aichi-Nagoya)”; official site of the 5th Asian Para Games
October at an Identical LT Cross-Section — Games-Week Weekdays Run 12pt Above the Same Weekdays a Week Later
From here we move to internal data. For Aichi Prefecture as a whole (the 513–537 properties whose inventory MetroEngines Research observes, totalling 54,067–54,147 rooms), we tracked inventory take-up for each check-in date from 9 October to 31 October. Because the observation start point shifts by date, every comparison is aligned to a single LT86 cross-section (86 days remaining until check-in). This removes the apparent gap that would otherwise arise simply because the Games period sits at a shorter lead time.
The result was unambiguous. Across the seven days of the Games (18–24 October), estimated occupancy falls within a 76.1–78.0% range on every day, and the weekday-weekend gap virtually vanishes. By contrast, the weekdays of the following week (26–30 October) run at 63.3–67.3%. Matching days of the week: Monday 76.1% versus 66.0%, Tuesday 77.2% versus 63.3%, Wednesday 76.9% versus 63.4%, Thursday 77.7% versus 65.2%, Friday 78.0% versus 67.3%. Averaged across the five weekdays, that is 77.2% against 65.0% — a gap of 12.1pt.
Source: MetroEngines Research; compiled by the HotelBank Editorial Team
Pricing points the same way. At the same cross-section, average price on Games-week weekdays runs ¥22,400–¥24,400 (five-day average ¥23,200) against ¥17,400–¥19,400 for the same weekdays a week later (¥18,200) — a level gap of about 27.6%. Despite being weekdays, that price band sits well above the ordinary week’s Friday (¥19,400 on 30 October), even if it does not reach the ordinary week’s Saturday (¥27,000 on 31 October).
What about the weekends? Saturday 24 October is at 77.4% and ¥29,300; Saturday 31 October at 69.5% and ¥27,000 — a gap of only 7.9pt and 8.5%. Comparing Sunday 18 October with Sunday 25 October gives 9.6pt and 20.2%. In other words, the impact of the Games shows up far more vividly on the Tuesdays and Wednesdays that would ordinarily be troughs than on weekends that are already busy. This looks like a straightforward reflection of a structure in which the seven-day competition period keeps athletes, team officials, event staff and spectators all staying on consecutive nights.
| Day | Games week | Occupancy | Avg. price | Following week | Occupancy | Avg. price | Occupancy gap |
|---|---|---|---|---|---|---|---|
| Sun | 18 Oct | 77.8% | ¥22,300 | 25 Oct | 68.2% | ¥18,600 | +9.6pt |
| Mon | 19 Oct | 76.1% | ¥23,100 | 26 Oct | 66.0% | ¥18,200 | +10.1pt |
| Tue | 20 Oct | 77.2% | ¥22,400 | 27 Oct | 63.3% | ¥17,900 | +13.9pt |
| Wed | 21 Oct | 76.9% | ¥22,700 | 28 Oct | 63.4% | ¥17,400 | +13.5pt |
| Thu | 22 Oct | 77.7% | ¥23,200 | 29 Oct | 65.2% | ¥17,800 | +12.5pt |
| Fri | 23 Oct | 78.0% | ¥24,400 | 30 Oct | 67.3% | ¥19,400 | +10.7pt |
| Sat | 24 Oct | 77.4% | ¥29,300 | 31 Oct | 69.5% | ¥27,000 | +7.9pt |
LT86 cross-section. Observed property counts range from 366 to 530 per column (base population 513–537 properties, 54,067–54,147 rooms). Source: MetroEngines Research; compiled by the HotelBank Editorial Team
On the observed base: across all 23 days covered in this section, the number of properties observed at the LT86 cross-section runs from a minimum of 366 (25 October) to a maximum of 530 (23 October). Including the full curve (LT90 through the most recent observation), the observed property count ranges from 101 to 530; to keep thin cross-sections from manufacturing artificial troughs, every comparison here uses only the LT86 cross-section, where at least 366 properties are observed.
Broken Down by Category — Business Hotels Are the Core of the Capacity
Next, where this uplift actually lands by property category. At the same LT86 cross-section, we compared three Games-week weekdays (20, 21 and 22 October) against the same three weekdays the following week (27, 28 and 29 October), split by category.
The largest gap fell on business hotels. Taking the 282–287 properties and 42,499–42,636 rooms in Aichi as the base, average estimated occupancy on Games-week weekdays is 77.9% against 63.6% the following week — a gap of 14.3pt. Average price is ¥19,500 versus ¥12,200, a level gap of roughly 60%. City hotels, at 28–29 properties and 4,908–5,059 rooms, are a small base and must be read with a margin, but they show 83.5% against 71.1% (a 12.4pt gap) and ¥27,000 against ¥20,500 (about 32%) — again a clear uplift.
By contrast, ryokan (106–118 properties, 2,195–2,397 rooms) show 59.8% against 54.1%, a 5.7pt gap, with prices essentially flat at 0.6%. Resort hotels (11 properties, 1,065 rooms) show 51.9% against 48.9%, a 3.0pt gap, with a 6.3% price difference. Ryokan and resorts sit mainly in onsen areas and along the bay, at a distance from the venues, in locations that Games-driven stays do not naturally reach. Read the other way, these categories retain a separate axis — autumn leisure demand — and room to fill independently of the Games. As a baseline for how Aichi’s business hotels behave by day of week in ordinary conditions, our earlier analysis of weekday occupancy patterns in Aichi and Hiroshima is a useful reference point.
LT86 cross-section. Games-week weekdays = 20, 21 and 22 Oct; following week = average of 27, 28 and 29 Oct. Observed property counts: business 196–280, city 17–29, ryokan 83–116, resort 5–11. Source: MetroEngines Research; compiled by the HotelBank Editorial Team
September’s Asian Games as a Leading Wave — A Yardstick for “Full”
In thinking about autumn 2026 in Aichi, one cannot leave out the fact that the 20th Asian Games (2026 / Aichi-Nagoya) precedes the Asian Para Games. That event runs 16 days, from Saturday 19 September to Sunday 4 October 2026, with 45 countries and regions participating. It is already within roughly 45 days of its opening, which makes it a useful yardstick for how tightly this market can fill.
At the same LT86 cross-section, 19 September — immediately after the Asian Games open — shows estimated occupancy of 90.6% and an average price of ¥38,100; 20 September shows 92.9% and ¥39,800. 25 September is at 91.7% and ¥29,000, and 28 September at 88.0% and ¥27,100. Against the 76.1–78.0% of the Asian Para Games period, that is 10 to 15pt higher. In the most recent observations (LT44 for 19 September, LT45 for 20 September), the figures have advanced further, to 93.1% and ¥43,200, and 95.4% and ¥43,800 respectively — another 2 to 3pt accumulated between LT86 and LT44.
There are two ways to read this. One is that Aichi’s lodging market carries enough demand density for inventory take-up to exceed 90%. The other is that the Asian Para Games period standing at around 77% today is, with more than 70 days still to go, entirely natural progress — with ample room to build from here. The trajectory September demonstrated, of continuing to climb beyond LT86, is a strong reference point when thinking about how to prepare capacity for October.
LT86 cross-section. Observed property counts: 303–397 for the Asian Games period, 379–530 for the Asian Para Games period. Source: MetroEngines Research; compiled by the HotelBank Editorial Team
Lodging Supply Around the Venues — 82 Properties and 5,303 Rooms Within 5km of the Main Venue
Having covered demand, the geography of supply deserves attention too. In the property master maintained by MetroEngines Research, counting a 5km radius around Mizuho Park Athletic Stadium, the main venue, gives 82 properties and 5,303 rooms among those whose room counts are known. Of these, 25 properties and 3,949 rooms are at a scale of 50 rooms or more. Against roughly 54,100 rooms observed across Aichi as a whole, the inventory placed within walking or short-transfer distance of the main venue works out to about a tenth of the total.
Within 5km of Nagoya Station, by contrast, 386 properties and 43,010 rooms are clustered, of which 219 properties and 40,061 rooms are at 50 rooms or more. That radius takes in the area around Nagoya Station along with the whole of Sakae and Fushimi. Given how limited the inventory nearest the venue is, it is natural to expect that most stays during the Games will run from the Nagoya Station and Sakae area, with subway travel out to the venues. The Meijo and Sakura-dori subway lines put the Mizuho Undojo area within 15 to 20 minutes of the city centre, making city-centre lodging combined with rail travel a realistic form of capacity.
Circle size reflects room count. Within a 5km radius of the main venue (N=82 properties, 5,303 rooms). Source: MetroEngines Research; compiled by the HotelBank Editorial Team
The Level Gap Between Central Nagoya and the Host Cities — Pricing Headroom Left in the Outlying Cities
Given that venues also sit in five cities outside Nagoya, price levels by ward and city are worth checking. Lining up estimated settled ADR (area median) for October 2026 by ward and city, Nakamura-ku in Nagoya comes in at ¥18,100 (N=61 properties) and Naka-ku at ¥15,900 (N=83 properties), with the two great clusters of Nagoya Station and Sakae forming the top of the prefecture (for how much Aichi’s ADR swings month to month, see our 18-month review of settled ADR in Aichi).
Against that, the outlying cities hosting venues stand at ¥13,300 in Toyohashi (N=18 properties), ¥12,300 in Toyota (N=27 properties), ¥12,100 in Kariya (N=7 properties), ¥11,000 in Okazaki (N=12 properties) and ¥8,600 in Ichinomiya (N=11 properties). The gap against Nakamura-ku reaches roughly 32% in Toyota, about 39% in Okazaki and around 52% in Ichinomiya. In other words, there exist clusters of properties within walking distance of a venue yet priced 20–50% below the city centre — which makes them entirely viable options for stays during the Games, both on price and on travel time.
From an operator’s point of view, there is clear upside here. On days when competition takes place at a venue outside Nagoya, the accommodation in that host city becomes the nearest base. Badminton at the Ichinomiya City Gymnasium, table tennis at Skyhall Toyota, archery and sitting volleyball at Okazaki Chuo Sogo Park, wheelchair rugby at Wing Arena Kariya, goalball at the Toyohashi City Gymnasium. As the competition schedule firms up, each host city gains a window in which, for that day alone, it carries drawing power equal to the city centre. The larger the price gap against the centre, the larger the scope for uplift within that window.
Estimated settled ADR for October 2026 (area median, tax-exclusive equivalent). Figures in parentheses are the number of properties covered. Source: MetroEngines Research; compiled by the HotelBank Editorial Team
Capacity for Accessible Rooms — Reading It Through Regulation and Vintage of Supply
Since this is an international para sports event, the supply of accessible rooms — wheelchair-accessible guest rooms above all — is an indispensable point in any discussion of supply and demand. On the regulatory side, the amendment to the Enforcement Order of the Barrier-Free Act that took effect on 1 September 2019 raised the required number of wheelchair-accessible guest rooms in newly built hotels and ryokan with a total floor area of 2,000 m² or more and 50 or more guest rooms, from the previous “at least one room” to “at least 1% of total guest rooms.” In structural terms, properties above that scale built from autumn 2019 onward carry accessible rooms in proportion to their total room count.
Viewed through that lens, within 5km of Nagoya Station, of the 219 properties at 50 rooms or more, 46 of the 214 whose opening year is known opened in September 2019 or later. That is a little over a fifth of the total, and it shows how much Nagoya’s lodging supply has turned over in the past few years. With more than 70 days still to run before the Games, a substantial volume of inventory remains available in the city centre, these newer large-scale properties included.
Beyond that, minimal steps and generous circulation are not solely a matter of new construction. Properties that have renovated their guest rooms and bathrooms, those with a flat route from the lift to the room, and those designed so that guests can manage entirely within the room rather than relying on a communal bath, can all serve as meaningful capacity during the Games. Taking stock of which of these conditions your own property meets, and stating them explicitly as facility information on OTAs, is a step with a direct effect on attracting guests over this period.
How Large Is the Gap in Room Terms — A Unit Conversion Based on the Definitions
Every comparison so far has been expressed as a percentage. As set out in this article’s metric definitions, estimated occupancy is “the share of rooms sold against the total room count,” and rearranging that gives a simple multiplication: estimated rooms sold = rooms covered × estimated occupancy. What follows is not a forecast but a unit conversion, using only the room counts and estimated occupancy figures already presented in this article. No new observations or assumptions have been added.
| Cross-section | Estimated occupancy | Estimated rooms sold | Gap vs. ordinary-week weekday |
|---|---|---|---|
| Ordinary-week weekday (average of 26–30 Oct) | 65.0% | 35,196 rooms | — |
| Games-week weekday (average of 19–23 Oct) | 77.2% | 41,801 rooms | +6,605 rooms |
| Level just after the September Games opened (observed, 19 Sep) | 90.6% | 49,057 rooms | +13,861 rooms |
Applied to the prefecture-wide total of 54,147 rooms, the 12.1pt gap between Games-week and ordinary-week weekdays amounts to roughly 6,605 rooms per night. Across five weekdays that is about 33,025 room-nights, and if take-up builds to the 90.6% September’s Asian Games demonstrated, the gap against an ordinary weekday widens to about 13,861 rooms. That room figure conveys the scale of the capacity question far better than the phrase “12.1pt.”
| Rooms covered | 51.9% | 63.6% | 77.2% | 83.5% | 90.6% |
|---|---|---|---|---|---|
| Resort hotels (1,065 rooms) | 553 rooms | 677 rooms | 822 rooms | 889 rooms | 965 rooms |
| Ryokan (2,397 rooms) | 1,244 rooms | 1,524 rooms | 1,850 rooms | 2,001 rooms | 2,172 rooms |
| City hotels (5,059 rooms) | 2,626 rooms | 3,218 rooms | 3,906 rooms | 4,224 rooms | 4,583 rooms |
| Business hotels (42,636 rooms) | 22,128 rooms | 27,116 rooms | 32,915 rooms | 35,601 rooms | 38,628 rooms |
| Aichi Prefecture total (54,147 rooms) | 28,102 rooms | 34,437 rooms | 41,801 rooms | 45,213 rooms | 49,057 rooms |
The estimated occupancy figures on the horizontal axis are the five levels observed in this article (resort 51.9%, business hotels the following week 63.6%, prefecture-wide weekday 77.2%, city hotels 83.5%, the September Games 90.6%); the vertical axis uses the room counts by category stated in the article. Source: MetroEngines Research; compiled by the HotelBank Editorial Team
Applying the same conversion by category makes the character of the gap plain. Because business hotels carry 14.3pt across 42,636 rooms, the increment is about 5,799 rooms; resort hotels, at 3.0pt across 1,065 rooms, give about 32 rooms — a 4.8-fold difference in ratio terms opens to a 181-fold difference in rooms. When designing capacity, the absolute volume of rooms in motion skews toward the categories with the larger stock, and that is easy to miss when looking only at percentages.
* This section is a unit conversion obtained by rearranging the metric definitions; it does not represent a demand forecast or a sell-out projection. The room counts and estimated occupancy figures used are all observed values already presented in the sections above.
Implications for Operators — A Seven-Day Consecutive Window on Weekdays
Organised from an operator’s perspective, the data so far comes down to three points.
First, the shape of demand is weekday-led. An ordinary October in Aichi traces a profile of low-to-mid 70s on Saturdays and mid-60s on Tuesdays and Wednesdays. During the Games that trough disappears, and all seven days line up uniformly at around 77%. Where consecutive-night demand is the main axis, multi-night packages and consecutive-stay discounts across the seven days fit better than settings made one night at a time. That weekday rates are already positioned a little over 20% above an ordinary week means the market has begun to price this structure in.
Second, the room to grow lies now rather than immediately before the event. As September’s Asian Games showed, this market builds further from the 90% range at LT86. Put the other way, a level of 77% at LT86 means the design freedom over how to allocate the remaining fifth of inventory is still in hand. Staged pricing, minimum-stay conditions, a review of cancellation terms — all of these are still within reach.
Third, pricing headroom remains in the outlying cities. Estimated settled ADR in Nakamura-ku, Nagoya is roughly double that of Ichinomiya. For properties in the outlying host cities, the competition schedule supplies a clear demand anchor, which assembles the grounds for considering rates a step above the ordinary market level. Current levels are, of course, a snapshot as at the time of the survey, and will move with future inventory additions and rate revisions. That is precisely why it is worth holding a cycle of revisiting your own sales design as the competition schedule is published.
Summary
The 5th Asian Para Games (2026 / Aichi-Nagoya) will be held over seven days, from 18 to 24 October 2026, at a scale of 44 countries and regions, roughly 2,700 athletes and 18 sports. Tracking Aichi’s lodging inventory at an identical LT cross-section, those seven days sit at estimated occupancy of 76.1–78.0% — 12.1pt above the same weekdays a week later on a weekday average, and 27.6% higher on price. In business hotels in particular, a 14.3pt gap and a price difference of about 60% are observed, indicating that the core of the capacity absorbing Games demand lies in this category.
On the supply side, inventory within 5km of the main venue is limited to 82 properties and 5,303 rooms, while 386 properties and 43,010 rooms cluster within 5km of Nagoya Station. Given that venues are dispersed across five cities outside Nagoya, alongside the primary corridor of city-centre lodging plus rail travel, a second pattern emerges in which Toyota, Okazaki, Ichinomiya, Toyohashi and Kariya each become the nearest base for a day. To the extent that a 20–50% price gap against the centre remains, so does the scope for uplift in those cities.
More than 70 days remain before the Games open. As September’s Asian Games showed, this market will build further from here. The current figure of 77% is not an end point but the very margin that can still be designed.
⚠ Note on data for future dates: the September–October 2026 check-in dates covered in this article all fall after the survey date (7 August 2026), and the estimated occupancy, average price and estimated settled ADR figures are in-progress observations based on the inventory and rates published on OTAs as at that point. With more than 70 days still to run before the Games, the figures will move with future inventory additions, rate revisions and cancellations. This article does not indicate a “sell-out” on any particular date or a final level to be reached; it compares progress at an identical lead-time cross-section.
Related Reading
References and Sources
■ Information on the Games (primary sources)
- Official site of the 5th Asian Para Games (2026 / Aichi-Nagoya)
- Same site, “Sports and Competition Venues”
- Japanese Para Sports Association, “Outline of the 5th Asian Para Games (2026 / Aichi-Nagoya)” (PDF)
- Japan Sports Agency, “The 20th Asian Games (2026 / Aichi-Nagoya) and the 5th Asian Para Games (2026 / Aichi-Nagoya)”
- Japanese Olympic Committee, “Aichi-Nagoya Asian Games”
■ Regulation and legislation
- City of Sendai, “To Lodging Operators” (amendment to the Barrier-Free Act, effective 1 September 2019) (PDF)
- Overview of the “Design Standards for Buildings Considering Smooth Mobility for Elderly and Disabled Persons in Hotels and Ryokan (Supplementary Edition)”
■ Data sources
The givens of the Games (period, scale of participation, sports, venues) come from the Japanese Para Sports Association’s outline and the official site of the Games as primary sources. Lodging supply and demand are based on estimated occupancy and average prices from the OTA-listed inventory in Aichi observed by MetroEngines Research (base population 513–537 properties, 54,067–54,147 rooms; observed as at 7 August 2026), with estimated settled ADR by ward and city given as the area median for October 2026 (at least three properties covered in each ward or city). Property counts, room counts and opening years around the venues come from the same firm’s property master.
■ Assumptions used
All comparisons between dates are aligned to an identical lead-time cross-section (LT86), removing apparent differences caused by differing lead times. To keep thinly observed cross-sections from manufacturing troughs, only LT86 cross-sections with at least 366 observed properties were used. The section “How large is the gap in room terms” is a unit conversion — estimated rooms sold = rooms covered × estimated occupancy — obtained by rearranging the article’s metric definition (estimated occupancy = the share of rooms sold against the total room count), and both axes use only the observed room counts and estimated occupancy figures presented in the article. It is not a forecast of occupancy or a sell-out projection.
■ Limitations and caveats
Occupancy is an estimate based on OTA-listed inventory and differs from each property’s actual occupancy rate. Estimated settled ADR is an estimate, with a median error of approximately 7% when cross-checked against REIT-disclosed results. The September–October 2026 dates covered here all fall after the survey date, and the figures are a snapshot as at the point of observation. The number of properties observed varies by check-in date, and values will move with future inventory additions, rate revisions and cancellations. Property and room counts around the venues are tallied only for properties whose room counts are known; the actual number of accessible rooms is not available as published data, and the discussion remains an inference from regulatory requirements and the vintage of supply.
■ Market data
- MetroEngines Research — estimated occupancy, average price and booking curves based on OTA-listed inventory in Aichi (base population 513–537 properties, 54,067–54,147 rooms; 366–530 properties observed at the LT86 cross-section)
- MetroEngines Research — estimated settled ADR by ward and city (October 2026; at least three properties covered in each ward or city)
- MetroEngines Research — property counts, room counts and opening years around the venues, based on the property master