

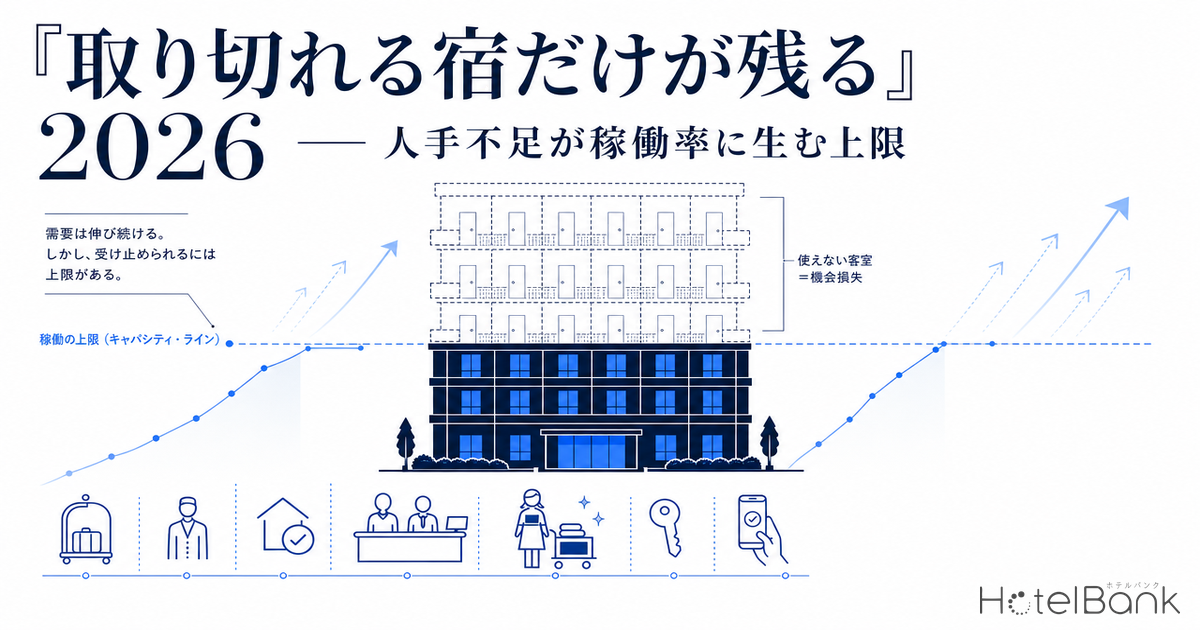
“Bookings keep coming in—but we can’t take them all.” That structural shift is what is quietly underway in Japan’s accommodation market across 2025 into 2026. Inbound demand has set fresh record highs, and it is no longer rare for areas to post double-digit year-on-year growth in published rates (ADR). And yet room occupancy (OCC) has struggled to rise—some REITs have even slipped below the prior year. This article reads, quantitatively, the structure in which demand exists but cannot be fully captured—what we might call the “capacity ceiling”—using OTA published-rate data from MetroEngines Research and the monthly operating results of listed hotel REITs, and frames, as an opportunity, the phase in which hotels equipped to “capture demand” are the ones chosen.
Metric Definitions Used in This Article
- ADR (Average Daily Rate): The average of selling prices published on OTAs and similar channels. This differs from actual transaction prices (it tends to run +25–30% above the booked ADR disclosed by REITs; because unsold higher-priced plans keep sitting on OTAs, the average of published rates is structurally skewed above transaction prices). Price per room for double occupancy (tax included), averaged across all plans (from room-only to meal-inclusive plans).
- OCC (Occupancy Rate): The share of sold rooms against the total room count in an area. Macro actuals use the Japan Tourism Agency “Overnight Travel Statistics Survey”; for REITs we use each company’s disclosed monthly operating results.
- LT (Lead Time): Days until the check-in date. LT0 = same day. Early sell-out LT = the lead time at which remaining rooms first reached zero (the larger the value, the earlier the sell-out).
- Data sources: MetroEngines Research / each REIT’s monthly operating data / Japan Tourism Agency “Overnight Travel Statistics Survey”.
- — Demand is strong yet OCC has hit a ceiling. While published ADR rises by double digits, room occupancy in the accommodation industry has reached its ceiling at about 62%, and labor shortages are creating a structure in which hotels “can’t take it all.”
- — Even in the April 2026 results of six listed hotel REITs, occupancy stays high in the 80% range, and year-on-year it is flat to down. The occupancy ceiling shows up in operating results too.
- — At small ryokan, labor constraints mean not all rooms can be put up for sale; even when demand exists, early sell-outs and zero remaining rooms are observed. A phase to capture revenue through ADR rather than occupancy.
- — The next axis of competition is the “capacity to capture demand.” We are shifting to a phase where hotels that can raise the ceiling itself—through labor-saving investment and optimized sales allocation—are the ones chosen.
Starting point: labor shortage in accommodation is among the worst of any industry
The starting point of the discussion is the labor-shortage surveys regularly published by the Japan Chamber of Commerce and Industry and the Tokyo Chamber of Commerce and Industry. As the share of SMEs reporting labor shortages reaches a near-record high, by sector the “accommodation and food service” industry ranks near the top—after nursing/care and construction—with roughly 70% of responding firms saying they feel a shortage of workers. Accommodation continues to occupy a corner of the industry group where labor shortages are most acute.
Labor shortages are not merely a matter of operational quality—”service can’t keep up.” More fundamentally, before rooms can be sold, the operating side caps the very number of rooms that can be sold. If staff for cleaning, the front desk, and meal service cannot be secured, a hotel must “stop selling” rooms even while holding inventory, and a ryokan “closes” certain floors or wings to throttle occupancy. However steeply the demand curve rises, if the ceiling of operating capacity is low, occupancy plateaus there. This is the central hypothesis of this article. At regional ryokan in particular, staffing constraints directly shape both the occupancy ceiling and ADR.
Source: Compiled by the HotelBank Editorial Team from the Japan Tourism Agency “Overnight Travel Statistics Survey (2025 annual figures, preliminary)”
Demand is strong: published rates are rising by double digits
First, let us confirm the premise that “demand is strong” through the movement of published rates. According to MetroEngines Research data, Kyoto’s ADR has shown consistent double-digit year-on-year growth since entering 2026. May 2026 was +24.7% YoY, July +26.7%, and August (the Obon holiday) +29.9%—the growth rate is in fact accelerating. Kyoto’s April 2026 ADR reached about ¥49,700 (+17.2% YoY, N=1,502 properties). For the backdrop to Kyoto’s price band shifting toward the high end, our analysis of Kyoto ADR +18.6% YoY and the price-band shift is also a useful reference.
The chart below overlays the monthly ADR of Kyoto and Tokyo by year. Aligning the horizontal axis from January to December lets the seasonality of each year (spring and autumn-foliage peaks) and the year-over-year step-up in levels be read at a glance. In 2026 (the dark-blue solid lines), both Kyoto and Tokyo are clearly tracking above the prior-year levels for the same months.
Source: Compiled by the HotelBank Editorial Team from MetroEngines Research
Behind the rising prices lie both cost pass-through and inbound demand. However, the mere fact that prices are rising does not mean supply is “keeping up with demand.” What matters more is the phenomenon that occupancy still fails to rise even as prices are raised—and here the shadow of the capacity ceiling appears.
The ceiling unmasked: occupancy plateaus at about 62%
According to the Japan Tourism Agency “Overnight Travel Statistics Survey,” the nationwide room occupancy rate in 2025 was 61.8% (+2.2 points YoY). By facility type, business hotels were 75.3%, city hotels 74.2%, resort hotels 56.9%, and ryokan 38.4%. While the number of foreign overnight guests rose +8.2% YoY to a fresh record high, the overall total was -0.8%, essentially flat.
Worth noting are the occupancy levels of business hotels and city hotels. Urban occupancy is heavily weekend-skewed with large day-of-week swings, and given the staffing constraints on cleaning and meal service, an annual average of around 75% is already close to the “practical ceiling.” Even when demand exists, selling out to full occupancy takes labor. If staff cannot be secured, decisions to throttle inventory on peak days (stop-sell) accumulate, and the annual occupancy rate tops out in this band. The low 38.4% level for ryokan, too, reflects not so much a shortage of demand as a structure in which the “number of rooms that can be accepted” is held down under the staffing constraints of supporting two-meal plans and in-room dining.
In other words, the combination of ADR rising by double digits while nationwide OCC stays in the low 60% range is precisely the evidence that excess demand and the capacity ceiling exist at the same time. Price speaks to the strength of demand, occupancy to the ceiling on the supply side—each tells a separate story. The gap between room-based occupancy and guest-capacity occupancy offers a further lens for reading this supply ceiling.
What REIT monthly results reveal: the “occupancy ceiling”
The same structure appears clearly in the monthly operating results of listed hotel REITs. The comparison set comprises the April 2026 results disclosed by Ichigo Hotel REIT Investment Corporation (3463), Invincible Investment Corporation (8963), Japan Hotel & Residential Investment Corporation (3472), Japan Hotel REIT Investment Corporation (8985), Hoshino Resorts REIT, Inc. (3287), and Kasumigaseki Hotel REIT Investment Corporation (401A).
Lining up each company’s disclosed figures, occupancy generally remains high, in the 80% range, while on a YoY basis occupancy at many of them has turned flat to down. For example, Invincible posted 85.8% occupancy across 101 domestic hotels (April 2026 results) (+0.8 points YoY), ADR ¥14,700 (-2.5% YoY). Japan Hotel REIT was at 85.8% occupancy (-0.4 points YoY) yet ADR +4.6%. Hoshino Resorts REIT was at 79.3% occupancy (-2.0 points YoY) with ADR roughly flat. Ichigo Hotel REIT was at 82.8% occupancy (-5.2 points YoY).
Source: Compiled by the HotelBank Editorial Team from each REIT’s monthly operating data (April 2026 results)
What should be read here is not the simplistic “occupancy fell, so it’s weak.” A level in the 80% range is, operationally, extremely high. Rather, what emerges is a picture in which, with physically limited room to add further occupancy, each company is supporting RevPAR through price (ADR). For a hotel that has reached its occupancy ceiling, the lever of revenue is shifting from “sell more” to “sell on better terms.” This is a rational strategy under a capacity ceiling, and at the same time it suggests that a major opportunity is being created for hotels able to raise the ceiling itself—that is, hotels with the “capacity to capture demand.”
| REIT | Occupancy | YoY change | ADR | ADR YoY |
|---|---|---|---|---|
| Japan Hotel & Residential (3472) | 88.6% | +6.7pt | ¥25,400 | -14.1% |
| Invincible (8963) | 85.8% | +0.8pt | ¥14,700 | -2.5% |
| Japan Hotel REIT (8985) | 85.8% | -0.4pt | ¥21,100 | +4.6% |
| Ichigo Hotel REIT (3463) | 82.8% | -5.2pt | ¥10,400 | -3.2% |
| Hoshino Resorts REIT (3287) | 79.3% | -2.0pt | ¥21,600 | +0.3% |
| Kasumigaseki Hotel REIT (401A) | 74.6% | — | ¥29,700 | — |
Source: Compiled by the HotelBank Editorial Team from each REIT’s monthly operating data (April 2026 results). Kasumigaseki Hotel REIT does not publish an official YoY tabulation, so the differences are omitted.
Bookings that “can’t be fully taken”: the view from small ryokan
The capacity ceiling shows up most vividly at small ryokan, where staffing constraints feed directly into the room count. In MetroEngines Research, when we tabulated the inventory trajectory for check-in on August 13, 2026 (the Obon peak day) for the ryokan category in Kyoto, of the 472 target properties we analyzed the 154 properties where occupancy could be confirmed, and further the 91 properties whose OTA-published allotment was 30% or more of total rooms.
Within that set, we observed small ryokan in the 6–20-room range exhausting their remaining rooms at an early lead-time stage. For instance, a kaiseki ryokan of about 6 rooms showed a continuing state of zero remaining rooms at the survey point (about 2–3 months before check-in), and a 12-room seaside inn showed zero remaining rooms as of LT78 (about 78 days before check-in). Note that the survey point for this article (mid-June 2026) is about two months before the Obon peak day, so these are “in-progress booking conditions observed at the present time.” They may change going forward through cancellations or additional inventory release.
| Property (Kyoto, ryokan) | Total rooms | Early sell-out LT | Days observed sold out |
|---|---|---|---|
| Kaiseki Ryokan Kinpeiro (料理旅館 金平楼) | 6 rooms | LT81 | 23 days |
| Sumikai, a sea-view inn (海を望む宿 澄海) | 12 rooms | LT78 | 21 days |
| Hanaoka Center, a lakeside inn (湖畔の宿 花丘センター) | 20 rooms | LT64 | 9 days |
| Kaiseki Ryokan Toriki (料理旅館 鳥喜) | 6 rooms | LT63 | 7 days |
Source: Compiled by the HotelBank Editorial Team from MetroEngines Research. Of 472 ryokan in Kyoto, 154 with confirmed occupancy and 91 with an OTA-published allotment of 30% or more were included in the tabulation. Check-in date August 13, 2026; in-progress data as of the survey point.
Such small ryokan, with few rooms to begin with, leave little on the table once they fill up. At the same time, on peak demand days the opportunity easily arises to think “if only we could take a few more.” Within the constraint of the staff who support cooking, meal service, and shuttle transport, how to maximize the number of rooms that can be accepted determines the revenue upside. Herein lies the room to grow through “building a capacity to capture demand”—optimizing staffing allocation and rethinking meal-service operations.
The opportunity frame: “capacity to capture demand” becomes the next axis of competition
Summarizing the analysis so far, Japan’s accommodation market in 2026 is characterized by three points. First, published rates are rising by double digits and demand is strong. Second, nationwide OCC tops out at about 62% and urban hotels at around 75%, while REIT occupancy also turns flat to slightly down YoY in the 80% range. Third, behind that ceiling lies an operating-side constraint—a labor shortage among the worst of any industry. Demand has not vanished; it simply cannot be fully captured.
Seen differently, this structure is also a major opportunity. That the occupancy ceiling weighs commonly on an entire area means that a hotel able to raise that ceiling even slightly—reducing stop-sells on peak days and reopening rooms that had been closed—stands to capture a relatively large revenue opportunity. Concretely, labor-saving investment in cleaning and meal service, automation of check-in operations, optimization of staffing shifts to match demand days, and a combination with phased dynamic pricing together form the “capacity to capture demand.”
In areas where strong drawing power has already been demonstrated, we are entering a phase in which there is more room to increase the number of rooms that can be accepted at a given price than to raise the price itself. From an era of chasing the demand curve to an era of raising one’s own supply ceiling. The phrase “only hotels that can capture demand survive” should be read not as pessimism but as a declaration of opportunity—that differences in operating structure translate directly into differences in revenue; in other words, that a clear upside awaits hotels that have put their operating structure in order.
⚠ A note on data for future dates: The Obon-period (August 2026) inventory and ADR in this article are in-progress values based on information published on OTAs at the survey point (mid-June 2026), and they fluctuate as the check-in date approaches. Properties observed with zero remaining rooms at present may see inventory return through cancellations or additional inventory release.
For hotels: plan-design tips that work in this phase
In a phase where capacity is capped, which demand you allocate your limited rooms to determines revenue. As tendencies seen in published plans—
Multi-night discounts to curb cleaning turnover Room-only / simplified meals to optimize staffing Early-booking perks to lock in peak-day inventory Strengthening higher-tier, rate-focused plans
* This organizes general tendencies in published plans and does not indicate any causal link in which naming or design generates sales.
Related reading
References & Sources
■ Market data
- MetroEngines Research — OTA published-rate data (prefecture-level ADR, inventory trajectory of 472 ryokan in Kyoto, etc.)
■ Government statistics & public data
- Japan Tourism Agency, “Overnight Travel Statistics Survey (2025 annual figures, preliminary)”
- Japan Chamber of Commerce and Industry / Tokyo Chamber of Commerce and Industry, “Survey on Labor Shortage Conditions”
- Ministry of Land, Infrastructure, Transport and Tourism, “Report on the Fact-Finding Survey on Workforce Securing and Development in the Accommodation Industry”
■ REIT & industry reports
- Invincible Investment Corporation, “Monthly Operating Status (April 2026)”
- Monthly operating data of each REIT (Ichigo / Japan Hotel & Residential / Japan Hotel REIT / Hoshino Resorts REIT / Kasumigaseki Hotel REIT)
■ News & references