

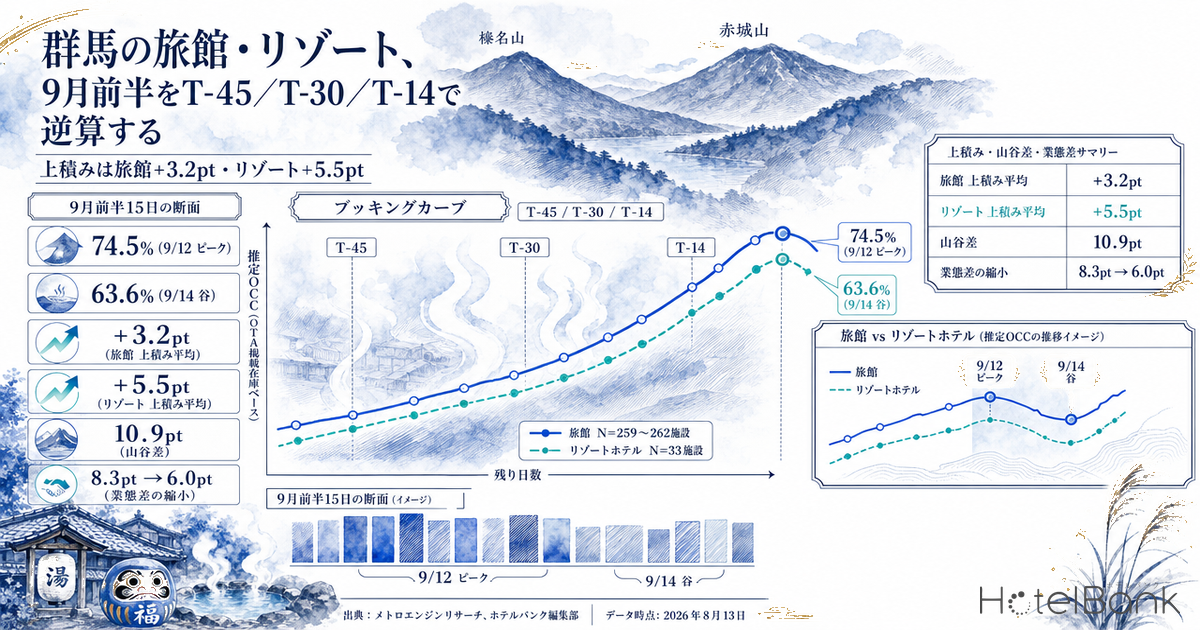
The first half of September (Sep 1–15) in Gunma now sits squarely in the “20 to 34 days to go” band on every property’s desk. For ryokan (259–262 properties in scope), lining up the 45-days-out reading against the latest observation for each stay date puts the peak at 74.5% on Sep 12 (Sat) (31 days out, 257 properties observed) and the trough at 63.6% on Sep 14 (Mon) (33 days out, 255 properties observed) — a 10.9pt spread. The gain accumulated between 45 days out and the latest reading averages +3.2pt for ryokan and +5.5pt for resort hotels (33 properties). The level gap between the two categories has also narrowed, from an average of 8.3pt at 45 days out to 6.0pt at the latest reading. This article splits those 15 days into three checkpoints — T-45, T-30 and T-14 — and reads “what gets decided when” purely along the occupancy axis. For the pricing side, Gunma Settled ADR June 2026: Business +2.9%, City -9.0%, Ryokan -3.9% breaks the picture down by category.
Scope: Gunma ryokan N=259–262 properties (varies by stay date), resort hotels N=33 properties. Occupancy in this article is an estimate based on OTA-published inventory (estimated OCC); the definition is given at the end of the article. Pricing metrics are not covered here. Data as of August 13, 2026.
- — Sep 12 (Sat) at 74.5% is the peak of the first half of September and Sep 14 (Mon) at 63.6% the trough. The 10.9pt spread shows that what Saturday builds up has not carried over into the start of the week.
- — Gains from 45 days out to the latest reading are +3.2pt for ryokan and +5.5pt for resort hotels. The level gap between categories has narrowed from 8.3pt at 45 days out to 6.0pt at the latest reading.
- — Roughly three quarters of the ryokan gain (+2.4pt of the +3.2pt) is decided between 45 and 30 days out. Acting after T-30 means sitting out the window in which the market moves most.
- — In the observed late-August stay dates, the build-up from 21 to 16 days out was a quiet +0.4 to +1.0pt, then +2.9 to +4.3pt moved by the time 9–11 days remained.
- — July 2026 actuals came in at 93.2% on Saturdays and 78.9% on Wednesdays for ryokan, versus 86.3% and 62.8% for resort hotels — the day-of-week amplitude differs sharply by category.
The 15-Day Cross-Section: Peak 74.5% on Sep 12 (Sat), Trough 63.6% on Sep 14 (Mon)
We start by lining up three points — 45 days out, 30 days out and the latest observation — for each of the 15 stay dates in the first half of September. Because the lead time of the latest observation ranges from 20 days remaining (Sep 1) to 34 days remaining (Sep 15) depending on the stay date, each row also carries the days remaining and the number of properties observed. The four dates from Sep 12 to Sep 15 have not yet reached the 30-days-out checkpoint, so that column is shown as “—”.
| Stay date | Ryokan 45d out | Ryokan 30d out | Ryokan latest | Ryokan Δ | Resort 45d out | Resort latest | Resort Δ |
|---|---|---|---|---|---|---|---|
| Sep 1 (Tue), 20 days out | 63.0% | 64.4% | 66.1% | +3.1pt | 51.6% | 59.2% | +7.6pt |
| Sep 2 (Wed), 21 days out | 64.9% | 66.7% | 67.4% | +2.5pt | 53.0% | 58.5% | +5.5pt |
| Sep 3 (Thu), 22 days out | 64.8% | 66.7% | 67.6% | +2.8pt | 54.6% | 60.5% | +5.9pt |
| Sep 4 (Fri), 23 days out | 64.2% | 65.9% | 67.2% | +3.0pt | 58.4% | 67.0% | +8.6pt |
| Sep 5 (Sat), 24 days out | 68.6% | 71.4% | 73.3% | +4.7pt | 61.4% | 67.9% | +6.5pt |
| Sep 6 (Sun), 25 days out | 65.1% | 65.6% | 66.9% | +1.8pt | 57.1% | 62.5% | +5.4pt |
| Sep 7 (Mon), 26 days out | 62.4% | 66.2% | 67.2% | +4.8pt | 53.5% | 58.0% | +4.5pt |
| Sep 8 (Tue), 27 days out | 63.7% | 67.2% | 67.6% | +3.9pt | 54.3% | 58.5% | +4.2pt |
| Sep 9 (Wed), 28 days out | 64.4% | 66.4% | 66.5% | +2.1pt | 51.8% | 57.2% | +5.4pt |
| Sep 10 (Thu), 29 days out | 64.4% | 66.4% | 66.9% | +2.5pt | 60.8% | 65.6% | +4.8pt |
| Sep 11 (Fri), 30 days out | 66.3% | 71.2% | 71.2% | +4.9pt | 66.5% | 72.1% | +5.6pt |
| Sep 12 (Sat), 31 days out | 71.6% | — | 74.5% | +2.9pt | 61.8% | 67.9% | +6.1pt |
| Sep 13 (Sun), 32 days out | 63.0% | — | 66.3% | +3.3pt | 57.1% | 61.3% | +4.2pt |
| Sep 14 (Mon), 33 days out | 60.4% | — | 63.6% | +3.2pt | 52.1% | 56.6% | +4.5pt |
| Sep 15 (Tue), 34 days out | 62.0% | — | 64.2% | +2.2pt | 50.9% | 53.8% | +2.9pt |
Estimated OCC (OTA-published inventory basis). Ryokan N=259–262 properties; properties observed 162–256 at 45 days out and 250–257 at the latest reading. Resort hotels N=33 properties; properties observed 28–33 at 45 days out and 32–33 at the latest reading. Source: MetroEngines Research, compiled by the HotelBank Editorial Team
In shape, the ryokan first half of September is “two weekend peaks plus a weekday plateau.” There are two peaks — 73.3% on Sep 5 (Sat) and 74.5% on Sep 12 (Sat) — and the weekdays in between stay within a narrow 66–68% band. Sep 11 (Fri) is worth noting: at 71.2% it sits at Saturday-like levels, 4.0pt above the 67.2% of Sep 4 (Fri). Within a first half of September that contains no three-day weekend, this weekend (Sep 11–12) is the thickest demand band.
The trough, on the other hand, is unmistakable. Sep 14 (Mon) at 63.6% and Sep 15 (Tue) at 64.2% are the two lowest of the 15 days. Measured from the Sep 12 peak (74.5%), that is a 10.9pt drop, and the back half of that week takes the shape of “what Saturday built up has not carried into Monday and Tuesday.” Sep 6 (Sun) at 66.9% has moved only +1.8pt from 45 days out, the thinnest gain of the 15 days.
Source: MetroEngines Research, compiled by the HotelBank Editorial Team
The Slope Differs by Category: Ryokan +3.2pt, Resort Hotels +5.5pt
Next we look at how much has accumulated between 45 days out and the latest reading. Averaged across the 15 days of early September, ryokan gained +3.2pt (minimum +1.8pt on Sep 6, maximum +4.9pt on Sep 11) and resort hotels +5.5pt (minimum +2.9pt on Sep 15, maximum +8.6pt on Sep 4). Over the same period and the same observation window, the resort hotel curve is distinctly steeper.
That difference has to be read together with the difference in starting point. At 45 days out, ryokan sit an average of 8.3pt higher, and by the latest reading that gap has narrowed to 6.0pt. In other words ryokan “start high early and fill in gradually,” while resort hotels “start low and catch up after the 45-day mark” — two different shapes. On Sep 4 (Fri) ryokan at 67.2% and resorts at 67.0% are essentially level, and on Sep 11 (Fri) resorts at 72.1% edge past ryokan at 71.2% by 0.9pt, the only reversal in the set. That said, with 33 properties in scope and 32–33 observed, the resort hotel sample is small enough that inventory added or withdrawn by one or two properties can move the aggregate — a caveat worth keeping in view.
Source: MetroEngines Research, compiled by the HotelBank Editorial Team
Tracing the Sep 5 (Sat) curve day by day, ryokan climb from 68.6% at 45 days out to 70.2% at 38 days out (+1.6pt), then flatten at 70.1–70.5% from 37 to 32 days out, and once past 71.4% at 30 days out the slope steepens again to 72.3% at 26 days and 73.3% at 24 days. It is a two-step staircase with a landing in between. Resort hotels on the same date move from 61.4% at 45 days out to 65.0% at 30 days out (+3.6pt) and then a further +2.9pt to 67.9% at 24 days out — a shallower landing and a more continuous build. Sep 12 (Sat) repeats the same relationship, with ryokan going from 71.6% at 45 days out to 74.5% at 31 days out and resorts from 61.8% to 67.9%.
The practical implication is simple. For ryokan, the gain accumulated between 45 and 30 days out averages +2.4pt (across the 11 days from Sep 1 to Sep 11 that have already passed the 30-day mark), which means roughly three quarters of the +3.2pt gain from 45 days out to the latest reading is decided in that window. Resort hotels are similar, with +3.9pt of the +5.5pt (about 70%) moving between 45 and 30 days out. The 15 days from T-45 to T-30 all but determine the shape of occupancy for the first half of September. How the level at 45 days out relates to the headroom left for the final stretch is examined by category in Tochigi Booking Curves by Type: Resort 81.1% at T-45, Only +2.6pt Left, which lines up a neighbouring prefecture on the same checkpoints.
What Gets Added Inside T-14: Gains Observed on Late-August Stay Dates
Stay dates in early September still have 20 or more days remaining and have not reached the T-14 checkpoint. So we look instead at six late-August dates that have already passed through that band, tracking the movement from 21 days out to the latest observation. Aug 21–23 are already at 9–11 days remaining, and Aug 28–30 have advanced to 16–18 days remaining.
| Stay date | Ryokan 21d out | Ryokan latest | Ryokan Δ | Resort 21d out | Resort latest | Resort Δ |
|---|---|---|---|---|---|---|
| Aug 21 (Fri), 9 days left | 75.3% | 78.2% | +2.9pt | 70.6% | 71.9% | +1.3pt |
| Aug 22 (Sat), 10 days left | 78.5% | 82.8% | +4.3pt | 76.2% | 78.8% | +2.6pt |
| Aug 23 (Sun), 11 days left | 76.8% | 80.0% | +3.2pt | 75.3% | 77.8% | +2.5pt |
| Aug 28 (Fri), 16 days left | 75.0% | 76.0% | +1.0pt | 70.7% | 72.3% | +1.6pt |
| Aug 29 (Sat), 17 days left | 77.7% | 78.5% | +0.8pt | 73.5% | 74.9% | +1.4pt |
| Aug 30 (Sun), 18 days left | 68.0% | 68.4% | +0.4pt | 63.8% | 64.7% | +0.9pt |
Estimated OCC (OTA-published inventory basis). Ryokan N=252–262 properties, 244–255 observed; resort hotels N=33 properties, 33 observed. Source: MetroEngines Research, compiled by the HotelBank Editorial Team
Across Aug 21–23, which have advanced from 21 days out to 9–11 days remaining, ryokan added +2.9 to +4.3pt and resort hotels +1.3 to +2.6pt. Aug 22 (Sat) in particular went from 78.5% at 21 days out to 82.8%, a +4.3pt move, showing that room to move still remained inside the final two-week band. Aug 28–30, still 16–18 days out, moved only +0.4 to +1.0pt for ryokan — evidence that “almost nothing accumulates between 21 and 16 days out.” Laid side by side, the six late-August dates reveal a sequence: 21 to 14 days out is quiet, and then another step comes in the final two weeks. If last-minute tactics are to be prepared for each early-September date, that quiet band is when the preparation should be finished.
The Day-of-Week Shape: In the Completed Month (July 2026), Saturday Hit 93.2% for Ryokan and 86.3% for Resorts
To check the “two weekend peaks plus a weekday plateau” reading against recent actuals, we turn to the most recent completed month. Estimated OCC for Gunma in July 2026 (observed on the day before the stay date) averaged 82.6% for the month for ryokan and 70.0% for resort hotels. Averaged by day of week, the picture is as follows.
July 2026, Gunma. Daily properties observed: ryokan 171–257, resort hotels 29–33. Saturday, Sunday and Monday are averages of four days each; Tuesday four days; Wednesday, Thursday and Friday five days each. Source: MetroEngines Research, compiled by the HotelBank Editorial Team
Ryokan post 93.2% on Saturday, 86.7% on Sunday and 83.0% on Friday, against 78.9% on Wednesday, 79.1% on Tuesday, 79.4% on Thursday and 79.6% on Monday — four weekdays bunched within a 0.7pt span. The Saturday-to-Wednesday gap is 14.3pt. Resort hotels are more extreme still, with 86.3% on Saturday against 62.8% on Wednesday, a 23.5pt spread. The high point of the month was Jul 18 (Sat), at 98.0% for ryokan (225 properties observed) and 95.3% for resort hotels (30 properties). July contains a public holiday weekend, so the level itself is not comparable with September; but the shape — Saturday standing out, weekdays lined up flat, and resort hotels showing the wider day-of-week amplitude — carries straight through into the early-September cross-section. The clustering of early-September ryokan weekdays at 66–68% is an extension of that flat weekday structure. A pronounced Saturday against flat weekdays is not unique to Gunma: Saitama Business Hotels: Sat 77.2% vs Sun 70.1%, Gap Widens to 11pt observes the same structure on a matched lead-time cross-section.
For Revenue Managers Running Ryokan and Resort Hotels in Gunma: Implications and an Action Plan
(1) Read your own curve by asking which step of the market staircase it is on. The market’s ryokan traced 68.6% at 45 days out → 71.4% at 30 days out → 73.3% at the latest reading for Sep 5 (Sat). When you line up the same stay date at the same three checkpoints, whether you were already below the market at 45 days out or were level then and lost ground over the run to 30 days out points to entirely different responses. The former is a product and inventory framing problem; the latter is a distribution and visibility problem.
(2) Build the calendar on the assumption that about three quarters of the gain is decided between 45 and 30 days out. Of the ryokan +3.2pt from 45 days out to the latest reading, an average +2.4pt moved between 45 and 30 days out, and for resort hotels +3.9pt of the +5.5pt fell in the same window. Start touching inventory or distribution after T-30 and you are acting only once the market’s most active window has passed. Conversely, stay dates from Sep 12 onward are right now standing at the entrance to that window.
(3) Treat the category difference as a timing difference, not a level difference. The gap between categories averages 8.3pt at 45 days out and narrows to 6.0pt at the latest reading. The slower start for resort hotels is more naturally read as a difference in the lead-time distribution itself, and judging them weak on the 45-days-out level alone means failing to price in the gain that follows (+5.5pt on average). Note again that this is an aggregate of 33 properties and can swing on inventory adjustments at a small number of them.
(4) There is room to shift the target segment between trough days and peak days. The 10.9pt drop between Sep 12 (Sat) at 74.5% and Sep 14 (Mon) at 63.6% is the largest in the first half of September. At the same time, Sep 11 (Fri) being as thick as a Saturday — 71.2% for ryokan and 72.1% for resort hotels — suggests Friday-departure one-night demand is concentrating in that week. That is material for considering Friday–Saturday multi-night stays, or routes that extend stays into the weekday trough (Sep 14–15).
| Time axis | Action | Decision trigger (figures from this article) | Objective |
|---|---|---|---|
| T-45 (framing product and inventory) | Fix the room types, meal configurations and minimum-stay rules to be sold for each target stay date | Stay dates where your own OCC at 45 days out is below the market ryokan average (Sep 5 = 68.6%, Sep 12 = 71.6%) | Enter the most active 45-to-30-days-out window with the product you intend to sell already in place |
| T-45 | Separate how inventory is released between the two weekend peaks (Sep 5, Sep 11–12) and the weekday plateau (Sep 1–3, Sep 8–10) | Market weekdays sit in a narrow 66–68% band while Sep 12 reaches 74.5% | Hold back upper-tier rooms on peak days and widen the entry point on trough days |
| T-30 (distribution and remaining-room allocation) | Compare your property against the market on the 30-days-out cross-section and revisit how visibility is allocated | Stay dates where the 45-to-30-days-out gain falls short of the market average (ryokan +2.4pt / resort hotels +3.9pt) | Detect early whether anything is being left on the table during the market’s most active window |
| T-30 | Prepare a receptacle for multi-night and nearby demand on the trough days (Sep 14, Sep 15) | The 10.9pt drop between Sep 12 (74.5%) and Sep 14 (63.6%) | Put the route that extends peak-day demand into the trough in place before the quiet band begins |
| T-14 (floors and last-minute tactics) | Decide in advance the floor on inventory to be moved in the final two weeks, and when to release it | Late-August ryokan moved +2.9 to +4.3pt from 21 days out to 9–11 days remaining (Aug 22: 78.5% → 82.8%) | Turn the decision into a rule rather than a case-by-case call, while room to move still remains in the final band |
| T-14 | Block the quiet band from 21 to 16 days out into the calendar first, as the working window for preparation and production | Gains on Aug 28–30 (16–18 days remaining) came to only +0.4 to +1.0pt for ryokan | Finish preparation while movement is small, so the final band can be spent on decisions alone |
Source: MetroEngines Research, compiled by the HotelBank Editorial Team
Converting the Gain into Room Nights: Three Observed Bands and a Two-Axis Grid
The gains in points used so far can be restated in room terms simply by rearranging the definition given at the top of this article (estimated OCC = 100 − 100 × rooms still listed ÷ total rooms). Since 1pt = 1% of total rooms, all that is needed is to multiply the observed gain by the room count in scope — 6,867–6,926 rooms for ryokan across the first half of September (treated below as roughly 6,900 rooms) and 2,919 rooms for resort hotels. The three bands take the minimum, average and maximum gains actually observed over the 15 days of early September and label them pessimistic, mid and optimistic; all three are unit conversions of observed values, not forecasts of future sales volume.
| Band | Ryokan gain | Converted at ~6,900 rooms | Resort hotel gain | Converted at 2,919 rooms |
|---|---|---|---|---|
| Pessimistic (observed minimum) | Ryokan +1.8pt (Sep 6) | 124 rooms | Resort hotels +2.9pt (Sep 15) | 85 rooms |
| Mid (15-day average) | Ryokan +3.2pt | 221 rooms | Resort hotels +5.5pt | 161 rooms |
| Optimistic (observed maximum) | Ryokan +4.9pt (Sep 11) | 338 rooms | Resort hotels +8.6pt (Sep 4) | 251 rooms |
Source: MetroEngines Research, compiled by the HotelBank Editorial Team
Read as a range, ryokan span 124 rooms at the minimum to 338 at the maximum, a 214-room spread within the observed band. Resort hotels, despite having less than half the ryokan room count, land at 85 to 251 rooms — a swing close to the ryokan one, because their gains are larger. To translate this to your own scale, the quickest route is the two axes below.
| Gain (observed) | 2,919 rooms | 4,000 rooms | 5,000 rooms | 6,000 rooms | 6,900 rooms |
|---|---|---|---|---|---|
| +1.8pt Ryokan minimum (Sep 6) | 53 rooms | 72 rooms | 90 rooms | 108 rooms | 124 rooms |
| +3.2pt Ryokan 15-day average | 93 rooms | 128 rooms | 160 rooms | 192 rooms | 221 rooms |
| +4.9pt Ryokan maximum (Sep 11) | 143 rooms | 196 rooms | 245 rooms | 294 rooms | 338 rooms |
| +5.5pt Resort hotel 15-day average | 161 rooms | 220 rooms | 275 rooms | 330 rooms | 380 rooms |
| +8.6pt Resort hotel maximum (Sep 4) | 251 rooms | 344 rooms | 430 rooms | 516 rooms | 593 rooms |
Source: MetroEngines Research, compiled by the HotelBank Editorial Team
Rows are the gains observed in this article and columns the room count in scope (2,919 rooms at the left edge = resort hotels, roughly 6,900 rooms at the right edge = the observed ryokan range); each cell is the simple conversion rooms × gain ÷ 100. Fit your own room count to a column and you can read straight off how many rooms a market-equivalent build-up would represent. For a 100-room property, for instance, 1pt equals 1 room, so the ryokan 15-day average of +3.2pt is 3 rooms and the resort hotel +5.5pt is 5 to 6 rooms. For any stay date where the T-45 to T-30 window falls short of the market average (ryokan +2.4pt / resort hotels +3.9pt), it is worth working out in advance how many rooms that shortfall represents.
Summary: Three Yardsticks
To work backwards through the first half of September in Gunma, three yardsticks are worth keeping for your own property.
First, the position at 45 days out. The market’s ryokan started from 68.6% on Sep 5 (Sat), 71.6% on Sep 12 (Sat) and 60.4–66.3% on weekdays. This is the report card on your product and inventory framing. Second, the slope from 45 to 30 days out. Ryokan +2.4pt and resort hotels +3.9pt are the market’s average gains, and more than 70% of the growth from 45 days out to the latest reading is concentrated in that window. Falling behind here reads as a distribution and visibility problem. Third, the headroom in the final two weeks. In the late-August observations, ryokan moved +2.9 to +4.3pt between 21 days out and 9–11 days remaining, while the stretch from 21 to 16 days out was a quiet +0.4 to +1.0pt. Knowing that sequence turns last-minute tactics from something improvised into something decided in advance and simply switched on.
Stay dates in the first half of September now have 20 to 34 days remaining. Dates from Sep 12 onward stand exactly at the entrance to T-30, and Sep 1–5 have already entered the preparation period for the final band. It is a good moment to line your property back up against the three checkpoints.
About the Data in This Article: Metric Definitions
· Definition of estimated OCC: occupancy on an OTA-published inventory basis = 100 − 100 × rooms still listed on OTAs ÷ total rooms. It is an estimate based on how far the inventory offered for sale on OTAs has been taken up, and is defined differently from actual room occupancy (it reads higher). This article refers to it as “estimated OCC (OTA-published inventory basis).”
· Booking curve: based on observations from 45 days before the stay date through to the latest reading. Scope is stay dates from September 1 to September 15, 2026, plus, for reference, stay dates of August 21–23 and August 28–30, 2026.
· Day-of-week values are Gunma daily actuals for July 2026 (a completed month), observed as of the day before the stay date. Daily properties observed: ryokan 171–257, resort hotels 29–33.
· Breakdown of N in scope: Gunma ryokan number 259–262 properties depending on the stay date (total rooms 6,867–6,926) and resort hotels 33 properties (total rooms 2,919). Properties observed on each day of early September are 162–256 at 45 days out and 250–257 at the latest reading for ryokan, and 28–33 at 45 days out and 32–33 at the latest reading for resort hotels. With only 33 properties in scope, the resort hotel aggregate is readily affected by the inventory position of a small number of properties.
· Data as of: August 13, 2026. Because sales status and inventory change daily, the figures in this article are a snapshot as of the time of retrieval.
■ Data Sources
Aggregated from daily observations of room inventory published on major OTAs (MetroEngines Research). Scope is 259–262 ryokan and 33 resort hotels in Gunma. Stay dates of September 1–15, 2026 and August 21–23 and August 28–30, 2026 use observations by lead time; day-of-week figures use July 2026 daily actuals (as of the day before the stay date). Data retrieved as of August 13, 2026.
■ Calculation Assumptions
Estimated OCC = 100 − 100 × rooms still listed on OTAs ÷ total rooms. The gain (pt) is the difference in estimated OCC between 45 days out and the checkpoint in question. Because the four dates from Sep 12 to Sep 15 have not yet reached the 30-days-out checkpoint, the 45-to-30-days-out average is calculated over the 11 days from Sep 1 to Sep 11 that have already reached it. The room conversion is “rooms in scope × gain (pt) ÷ 100,” using roughly 6,900 rooms for ryokan (against total rooms of 6,867–6,926 across the first half of September) and 2,919 rooms for resort hotels. All are unit conversions of observed values, not forecasts of future sales volume.
■ Limitations and Caveats
Estimated OCC is on an OTA-published inventory basis and is defined differently from actual room occupancy (it reads higher). With only 33 properties in scope, the resort hotel aggregate swings easily on inventory added or withdrawn by one or two properties. The number of properties observed varies by stay date and lead time; for ryokan in early September it ranges from 162–256 at 45 days out to 250–257 at the latest reading. All early-September stay dates are still on sale, and the figures in this article are a snapshot as of the time of retrieval.
Related Reading
- Gunma Hotel Market 2026: Four ADR Tiers and a ¥5,700 Upper-Mid Gap
- Gunma Settled ADR June 2026: Business +2.9%, City -9.0%, Ryokan -3.9%
- Tochigi Booking Curves by Type: Resort 81.1% at T-45, Only +2.6pt Left
- Oita Ryokan vs Resorts: 61.6% and 78.5% OCC 45 Days Out for Sep 12
- Nagano Late-Summer Booking Curve 2026: Ryokan -11.8pt at 45 Days Out
- Okayama Booking Curves: 3 Checkpoints, Aug 8 Late-Surges +11.8pt
- Kagoshima Summer Booking Curves: 23.2pt Gap by Type at 45 Days Out
- Saitama Business Hotels: Sat 77.2% vs Sun 70.1%, Gap Widens to 11pt