

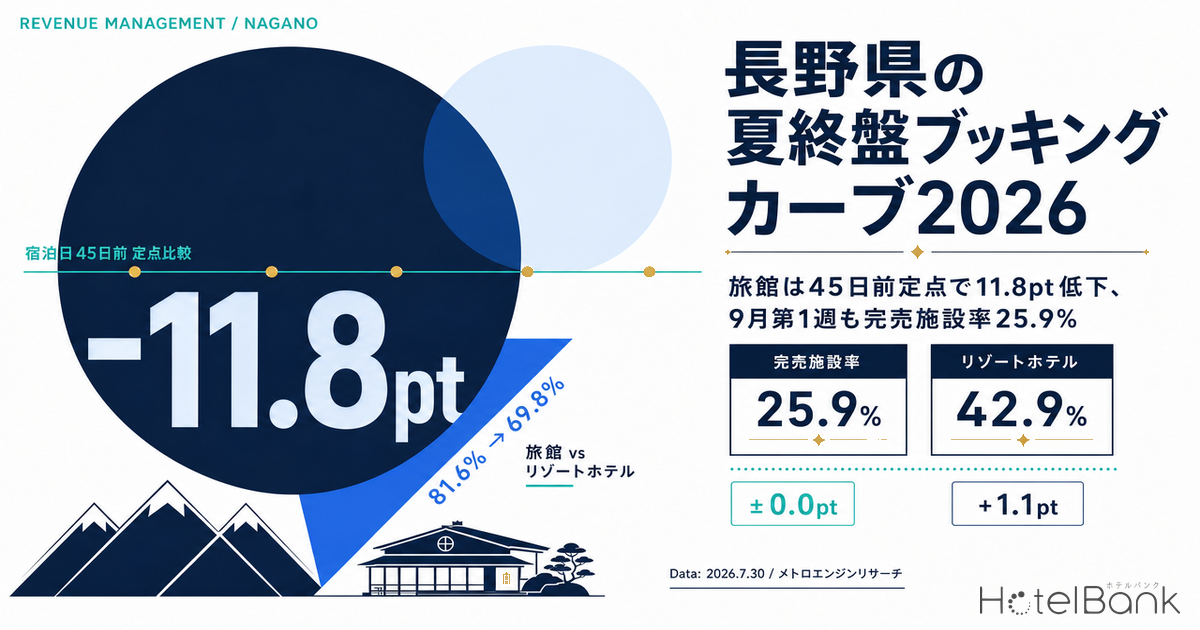
When Nagano’s late-summer booking progress (August through early September) is re-cut at a single common point — 45 days before the stay date — the shapes separate clearly by property category. Ryokan slide from an estimated OCC of 81.6% for Saturday, August 8, 2026 (as of July 2026) to 69.8% for Saturday, September 12, a 11.8pt decline, while resort hotels fall only 3.5pt, from 82.8% to 79.3%, tracking almost flat. On top of that, the build-up ryokan accumulate over the 15 days from 45 days out to 30 days out averages +3.6pt on Obon-period dates, but narrows to an average of just +1.1pt on weekdays in the final week of August. Even so, the share of properties with no listed inventory available on the first Saturday of September (September 5) reaches 25.9%, and 42.9% on Tuesday, September 1. Demand is not disappearing; what defines Nagano’s late summer is how widely the pace of inventory absorption diverges from property to property.
About the data in this article — Scope: resort hotels (N=85–104 properties per cut) and ryokan (N=268–457 per cut) in Nagano. This article deals only with the occupancy (OCC) axis and does not address price metrics. Occupancy figures are estimates based on OTA-listed inventory; definitions appear at the end of the article. Data as of July 30, 2026.
- — Ryokan drop 11.8pt at the 45-days-out fixed point. They step down from 81.6% on Saturday, August 8 to 69.8% on Saturday, September 12, while resort hotels fall only 3.5pt, from 82.8% to 79.3%.
- — The build-up momentum shrinks to one third. The gain accumulated over the 15 days from 45 days out to 30 days out narrows for ryokan from an Obon-period average of +3.6pt to an average of +1.1pt in the final week of August.
- — The Saturday premium disappears in the first week of September. Against a Tuesday–Friday average of 70.0% for ryokan, Saturday (September 5) also sits at 70.0% — a gap of ±0.0pt. The assumption that “only weekends fill” does not hold at the 45-days-out mark.
- — This is inventory concentration, not demand disappearance. Even on dates where estimated OCC sits around 70%, the sold-out property rate is 42.9% on Tuesday, September 1 and 25.9% on Saturday, September 5. Absorption skews toward small properties averaging 22.5 rooms each.
Line them up at 45 days out and only ryokan keep falling
When reading a booking curve, comparing “where are we now, in percent” for each stay date tells you little. August 14 and September 12 have different numbers of days remaining, so differences in progress and differences in time get mixed together. The chart below therefore cuts every stay date at the same remaining lead time — 45 days out — and lines up Saturdays only.
Nagano’s ryokan start at 81.6% for Saturday, August 8, then step down through 76.8% on Saturday, August 15, 75.8% on Saturday, August 22 and 74.9% on Saturday, August 29, landing around 70% at 70.0% on Saturday, September 5 and 69.8% on Saturday, September 12. The gap from the starting point is 11.8pt, and the descent is a staircase, one step at a time. Resort hotels, by contrast, run 82.8% → 79.9% → 80.4% → 82.4% → 77.6% → 79.3%, even recovering once on Saturday, August 29, and holding near 80% into September. The late-summer demand decay is not spreading uniformly across the prefecture; it is concentrated on the ryokan side.
Figure 1: Estimated OCC at 45 days before the stay date (Nagano / resort hotels and ryokan, six Saturdays from August 8 to September 12, 2026)
Source: Compiled by the HotelBank Editorial Team from MetroEngines Research data
Next, look at the table lining up three points for the same stay dates: 45 days out, 30 days out, and the most recent observation. What matters here is less the level of estimated OCC itself than the build-up from 45 days out to the latest reading (Δ), and the share of properties with no listed inventory at the latest point. For ryokan, Friday, August 14 moves from 81.1% at 45 days out to 87.5% at the latest reading (16 days remaining), a gain of +6.4pt, with a sold-out property rate of 53.0%. Saturday, September 5, meanwhile, sits at 70.0% at 45 days out and 70.0% at the latest reading (38 days remaining), ±0.0pt, with a sold-out property rate of 25.9%. September 5 has only been inside the observation window for a week, so thin build-up is to be expected — but it is worth noting that a quarter of properties already hold no listed inventory at that point.
| Stay date | Category | Estimated OCC, 45 days out | Estimated OCC, latest (days remaining) | Δ | Sold-out property rate (latest) | N (properties observed) |
|---|---|---|---|---|---|---|
| Aug 14 (Fri) | Resort | 81.5% | 90.7% (16 days) | +9.2pt | 36.8% | 104 |
| Aug 14 (Fri) | Ryokan | 81.1% | 87.5% (16 days) | +6.4pt | 53.0% | 441 |
| Aug 22 (Sat) | Resort | 80.4% | 86.8% (24 days) | +6.4pt | 28.3% | 103 |
| Aug 22 (Sat) | Ryokan | 75.8% | 79.7% (24 days) | +3.9pt | 35.6% | 441 |
| Aug 29 (Sat) | Resort | 82.4% | 87.7% (31 days) | +5.3pt | 31.7% | 100 |
| Aug 29 (Sat) | Ryokan | 74.9% | 76.4% (31 days) | +1.5pt | 32.6% | 442 |
| Sep 5 (Sat) | Resort | 77.6% | 79.2% (38 days) | +1.6pt | 21.2% | 101 |
| Sep 5 (Sat) | Ryokan | 70.0% | 70.0% (38 days) | ±0.0pt | 25.9% | 442 |
| Sep 12 (Sat) | Resort | 79.3% | 79.3% (45 days) | — | 20.2% | 101 |
| Sep 12 (Sat) | Ryokan | 69.8% | 69.8% (45 days) | — | 24.8% | 442 |
Source: Compiled by the HotelBank Editorial Team from MetroEngines Research data
Over the 15 days from 45 to 30 days out, the ryokan build-up falls to a third
To eliminate the differing lead times across stay dates entirely, compare the build-up over “the same 15 days” — from 45 days out to 30 days out. That interval is equally 15 days for every stay date, isolating the momentum of progress alone.
For ryokan, the Obon-period dates post +4.5pt on Saturday, August 8, +3.3pt on Friday, August 14, +3.0pt on Saturday, August 15 and +3.7pt on Saturday, August 22 — an average of +3.6pt across the four dates. Once the final week of August arrives, however, the figures become +0.8pt on Tuesday, August 25, −0.1pt on Wednesday, August 26, +2.0pt on Thursday, August 27 and +1.7pt on Friday, August 28, and the average narrows to +1.1pt. Read another way: the volume accumulated over the same 15 days falls to roughly one third.
Resort hotels present the opposite picture. The four Obon-period dates come in at +3.7pt / +4.0pt / +3.2pt / +4.9pt for an average of +4.0pt, and the four dates in the final week of August at +2.4pt / +3.7pt / +5.2pt / +5.3pt for an average of +4.2pt — holding at or above the Obon level. Even into late August, the 15-day build-up momentum has not weakened. In other words, ryokan face a double structure on late-summer dates: not only is the 45-days-out level lower, but the volume that accumulates afterwards is also smaller. The same approach — separating categories by the build-up measured from the 45-days-out baseline — holds in urban markets too, where the equivalent gain runs +25.7pt for business hotels, +14.5pt for city hotels and +1.9pt for capsule hotels in Tokyo.
| Stay date | Ryokan, 45 → 30 days out | Resort, 45 → 30 days out |
|---|---|---|
| Aug 8 (Sat) | 81.6% → 86.1% (+4.5pt) | 82.8% → 86.5% (+3.7pt) |
| Aug 14 (Fri) | 81.1% → 84.4% (+3.3pt) | 81.5% → 85.5% (+4.0pt) |
| Aug 15 (Sat) | 76.8% → 79.8% (+3.0pt) | 79.9% → 83.1% (+3.2pt) |
| Aug 22 (Sat) | 75.8% → 79.5% (+3.7pt) | 80.4% → 85.3% (+4.9pt) |
| Aug 25 (Tue) | 71.3% → 72.1% (+0.8pt) | 80.1% → 82.5% (+2.4pt) |
| Aug 26 (Wed) | 71.6% → 71.5% (−0.1pt) | 78.6% → 82.3% (+3.7pt) |
| Aug 27 (Thu) | 69.2% → 71.2% (+2.0pt) | 78.7% → 83.9% (+5.2pt) |
| Aug 28 (Fri) | 72.3% → 74.0% (+1.7pt) | 79.6% → 84.9% (+5.3pt) |
Source: Compiled by the HotelBank Editorial Team from MetroEngines Research data
Overlaying the shape of the booking curves themselves makes the difference even clearer. The chart below plots days remaining until the stay date on the horizontal axis (45 days out through the latest reading), showing ryokan for August 14, August 29 and September 5, plus resort hotels for August 29 as a comparison. Ryokan on August 14 climb steadily from 81.1% at 45 days out to 87.5% with 16 days remaining. Ryokan on August 29 move from 74.9% to 76.4% — almost flat, including a dip back to 75.1% around 35 days remaining. Ryokan on September 5 begin at 70.0% and stand at 70.0% today. For the same August 29, resort hotels climb from 82.4% to 87.7%, holding their slope throughout.
Figure 2: Shape of the booking curve (Nagano / ryokan for stays on August 14, August 29 and September 5, resort hotels for August 29; horizontal axis = days remaining until the stay date)
Source: Compiled by the HotelBank Editorial Team from MetroEngines Research data
In the first week of September, the ryokan Saturday premium vanishes at 45 days out
Setting aside day-of-week price differences, look only at the day-of-week pattern in occupancy. Lining up the final week of August (Aug 25–31) and the first week of September (Sep 1–7) by day of week at the same 45-days-out point shows the ryokan weekend lift flattening out from one week to the next.
In the final week of August, ryokan post 71.3% / 71.6% / 69.2% / 72.3% across the four weekdays from Tuesday to Friday — an average of 71.1% — with Saturday (Aug 29) at 74.9%. The Saturday lift is +3.8pt. In the first week of September, however, Tuesday through Friday come in at 71.5% / 70.1% / 68.6% / 69.8% for an average of 70.0%, and Saturday (Sep 5) also sits at 70.0%. The gap between Saturday and weekdays becomes ±0.0pt. In the second week of September (Sep 8–12, all at the 45-days-out point) the gap remains limited to +1.5pt, with a Tuesday–Friday average of 68.3% against 69.8% on Saturday (Sep 12). On the ryokan side, once September arrives, the premise that “at least the weekend fills” does not hold at the 45-days-out stage.
Resort hotels still show a Tuesday-to-Friday range of 72.2–80.4% in the first week of September, with Saturday (Sep 5) at 77.6% sitting mid-range. Compared with the final week of August (weekdays 78.6–80.1%, Saturday 82.4%), Saturday stands out less, but the level itself holds in the 76–80% band into September. Another resort characteristic: Friday (Sep 4) at 80.4% is the highest reading of the week.
Figure 3: Estimated OCC by day of week at 45 days out (Nagano / ryokan and resort hotels, final week of August vs. first week of September 2026)
Source: Compiled by the HotelBank Editorial Team from MetroEngines Research data
What matters here is that even in the first week of September, where estimated OCC has flattened, the share of properties with no listed inventory varies sharply by day of week. For ryokan, Tuesday, September 1, 2026 shows an estimated OCC of 71.1% at the latest reading (as of July 2026) against a sold-out property rate of 42.9%, and Wednesday, September 2 shows 69.7% against 41.2%. At roughly the same 70% estimated OCC, more than 40% of properties are listing no inventory on Tuesday and Wednesday, while Friday, Saturday and Sunday stay in the 23–26% range. The sold-out property rate is “the estimated share of properties for which no listed inventory can be confirmed on OTAs and similar channels,” and it lumps together properties that are genuinely full with properties that simply do not release weekday inventory and properties that are closed. The high weekday sold-out rate in September therefore reflects both the strength of demand and how inventory is being released. A room-level view of remaining inventory — rather than a property-level count — sharpens the picture when read alongside the property-based figures used here.
| Stay date (first week of September) | Ryokan, estimated OCC 45 days out | Ryokan, estimated OCC latest | Ryokan, sold-out property rate (latest) | Resort, estimated OCC 45 days out |
|---|---|---|---|---|
| Sep 1 (Tue) | 71.5% | 71.1% | 42.9% | 72.2% |
| Sep 2 (Wed) | 70.1% | 69.7% | 41.2% | 74.8% |
| Sep 3 (Thu) | 68.6% | 68.4% | 29.2% | 77.6% |
| Sep 4 (Fri) | 69.8% | 69.3% | 24.8% | 80.4% |
| Sep 5 (Sat) | 70.0% | 70.0% | 25.9% | 77.6% |
| Sep 6 (Sun) | 66.2% | 65.1% | 23.2% | 76.1% |
| Sep 7 (Mon) | 68.4% | 68.0% | 29.0% | 76.0% |
Source: Compiled by the HotelBank Editorial Team from MetroEngines Research data
For reference, here are the results for July 2026, the month just past (day-of-week averages of estimated OCC observed immediately before each stay date). Ryokan showed a 12.9pt spread between Saturday at 95.7% and Monday at 82.8%, while resort hotels showed a 4.8pt spread between Saturday at 93.3% and Monday at 88.5%. July was a month of “building right up to the date, with weekends breaking away” — in sharp contrast to the flat shape the 45-days-out cut shows for early September. Average rooms per property also backs up the category difference. As observed on July 30, Nagano’s resort hotels numbered 106 properties and 7,159 rooms (an average of 67.5 rooms per property), and ryokan 457 properties and 10,270 rooms (22.5 rooms per property). This size profile is the backdrop to the wide divergence, among ryokan, between the property-count-based sold-out rate and the room-count-based estimated OCC.
| Day of week | Ryokan, estimated OCC (July 2026 result) | Resort, estimated OCC (July 2026 result) |
|---|---|---|
| Mon | 82.8% | 88.5% |
| Tue | 86.8% | 90.1% |
| Wed | 85.1% | 88.8% |
| Thu | 84.9% | 90.1% |
| Fri | 87.6% | 92.2% |
| Sat | 95.7% | 93.3% |
| Sun | 86.4% | 91.9% |
Source: Compiled by the HotelBank Editorial Team from MetroEngines Research data
For revenue managers running resort hotels and ryokan in Nagano — implications and an action plan
Operator’s-eye insights
1. Overlay your own curve on the market at the same lead time. The 45-days-out cut for ryokan forms a staircase, dropping 11.8pt from 81.6% on Saturday, August 8 to 69.8% on Saturday, September 12. Simply lining up your own results for the same stay dates at the 45-days-out point and asking whether you are falling more steeply than that staircase, or more gently, makes it far easier to separate a pricing problem from a date-mix problem. Comparing the shape of the slope leads to fewer misreadings than comparing day-by-day absolute levels against the market.
2. For ryokan, the build-up over the 15 days from 45 to 30 days out shrinks from an Obon-period average of +3.6pt to +1.1pt in the final week of August. Use that interval as your own yardstick for “accumulating power.” If your 15-day build-up on dates from the final week of August onward stays around the market’s +1.1pt, that is market-normal, not an anomaly. Conversely, resort hotels hold +2.4 to +5.3pt over the same interval even in the final week of August, so if a resort-category date is stuck in the +1pt range, it is worth checking what is different about that specific date.
3. Design the first week of September without assuming “only the weekend fills.” For ryokan, that week runs at a Tuesday–Friday average of 70.0% and a Saturday of 70.0% — a gap of ±0.0pt. The +3.8pt Saturday lift seen in the final week of August has disappeared. Rather than building weekdays around a weekend anchor, there is room to treat weekdays and Saturday as equally strong days and to differentiate through the content of the stay itself — multi-night structures, meal conditions and the like.
4. The high weekday sold-out rate in September is also headroom in how inventory is released. For ryokan, Tuesday, September 1, 2026 shows an estimated OCC of 71.1% (as of July 2026) against a sold-out property rate of 42.9%, and Wednesday, September 2 shows 69.7% against 41.2%. While more than 40% of properties list no confirmable inventory, roughly 30% of rooms remain unsold on a room-count basis. Nagano’s ryokan average 22.5 rooms per property and are mostly small operations, a segment that includes a certain number of properties which throttle weekday inventory. If your property is set up to release weekday inventory, these days may present a relatively favorable environment for being chosen.
| Time horizon | Action | Decision trigger (figures from this article) | Objective |
|---|---|---|---|
| Today – this week | Re-plot your own occupancy for Saturday, August 29 onward at the 45-days-out point and overlay your slope on the market staircase (ryokan 74.9% → 70.0% → 69.8% / resort 82.4% → 77.6% → 79.3%) | If two or more dates show your 45-days-out level falling more steeply than the market staircase | Separating a pricing factor from a date-mix factor |
| Today – this week | Reorder your minimum inventory for September weekdays (Sep 1–4 and Sep 7) so that Tuesday and Wednesday are released first | If you are not listing inventory for Tuesday, September 1 or Wednesday, September 2 while the market sold-out property rate stays elevated at 42.9% and 41.2% | Securing visibility on days when few properties are listing inventory |
| Within two weeks | Treat weekdays and Saturday in the first week of September as days of equal demand strength, and extend multi-night (2+ night) design to the weekday side as well | If the market’s first week of September continues at a Tuesday–Friday average of 70.0% and a Saturday of 70.0%, holding at ±0.0pt | Moving away from weekend-weighted inventory design and lifting average length of stay |
| Within two weeks | Review the inventory allocation across meal conditions (one night with two meals, no dinner, breakfast only) for September weekdays and shift the range of choices toward weekdays | If your own 45-days-out occupancy for September weekdays falls below the market’s 68.4–71.5% range | Presenting stay conditions suited to weekday demand |
| Looking to next month | Switch to an operating routine that records “the build-up over the 15 days from 45 to 30 days out” as a monthly fixed-point indicator for your property | Using as baselines the market’s +3.6pt in the Obon period and +1.1pt in the final week of August for ryokan, and +4.0pt in the Obon period and +2.4 to +5.3pt in the final week of August for resorts | Judging progress without being misled by differing lead times |
| Looking to next month | For stay dates from mid-September onward, set a checkpoint to review initial inventory and condition settings the moment each date enters the 45-days-out window | Given that Saturday, September 12 starts at 69.8% for ryokan and 79.3% for resorts at 45 days out — the same level as the first week of September | Detecting a slow start already at the 45-days-out stage |
Source: Compiled by the HotelBank Editorial Team from MetroEngines Research data
Summary — three yardsticks for reading Nagano’s late summer
First, compare cuts at the same remaining lead time, not levels. Lined up at 45 days out, Nagano’s ryokan fall 11.8pt from 81.6% on Saturday, August 8 to 69.8% on Saturday, September 12, while resort hotels fall only 3.5pt, from 82.8% to 79.3%. The late-summer decay splits by category, and a prefecture-wide average hides it.
Second, measure build-up momentum over “the 15 days from 45 to 30 days out.” Ryokan narrow from an Obon-period average of +3.6pt to an average of +1.1pt in the final week of August — roughly one third — while resorts average +4.0pt in the Obon period and hold a +2.4 to +5.3pt range in the final week of August without losing momentum. The 45-days-out level and the build-up momentum are separate indicators; you cannot judge whether progress is good or bad without looking at both.
Third, read occupancy flattening and inventory concentration separately. While the gap between Saturday and weekdays flattens to ±0.0pt for ryokan in the first week of September, the sold-out property rate is 42.9% on Tuesday, September 1 and still 25.9% on Saturday, September 5. Behind an estimated OCC of around 70%, a polarization is under way between properties listing no inventory and properties holding unsold rooms. Demand has not disappeared; where the inventory sits has changed — and that is the starting point for designing the first half of September.
About the Data
Definition of estimated OCC (OTA-listed-inventory basis): “Occupancy on an OTA-listed-inventory basis = 100 − 100 × rooms remaining listed on OTAs ÷ total rooms. This is an estimate based on the absorption of inventory sold on OTAs and is defined differently from actual room occupancy (it reads higher).” Scope: resort hotels and ryokan in Nagano. Target stay dates are August 8 – September 12, 2026; results for the month just past cover July 2026 (observed immediately before each stay date, excluding days with observation coverage below 80%).
Booking curve: Based on observations from 45 days before the stay date through the latest reading. Fixed-point comparisons use three points: 45 days out, 30 days out, and the latest observation.
Sold-out property rate: The estimated share of properties for which no listed inventory can be confirmed on OTAs and similar channels. Properties that are genuinely full are counted together with properties that are not releasing inventory and properties that are closed. For stay dates more than 30 days ahead, figures can move as inventory is added or conditions change, so this article confines itself to describing the current listing status.
Price metrics: This article deals only with the occupancy (OCC) axis and does not use price metrics such as estimated settled ADR.
Breakdown of N: Nagano’s resort hotels comprise a population of 102–106 properties (106 properties and 7,159 rooms observed on July 30, 2026, averaging 67.5 rooms per property), of which N=85–104 properties could be confirmed as listed in each cut. Ryokan comprise a population of 449–459 properties (457 properties and 10,270 rooms observed on the same July 30, averaging 22.5 rooms per property), of which N=268–457 properties could be confirmed as listed in each cut. For some dates, the 45-days-out cut covers fewer observed properties than the latest cut.
Data as of July 30, 2026 (the final booking-curve observation date is July 29, 2026). Sales status and inventory move daily, so the figures in this article are a snapshot at the time of collection.
References and Sources
■ Data source
Daily observation data on OTA-listed prices and inventory by MetroEngines Research & Consulting. Scope: resort hotels and ryokan in Nagano; target stay dates August 8 – September 12, 2026; results for the month just past cover July 2026. The final observation date is July 29, 2026, and data are as of July 30, 2026. The population on that observation date comprised 106 resort hotels with 7,159 rooms (an average of 67.5 rooms per property) and 457 ryokan with 10,270 rooms (22.5 rooms per property).
■ Calculation assumptions
Estimated OCC (occupancy on an OTA-listed-inventory basis) = 100 − 100 × rooms remaining listed on OTAs ÷ total rooms. Fixed-point comparisons use three points — 45 days out, 30 days out and the latest observation — with the 45-days-out cut aligned to the same remaining lead time. The sold-out property rate is the share of properties for which no listed inventory can be confirmed on OTAs and similar channels (a property-based estimate). Day-of-week values are simple averages within the relevant cut, and results for the month just past exclude days with observation coverage below 80%. This article deals only with the occupancy (OCC) axis and does not use price metrics such as estimated settled ADR.
■ Limitations and caveats
(1) Estimated OCC is an estimate based on the absorption of inventory sold on OTAs and is defined differently from actual room occupancy (it reads higher). (2) The 45-days-out cut covers fewer observed properties than the latest cut. Observation coverage runs 59.7–97.8% for ryokan and 82.5–97.1% for resort hotels (96.9–98.4% and 96.2–98.1% respectively for the latest cut), with ryokan on the September 1 and September 2 stay dates lowest at around 60%; the 45-days-out levels for those two dates could move in either direction. (3) The sold-out property rate counts properties that are genuinely full together with properties not releasing weekday inventory and properties that are closed. (4) Stay dates more than 30 days ahead can move as inventory is added or conditions change, so this article confines itself to describing the current listing status. (5) Because the observation data span less than two years, year-on-year comparisons are not addressed.
■ Market data
The estimated OCC, sold-out property rate and observed property counts in this article are all aggregates from the proprietary observation data described above and have not been reconciled against public statistics. For adjacent topics such as Nagano’s demand environment and tax regime, see the main text and the related articles below.