

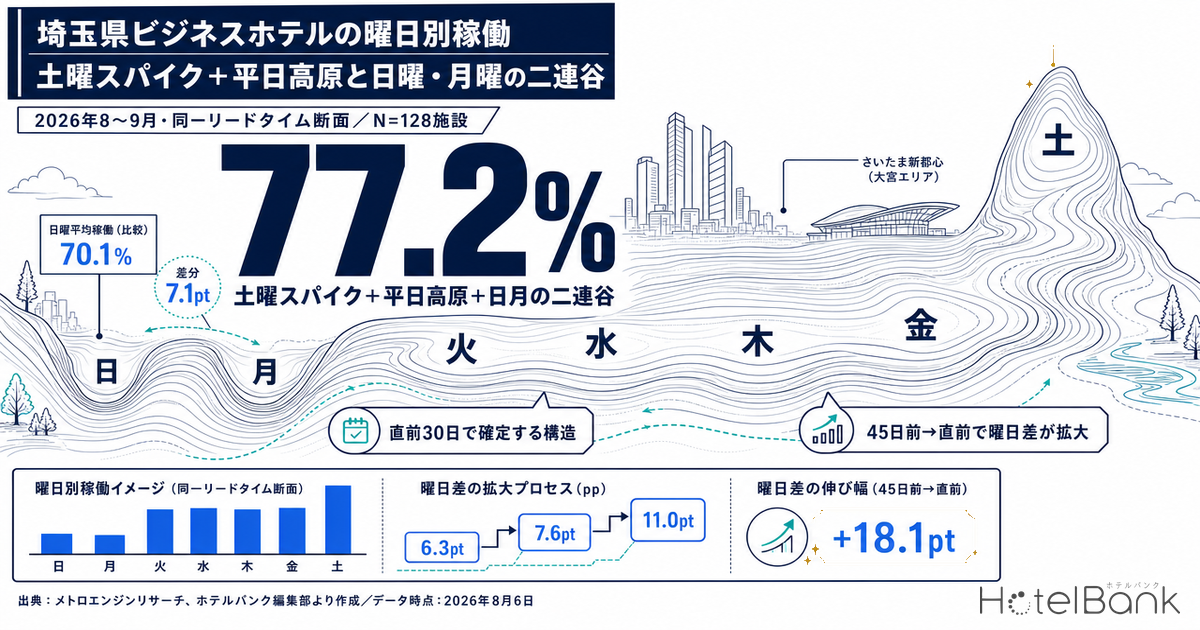
For business hotels in Saitama (a population of 128 properties), we aligned the four weeks of stay dates from August 17 to September 13, 2026 (28 days, exactly four of each weekday) to a single matched lead time — 39 days before the stay date. On that basis, estimated OCC (based on OTA-listed inventory) shows Saturday at 77.2% standing clearly apart, while Friday 72.9%, Wednesday 72.1%, Tuesday 71.5% and Thursday 71.4% cluster within a 1.5pt band, and Sunday 70.1% and Monday 70.4% form a trough. The gap between Saturday and last-placed Sunday is 7.1pt. Tracking July 2026 — a month whose stays have already been completed — at three points (45 days out, 30 days out, and just before arrival), the spread across weekdays widened from 6.3pt at T-45 to 7.6pt at T-30 and 11.0pt just before the stay date. Which weekdays win and lose at Saitama’s business hotels is not settled early; it is determined in the final 30 days.
Scope: business hotels in Saitama, N=128 properties (108–126 observed); city hotels shown for reference, N=12 properties (9–12 observed). This article does not cover price metrics; occupancy is presented solely as an estimate based on OTA-listed inventory. Definitions appear at the end of the article. Data as of: August 6, 2026.
- — Saturday 77.2%, Sunday 70.1% — on a snapshot aligned to 39 days before the stay date, the day-of-week spread at Saitama business hotels (N=128 properties) reaches 7.1pt.
- — Friday sits on the weekday side — Friday’s 72.9% is only 0.8pt above Wednesday’s 72.1%, but 4.3pt below Saturday. Treating the weekend as a two-day block does not hold here.
- — The day-of-week gap is decided in the final 30 days — in the completed month (July 2026), the spread went from 6.3pt at T-45 to 7.6pt at T-30 to 11.0pt just before arrival.
- — Midweek moves the most — pickup from T-30 to just before arrival was +18.1pt on Wednesday, +17.8pt on Thursday and +17.7pt on Tuesday, all above Saturday’s +16.8pt.
- — Sunday and Monday do not recover late — pickup over the same window was the smallest at +11.9pt and +13.7pt. Treat them as the two days that will not fill on their own.
To compare weekdays, first align the lead time
The first stumbling block in any discussion of day-of-week occupancy is the question of when the number was measured. Because booking curves accumulate as the stay date approaches, averaging a single observation-date snapshot by weekday puts next week’s Wednesday and a Saturday a month and a half out on the same footing. That is not a difference in demand by weekday — it is simply a difference in the number of days remaining until the stay date, that is, in lead time.
This article therefore uses fixed snapshots in which every stay date is measured the same number of days in advance. The scope is business hotels in Saitama, covering the 28 stay dates from Monday, August 17 to Sunday, September 13, 2026 — four consecutive weeks that exclude the Obon period and contain exactly four of each day from Monday through Sunday. Two snapshots were taken: 45 days before the stay date and 39 days before the stay date. T-39 is the closest common snapshot observable for every stay date in these four weeks (the final observation date is August 5, 2026).
The table below shows estimated OCC averaged by weekday at these two snapshots. The population is 128 properties, and the number of observed properties per snapshot ranged from 108 to 126.
| Day | T-45 snapshot | T-39 snapshot | Pickup (T-45 → T-39) | Days covered |
|---|---|---|---|---|
| Sat | 76.3% | 77.2% | +0.9pt | 4 |
| Fri | 72.4% | 72.9% | +0.5pt | 4 |
| Wed | 71.3% | 72.1% | +0.8pt | 4 |
| Tue | 70.7% | 71.5% | +0.8pt | 4 |
| Thu | 70.9% | 71.4% | +0.5pt | 4 |
| Mon | 69.7% | 70.4% | +0.7pt | 4 |
| Sun | 69.7% | 70.1% | +0.4pt | 4 |
| 7-day average | 71.6% | 72.2% | +0.6pt | 28 |
Source: MetroEngines Research; compiled by the HotelBank Editorial Team
Source: MetroEngines Research; compiled by the HotelBank Editorial Team
Charted, the shape is unmistakable. Saturday alone rises a full step above the rest; Tuesday, Wednesday, Thursday and Friday sit side by side at almost the same height; Sunday and Monday form a trough. This “Saturday spike, weekday plateau, back-to-back Sunday–Monday trough” is the day-of-week profile of Saitama’s business hotels. It differs from the pattern often seen in urban leisure markets, where Friday and Saturday are jointly elevated: here Friday (72.9%) sits only 0.8 to 1.4pt above Wednesday (72.1%) and Tuesday (71.5%). The straightforward reading is that weekend demand concentrates on Saturday alone, and Friday still belongs to the weekday group. For reference, the same day-of-week shape does not hold everywhere — in other prefectures the profile can take a different form entirely, with a Sunday trough paired with a Thursday peak, which is a useful yardstick for putting Saitama’s ordering in perspective.
The other column worth attention is the pickup figure on the right. Over the six days from T-45 to T-39, the largest gain was Saturday’s +0.9pt and the smallest was Sunday’s +0.4pt, with a 7-day average of +0.6pt. In other words, almost nothing moves in this window (45 to 39 days before the stay date). The weekday ranking at T-45 is already identical to the current one, and not a single weekday changed position over those six days.
A three-point frame — T-45, T-30 and just before arrival — tested on a completed month
So where do the numbers actually move? Future stay dates cannot answer that. The reliable approach is to track a month whose stays have already been completed, using the same weekday breakdown and the same lead-time axis. We therefore took stay dates in July 2026 and averaged them by weekday at three matched points: 45 days out, 30 days out, and just before arrival. Days with an extremely thin observed sample were excluded, leaving 3 to 5 days per weekday; observed properties numbered 99–123 at the T-45 snapshot, 104–124 at T-30, and 113–126 just before arrival.
| Day | T-45 | T-30 | Just before | T-45 → T-30 | T-30 → just before | Days covered |
|---|---|---|---|---|---|---|
| Sat | 74.8% | 78.1% | 94.9% | +3.3pt | +16.8pt | 4 |
| Thu | 69.2% | 71.8% | 89.6% | +2.6pt | +17.8pt | 4 |
| Wed | 68.7% | 71.3% | 89.4% | +2.6pt | +18.1pt | 4 |
| Tue | 68.8% | 70.8% | 88.5% | +2.0pt | +17.7pt | 3 |
| Fri | 70.3% | 72.7% | 86.8% | +2.4pt | +14.1pt | 5 |
| Mon | 68.5% | 70.5% | 84.2% | +2.0pt | +13.7pt | 3 |
| Sun | 69.9% | 72.0% | 83.9% | +2.1pt | +11.9pt | 4 |
| Max − min | 6.3pt | 7.6pt | 11.0pt | ― | ― | 27 |
Source: MetroEngines Research; compiled by the HotelBank Editorial Team
Source: MetroEngines Research; compiled by the HotelBank Editorial Team
Three things stand out in this table.
First, the spread between weekdays widens as the stay date approaches. The maximum gap is 6.3pt at T-45, 7.6pt at T-30, and 11.0pt just before arrival. At T-45 all seven days are packed into a fairly narrow 68.5%–74.8% range. The contours of the week are not visible from the outset; they are carved out over the final 30 days.
Second, the largest pickup in the final 30 days came on Wednesday (+18.1pt) and Thursday (+17.8pt), followed by Tuesday (+17.7pt) and Saturday (+16.8pt). The weakest gains were Sunday (+11.9pt) and Monday (+13.7pt). The ranking itself is stable — Saturday leads throughout — but the day that moves most in the closing stretch is not Saturday; it is midweek. Given that Saitama’s business hotel market is anchored in weekday corporate travel, the natural reading is that business trips booked late in the cycle land heavily on midweek dates.
Third, pickup over the 15 days from T-45 to T-30 stays within +2.0 to +3.3pt on every weekday. That is consistent with the forward snapshot seen at the outset (+0.4 to +0.9pt from T-45 to T-39). For Saitama’s business hotels, the T-45 to T-30 window is a period in which the numbers barely move — which also makes it the window in which planning can be finished before anything starts moving.
Individual stay dates — the Saturday, Wednesday and Sunday curves
Averages alone are hard to feel, so we take three days from the same week and overlay their booking curves from 45 days out to 18 days out. The dates chosen are Saturday, August 22, Wednesday, August 19, and Sunday, August 23, 2026 — three representative weekdays within a single week. Observed properties numbered 117 to 127.
Source: MetroEngines Research; compiled by the HotelBank Editorial Team
All three curves slope upward, but their starting points and gradients differ. Saturday, August 22 starts highest of the three at 73.8% at T-45 and reaches 79.1% at T-18 (a pickup of +5.3pt across the window). Wednesday, August 19 runs from 71.3% to 77.0%, a gain of +5.7pt — larger than Saturday’s. Sunday, August 23, by contrast, moves from 70.4% to 74.6%, a gain of just +4.2pt, and even at the end of the window sits 4.5pt below Saturday.
The Wednesday curve begins almost indistinguishable from Sunday at T-45, then separates from it and closes on Saturday as the stay date approaches. The pattern identified in the previous section — that midweek weekdays gain the most in the final 30 days — is already visible at the level of individual stay dates. Sunday started low, finished low, and gained the least in between.
How city hotels differ (12 properties, reference figures)
We applied exactly the same method to city hotels in Saitama. The population, however, is 12 properties with 9 to 12 observed — thin enough that a change in listing status at a single property can move the whole figure by several points. Please treat the following strictly as reference figures, reading them for shape rather than as definitive levels.
| Day | T-45 snapshot stays Aug 17 – Sep 13 |
T-39 snapshot stays Aug 17 – Sep 13 |
Just before July 2026 stays |
|---|---|---|---|
| Sat | 85.7% | 84.5% | 94.9% |
| Fri | 82.7% | 82.6% | 88.9% |
| Thu | 80.0% | 80.2% | 91.6% |
| Tue | 78.0% | 78.6% | 89.6% |
| Wed | 77.3% | 77.7% | 91.1% |
| Sun | 77.5% | 77.9% | 87.4% |
| Mon | 75.5% | 75.8% | 88.8% |
| Max − min | 10.2pt | 8.7pt | 7.5pt |
Source: MetroEngines Research; compiled by the HotelBank Editorial Team
On the forward snapshot (stays from August 17 to September 13), city hotels put the two weekend days on top — Saturday 84.5% and Friday 82.6% — with Monday last at 75.8%. Friday sits higher than at business hotels, giving the week a thicker weekend. On the just-before snapshot for the already-completed month of July 2026, however, Saturday’s 94.9% is followed by Thursday at 91.6% and Wednesday at 91.1%, while Friday ranks only fifth at 88.9%. Friday is strong on the forward snapshot; midweek is strong on the completed month’s final snapshot. With a population of only 12 properties this is no basis for a firm conclusion, but it is at least enough to say that “city hotels are a weekend business” is too simple a label. For a case where lining up city-hotel Saturdays at fixed T-45 and T-30 points reveals a single week dipping into a trough, see Hokkaido City Hotels: Only Aug 15 Trails at 78.7% OCC, 45 Days Out.
For reference, the monthly average estimated OCC for July 2026 was 88.0% for Saitama business hotels (125–128 properties covered) and 90.1% for city hotels (11–12 properties).
For revenue managers running business and city hotels in Saitama — implications and an action plan
(1) The structure rewards a “Sunday and Monday plan” more than a “weekend plan.” Sunday 70.1% and Monday 70.4% on the forward snapshot, and Sunday 83.9% and Monday 84.2% on the completed month’s final snapshot — the two days at the start of the week are consistently in the bottom group at Saitama’s business hotels. Moreover, their pickup in the final 30 days was +11.9pt and +13.7pt, clearly smaller than the other weekdays (+14.1 to +18.1pt). These are the two days that will not fill on their own if you wait. Before spending time on Saturday pricing, there is room to decide what to put against Sunday and Monday.
(2) Check whether you are filing Friday under “weekend.” Friday on the forward snapshot is 72.9%, just 0.8pt above Wednesday’s 72.1% and 4.3pt below Saturday’s 77.2%. Running Friday in the same “weekend” box as Saturday risks operating on assumptions stronger than the market supports. Whether your own Friday leans weekday, as the market does, or carries a distinct weekend strength of its own can be confirmed by lining up your property’s day-of-week booking pace at a matched lead time.
(3) Design midweek (Tue–Thu) as “the days that move most late.” In the completed month, pickup over the final 30 days was +18.1pt on Wednesday, +17.8pt on Thursday and +17.7pt on Tuesday, all above Saturday’s +16.8pt. Judging Wednesday weak on the basis of its 71.3% at T-30 alone risks designing away the 18pt that follows. There is room to build your remaining-inventory approach on the premise that a soft midweek reading at T-30 is within expectations.
(4) T-45 to T-30 is preparation time precisely because nothing moves. The forward snapshot gained only +0.4 to +0.9pt from T-45 to T-39, and the completed month gained only +2.0 to +3.3pt from T-45 to T-30. There is little reason to read thin bookings in this window as abnormal; it makes more sense to treat it as the time to finalise day-of-week policy, inventory release and review timing while the numbers are still still. The question of whether categories that sit higher at T-45 have less room to grow late is examined by segment in Tochigi Booking Curves by Type: Resort 81.1% at T-45, Only +2.6pt Left.
(5) Always compare weekdays at a matched lead time. As this article shows — a day-of-week spread moving from 6.3pt at T-45 to 7.6pt at T-30 to 11.0pt just before arrival — a different observation point changes how the weekday gap appears in the first place. When sharing your own day-of-week pace internally, it is worth making it standard practice to state how many days out the number was taken.
Mapped onto a timeline, the above looks like this.
| Horizon | Action | Decision trigger (checked against this article’s figures) | Objective |
|---|---|---|---|
| T-45 (up to 45 days out) | Finalise day-of-week policy first and treat the window as one you do not touch in principle | On the premise that the market gains only +0.4 to +0.9pt from T-45 to T-39, read your own gain over the same window as “on plan” if it is of a similar size | Avoid rushed intervention during a period that does not move |
| T-45 | Begin planning offers aimed at Sunday and Monday (consecutive-night stays, Monday check-out, tie-ins with local events, etc.) | When your Sunday and Monday sit in the bottom group of the week, as the market’s forward snapshot does (Sunday 70.1%, Monday 70.4%) | Lift the two days that grow least late, and lift them early |
| T-30 (around 30 days out) | Take stock of day-of-week progress at a matched lead time, and vary review frequency by weekday from there | The market’s day-of-week spread at T-30 is 7.6pt. Any weekday where your own spread is wider becomes a priority to monitor | Decide which weekdays deserve effort over the remaining 30 days |
| T-30 | Check whether midweek (Tue–Thu) inventory has been tightened too early | In the market, T-30 to just before arrival added +18.1pt on Wednesday, +17.8pt on Thursday and +17.7pt on Tuesday. Even if your midweek is in line with the market at T-30 (around 71%), assume there is room to grow from there | Keep capacity available for late demand |
| Final stretch (30 days out to arrival) | Track Saturday and midweek at the same review frequency; switch to a different approach for Sunday and Monday | The market’s just-before snapshot shows Saturday 94.9% against Sunday 83.9% and Monday 84.2%. If a comparable gap remains at your property, do not leave Sunday and Monday waiting on late pickup | Handle the days that grow and the days that do not in different ways |
| Looking to next month | For each completed month, record your own day-of-week results at the three points — T-45, T-30 and just before arrival — and make it a shared internal format | The market’s day-of-week spread runs 6.3pt at T-45 → 7.6pt at T-30 → 11.0pt just before arrival. Any weekday where your three points differ markedly from this shape is a candidate for focus next month | Turn day-of-week judgement into a repeatable monthly procedure |
Source: MetroEngines Research; compiled by the HotelBank Editorial Team
How much does lifting Sunday and Monday move the weekly average? An identity-based conversion
Every figure up to this point is an observed estimated OCC. This section adds no new measurement or forecast; it is simply a rearrangement of the definition that the 7-day average is the simple mean of the seven weekday values. In other words, moving any one weekday by X pt moves the 7-day average by X ÷ 7 pt. It is placed here so that the weight of the “Sunday and Monday plan” raised in implication (1) can be checked against the level of the week as a whole, on the same terms.
The baseline is the T-39 snapshot’s 7-day average of 72.2% (Sat 77.2% / Fri 72.9% / Wed 72.1% / Tue 71.5% / Thu 71.4% / Mon 70.4% / Sun 70.1%). The upper bound on the lift is set at the Saturday–Sunday gap of 7.1pt and the Saturday–Monday gap of 6.8pt confirmed in the body of the article. Both sit inside the range observed here; no extrapolation beyond that range has been made.
| Scenario | Sunday | Monday | 7-day average | vs. current |
|---|---|---|---|---|
| Current (unchanged) | 70.1% (±0.0pt) | 70.4% (±0.0pt) | 72.2% | — |
| Up to the floor of the weekday plateau (Thursday 71.4%) | 71.4% (+1.3pt) | 71.4% (+1.0pt) | 72.6% | +0.4pt |
| Up to Saturday’s level (77.2%) | 77.2% (+7.1pt) | 77.2% (+6.8pt) | 74.2% | +2.0pt |
Source: MetroEngines Research; compiled by the HotelBank Editorial Team
Even lifting Sunday and Monday to Thursday’s 71.4% — the floor of the weekday plateau — moves the 7-day average by only +0.4pt. Filling the back-to-back trough entirely, to Saturday’s level, yields +2.0pt. Because an improvement on two days is divided by seven, the impact of a Sunday–Monday plan looks smaller than it is when viewed through the single lens of a weekly average.
That is not an argument for neglecting these two days. Quite the opposite: managing to the weekly average alone buries the weakness of Sunday and Monday in the mean, where it never becomes visible. As this article has shown, pickup on these two days over the final 30 days was +11.9pt and +13.7pt, below every other weekday (+14.1 to +18.1pt), and leaving them alone will not fill them at the end. This conversion is precisely why they should be tracked at the absolute level of each weekday rather than through the weekly average.
| Sun \ Mon | ±0.0pt | +1.7pt | +3.4pt | +5.1pt | +6.8pt |
|---|---|---|---|---|---|
| ±0.0pt | 72.2% | 72.5% | 72.7% | 73.0% | 73.2% |
| +1.8pt | 72.5% | 72.7% | 73.0% | 73.2% | 73.5% |
| +3.5pt | 72.7% | 73.0% | 73.2% | 73.5% | 73.7% |
| +5.3pt | 73.0% | 73.2% | 73.5% | 73.7% | 74.0% |
| +7.1pt | 73.2% | 73.5% | 73.7% | 74.0% | 74.2% |
Source: MetroEngines Research; compiled by the HotelBank Editorial Team
Each cell in the grid is the 7-day average when Sunday and Monday are lifted by the amounts on the vertical and horizontal axes. The top-left cell (±0.0pt / ±0.0pt) is the current 72.2%; the bottom-right is 74.2%, the back-to-back trough filled to Saturday’s level. Moving either day alone is worth roughly 0.14pt per point (that is, 1 ÷ 7).
Summary — three yardsticks for reading Saitama’s week
Yardstick 1: the shape is a Saturday spike, a weekday plateau and a back-to-back Sunday–Monday trough. On the forward snapshot (stays from August 17 to September 13, taken 39 days before the stay date), Saturday is 77.2%, Tuesday through Friday occupy a 1.5pt band at 71.4–72.9%, and Sunday 70.1% and Monday 70.4% form the trough. Friday sits closer to Wednesday than to Saturday. The premise of treating the two weekend days as a block does not fit Saitama’s business hotels.
Yardstick 2: the day-of-week gap is decided in the final 30 days. In the completed month’s three-point frame (July 2026), the spread widened from 6.3pt at T-45 to 7.6pt at T-30 to 11.0pt just before arrival. Concluding from the T-45 ordering that “the day-of-week spread is small this year” is premature; the contours emerge late.
Yardstick 3: the biggest mover is midweek, not Saturday. Pickup from T-30 to just before arrival was +18.1pt on Wednesday, +17.8pt on Thursday and +17.7pt on Tuesday, all above Saturday’s +16.8pt. Conversely, Sunday’s +11.9pt and Monday’s +13.7pt were the weakest. Separating “the days that recover late” from “the days that do not recover even late” is the starting point for managing the week at Saitama’s business hotels.
Every one of these figures is comparable only because it was aligned to the same lead time. Matching the observation point before opening any discussion of weekdays — that single step is what turns day-of-week occupancy into information you can actually use.
About the data
| Item | Detail |
|---|---|
| Definition of estimated OCC | Occupancy based on OTA-listed inventory = 100 − 100 × rooms still listed on OTAs ÷ total rooms. It is an estimate based on how listed inventory sells down on OTAs, and differs by definition from actual room occupancy (it reads higher). |
| Booking curve | Based on observations from 45 days before the stay date up to the most recent reading. |
| Scope and observation windows | Forward snapshot = the 28 stay dates from August 17 to September 13, 2026 (four of each weekday), fixed at 45 days and 39 days before the stay date. The final observation date is August 5, 2026. Completed-month three-point frame = of the stay dates from July 1 to 31, 2026, the 27 days for which a sufficient property count was observed at each of the T-45, T-30 and just-before snapshots (3 to 5 days per weekday). |
| Property count (N) | Saitama business hotels: population 128 properties; 108–126 observed on the forward snapshot; for the completed month, 99–123 at T-45, 104–124 at T-30 and 113–126 just before arrival. Saitama city hotels: population 12 properties; 9–12 observed on the forward snapshot and 9–11 for the completed month. The July 2026 monthly averages cover 125–128 business hotels and 11–12 city hotels. |
| On price metrics | This article covers occupancy only and presents no price metrics. Estimated settled ADR is a settled price level (approximately tax-exclusive) inferred from sales data such as OTAs (lowest-plan levels × category coefficients, ensembled across multiple channels); past months are final and current and future months are estimates based on current sales conditions. Against published operating results, the median error is 6.6%. Because it is canonical at monthly granularity, it is not used at day-of-week granularity. |
| Data as of | Data as of: August 6, 2026. Because sales conditions and inventory change daily, the figures in this article are a snapshot as of the time of retrieval. Figures relating to future stay dates reflect current sales conditions and may change. |
Source: MetroEngines Research; compiled by the HotelBank Editorial Team
References and sources
■ Data source
Publicly listed inventory data from accommodation booking sites, collected and aggregated by MetroEngines Research & Consulting. For business hotels in Saitama (population 128 properties) and city hotels (population 12 properties), estimated OCC was calculated from listed remaining rooms and total rooms for each stay date. The forward snapshot fixes the 28 stay dates from August 17 to September 13, 2026 at 45 and 39 days before the stay date; the completed month aligns stay dates from July 1 to 31, 2026 at three snapshots — T-45, T-30 and just before arrival. Data as of August 6, 2026.
■ Basis of the illustrative calculation
All figures in this article are observed estimated OCC values. The three scenarios and the conversion grid shown in the section on lifting Sunday and Monday are a rearrangement of the definition that the 7-day average is the simple mean of the seven weekday values, and are not a forecast of future occupancy. The upper bound on the lift is set at the observed Saturday–Sunday gap of 7.1pt and Saturday–Monday gap of 6.8pt; no extrapolation beyond the observed range has been made. Price metrics (estimated settled ADR) are canonical at monthly granularity and are therefore not used at all at day-of-week granularity.
■ Limitations and caveats
Estimated OCC is an estimate based on how listed inventory sells down on accommodation booking sites, and differs by definition from actual room occupancy (it reads higher). The number of observed properties varies by snapshot (108–126 on the forward snapshot, 99–126 for the completed month); the full population is not observed at all times. City hotels are thin, with a population of 12 properties and 9–12 observed, so that a change in listing status at a single property can move the whole figure by several points — treat them as reference figures. In the completed month’s three-point frame, days with an extremely thin observed sample were excluded, leaving 3 to 5 days per weekday (27 days in total). Figures relating to future stay dates are a snapshot as of the time of retrieval and may change.