

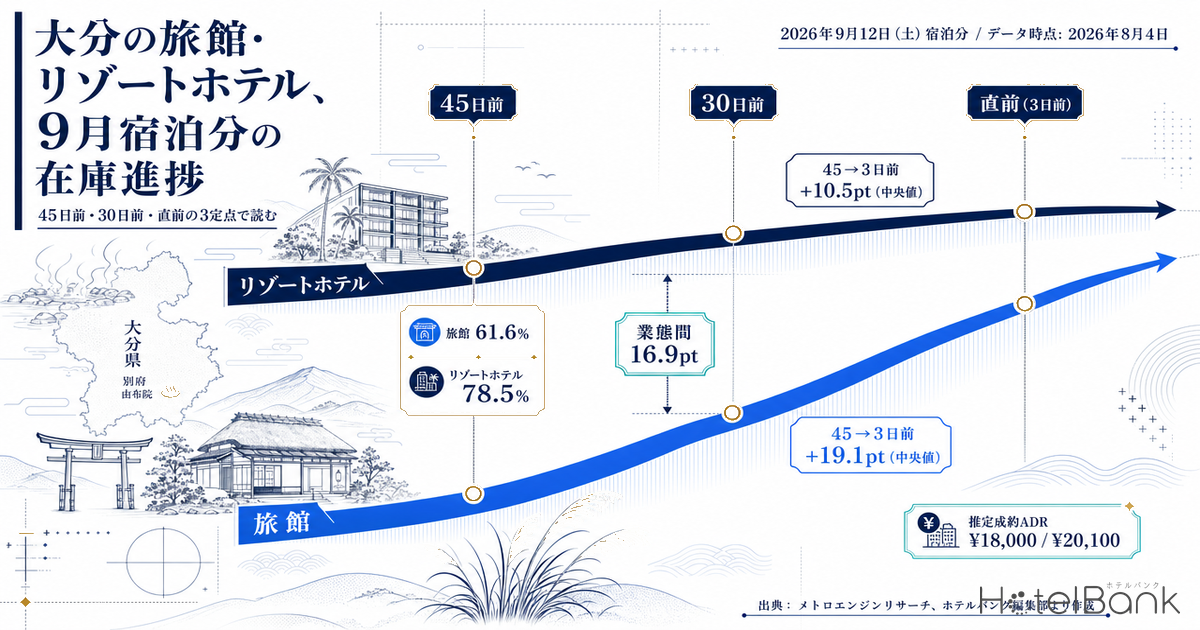
For stays on Saturday, September 12, 2026 in Oita Prefecture, estimated OCC (based on OTA-listed inventory) stood at 61.6% for ryokan and 78.5% for resort hotels as of 45 days before the stay date. Within the same prefecture and for the same stay date, the two categories sit 16.9pt apart. Reading that gap as the difference in final occupancy, however, leads to the wrong call. Looking at the four Saturdays in July 2026 — stay dates that have already passed — ryokan added a median +19.1pt of estimated OCC between 45 days out and 3 days out, while resort hotels added only +10.5pt. Ryokan start lower at 45 days out but build more thereafter, and that asymmetry is the starting point for how to approach September in Oita.
This article organizes three things by category: (1) the “yardstick for the build” measured on the four July Saturdays that have already passed, (2) the 45-days-out snapshot and the latest observation for stays between September 1 and 16, and (3) the day-of-week shape and the trajectory of estimated transacted ADR.
Coverage: ryokan in Oita Prefecture (N=286–288 properties / 4,472–4,540 rooms per September date) and resort hotels (N=35–36 properties / 2,500–2,510 rooms). Price figures in this article are estimated transacted ADR (the transaction price level estimated from OTA and other sales data, excluding tax); occupancy is an estimate based on OTA-listed inventory. Full definitions appear at the end of the article. Data as of August 4, 2026.
- — At 45 days out for stays on Saturday, September 12, 2026, ryokan were at OCC 61.6% (September 2026, 45 days out) and resort hotels at OCC 78.5% (September 2026, 45 days out) — a 16.9pt gap within the same prefecture and the same stay date.
- — Across the four Saturdays in July 2026 that have already passed, the build from 45 days out to 3 days out was +19.1pt (median) for ryokan and +10.5pt for resort hotels. The category that starts lower at 45 days out has the thicker runway later.
- — For ryokan, 30 days out is the watershed: +6.4pt from 45 to 30 days out versus +12.7pt from 30 to 3 days out — weighted toward the back half. Resort hotels run +5.1pt / +5.6pt, roughly even, so the outcome tends to be settled by the groundwork laid before 45 days out.
- — From 45 days out to the latest observation, September 1–16 has moved −0.2 to +1.8pt for ryokan and −1.0 to +3.4pt for resort hotels. The market as a whole is still in its run-up, so a lag in pace is better read as “the gap has not opened yet.”
- — The weekly shape has only one peak, Saturday. In July 2026, Monday through Thursday sat flat at 75.2–77.9% for ryokan and 72.7–75.3% for resort hotels. Weekdays fit a design that bridges across nights via length-of-stay and meal-plan conditions rather than one that picks a specific weekday.
How to read the 45-days-out number — a yardstick measured on four July Saturdays
Is “60% at 45 days out” high or low? The only way to answer is to measure how much was added from 45 days out on stay dates in the same market that have already passed. The table below lines up three fixed points — 45 days out, 30 days out and 3 days out — by category for the four Saturdays in July 2026 (July 4, 11, 18 and 25) in Oita Prefecture.
| Stay date (2026) | Category | 45 days out | 30 days out | 3 days out | 45→30 days | 30→3 days | 45→3 days |
|---|---|---|---|---|---|---|---|
| Sat, Jul 4 | Ryokan | 52.2% | 59.2% | 71.3% | +7.0pt | +12.1pt | +19.1pt |
| Sat, Jul 11 | Ryokan | 55.2% | 61.0% | 74.3% | +5.8pt | +13.3pt | +19.1pt |
| Sat, Jul 18 | Ryokan | 66.2% | 74.1% | 90.0% | +7.9pt | +15.9pt | +23.8pt |
| Sat, Jul 25 | Ryokan | 62.2% | 67.0% | 79.1% | +4.8pt | +12.1pt | +16.9pt |
| Sat, Jul 4 | Resort | 67.6% | 74.3% | 78.6% | +6.7pt | +4.3pt | +11.0pt |
| Sat, Jul 11 | Resort | 71.0% | 75.1% | 80.9% | +4.1pt | +5.8pt | +9.9pt |
| Sat, Jul 18 | Resort | 81.2% | 87.3% | 93.4% | +6.1pt | +6.1pt | +12.2pt |
| Sat, Jul 25 | Resort | 77.3% | 80.7% | 86.0% | +3.4pt | +5.3pt | +8.7pt |
Estimated OCC (based on OTA-listed inventory). Observed properties: 243–272 ryokan, 33–35 resort hotels. Source: MetroEngines Research; compiled by the HotelBank Editorial Team
On a median basis, ryokan added +6.4pt from 45 to 30 days out, +12.7pt from 30 to 3 days out, for a total of +19.1pt. Resort hotels added +5.1pt and +5.6pt respectively, totaling +10.5pt. For ryokan the center of gravity of the build sits well inside 30 days out; for resort hotels the two legs are almost equally thick, leaving little runway in the back half.
Overlaying the average curves across the four dates makes the asymmetry clearer. The chart below averages the four July Saturdays by category: the resort hotel curve flattens out almost entirely once it passes 30 days out, while the ryokan curve keeps its slope and continues climbing to the end.
Source: MetroEngines Research; compiled by the HotelBank Editorial Team
The practical implication is clear. For a resort hotel, the level at 45 days out is close to a preview of where it will land; for a ryokan, the level at 45 days out is only a waypoint at which roughly two-thirds of the picture is still unwritten. The same “60% at 45 days out” calls for different timing depending on the category. This relationship — the higher a category sits at 45 days out, the smaller its last-minute runway — is not unique to Oita: the same structure shows up across four categories in Tochigi Booking Curves by Type: Resort 81.1% at T-45, Only +2.6pt Left.
Where September stands — the 45-days-out snapshot and the latest observation
So what does September 2026 look like? The chart below lines up estimated OCC at 45 days out by category for stays between September 1 and 16, which fall inside the observation window.
Source: MetroEngines Research; compiled by the HotelBank Editorial Team
The peak for resort hotels is Saturday, September 12 at 78.5%. For ryokan the highest date is Tuesday, September 15 at 62.9%, with Saturday, September 12 close behind at 61.6%, followed by Wednesday, September 16 at 60.2% and Wednesday, September 9 at 60.0%. For resort hotels the next-highest dates are Saturday, September 5 at 75.1%, Monday, September 14 at 69.8% and Friday, September 11 at 69.6%. At the low end sit Sunday, September 6 at 53.8% and Monday, September 7 at 54.0% for ryokan, and Wednesday, September 2 at 63.0% and Wednesday, September 16 at 64.2% for resort hotels.
The table below places the 45-days-out figure alongside the latest observation for the main dates. Each September date is still observed somewhere in the 45-to-28-days-out band, so the build has yet to begin in earnest.
| Stay date (2026) | Ryokan, 45 days out | Ryokan, latest | Resort, 45 days out | Resort, latest | Gap between categories (45 days out) |
|---|---|---|---|---|---|
| Fri, Sep 4 | 56.1% | 57.8% (33 days out) | 68.8% | 69.7% (33 days out) | 12.7pt |
| Sat, Sep 5 | 58.5% | 60.3% (34 days out) | 75.1% | 75.9% (34 days out) | 16.6pt |
| Sun, Sep 6 | 53.8% | 55.6% (35 days out) | 68.2% | 67.2% (35 days out) | 14.4pt |
| Fri, Sep 11 | 59.2% | 59.4% (40 days out) | 69.6% | 70.6% (40 days out) | 10.4pt |
| Sat, Sep 12 | 61.6% | 62.1% (41 days out) | 78.5% | 78.8% (41 days out) | 16.9pt |
| Sun, Sep 13 | 55.4% | 55.5% (42 days out) | 67.4% | 68.1% (42 days out) | 12.0pt |
Estimated OCC (based on OTA-listed inventory). Observed properties: 210–279 ryokan, 28–34 resort hotels. Source: MetroEngines Research; compiled by the HotelBank Editorial Team
Across September 1–16, the change from 45 days out to the latest observation runs −0.2 to +1.8pt for ryokan and −1.0 to +3.4pt for resort hotels. In other words, September stays are still in a state where the 45-days-out level has been held largely intact. Measured against the yardstick from the previous section, ryokan have consumed only the first few points of a median +19.1pt build. Note too that within the same September stays, “how high the level is” and “how fast the build is running” are different things, and the picture changes once observation windows are aligned — a point shown concretely in Okinawa Late-Summer Booking Curve 2026: Sep 5 Beats Obon, City +4.7pt.
So where does September land if this yardstick is applied? The table below takes the minimum, median and maximum build from 45 days out to 3 days out observed on the four July 2026 Saturdays that have already passed, and adds each of them to the 45-days-out snapshot for the two September Saturdays. Because demand seasonality differs between July and September, this is not a forecast — read it as a reference range for “if the pattern repeats the way July moved.”
| Stay date (2026) | Category | 45 days out (actual) |
Low (July minimum) |
Mid (July median) |
High (July maximum) |
|---|---|---|---|---|---|
| Sat, Sep 5 | Ryokan | 58.5% | 75.4% (+16.9pt) | 77.6% (+19.1pt) | 82.3% (+23.8pt) |
| Sat, Sep 5 | Resort | 75.1% | 83.8% (+8.7pt) | 85.6% (+10.5pt) | 87.3% (+12.2pt) |
| Sat, Sep 12 | Ryokan | 61.6% | 78.5% (+16.9pt) | 80.7% (+19.1pt) | 85.4% (+23.8pt) |
| Sat, Sep 12 | Resort | 78.5% | 87.2% (+8.7pt) | 89.0% (+10.5pt) | 90.7% (+12.2pt) |
The 45-days-out figures are observed values of estimated OCC (based on OTA-listed inventory). The build is the minimum / median / maximum of the actual 45-to-3-days-out gains on July 4, 11, 18 and 25, 2026. Source: MetroEngines Research; compiled by the HotelBank Editorial Team
That puts ryokan at 78.5–85.4% (mid 80.7%) for Saturday, September 12 and resort hotels at 87.2–90.7% (mid 89.0%). The width of the range is 6.9pt for ryokan and 3.5pt for resort hotels. Here again the numbers show the same structure: for ryokan the outcome still moves with what is done in the remaining time, while for resort hotels it is largely settled. Put the other way, if a resort hotel’s own pace for September 12 sits well below 78.5%, that should be read as a warning that only about 3.5pt can be recovered in the final stretch.
Your own property’s level at 45 days out will not necessarily match this table. The table below therefore lets you read a landing zone off two axes: the 45-days-out level and the size of the build. Pick the row on the left closest to your own 45-days-out level and read across to the column matching your category to get a landing estimate under a July-like pattern.
| Your level at 45 days out | Resort band +8.7pt | Resort band +10.5pt | Resort band +12.2pt | Ryokan band +16.9pt | Ryokan band +19.1pt | Ryokan band +23.8pt |
|---|---|---|---|---|---|---|
| 50% | 58.7% | 60.5% | 62.2% | 66.9% | 69.1% | 73.8% |
| 55% | 63.7% | 65.5% | 67.2% | 71.9% | 74.1% | 78.8% |
| 60% | 68.7% | 70.5% | 72.2% | 76.9% | 79.1% | 83.8% |
| 65% | 73.7% | 75.5% | 77.2% | 81.9% | 84.1% | 88.8% |
| 70% | 78.7% | 80.5% | 82.2% | 86.9% | 89.1% | 93.8% |
| 75% | 83.7% | 85.5% | 87.2% | 91.9% | 94.1% | 98.8% |
| 80% | 88.7% | 90.5% | 92.2% | 96.9% | 99.1% | 100.0% (capped) |
Landing estimate = level at 45 days out + size of build. The build values are the actual 45-to-3-days-out gains on the four Saturdays in July 2026 (resort hotels: minimum +8.7pt / median +10.5pt / maximum +12.2pt; ryokan: minimum +16.9pt / median +19.1pt / maximum +23.8pt). Shaded cells are 90% or above. Source: MetroEngines Research; compiled by the HotelBank Editorial Team
The way to use this table is simple: it is not for asking “where am I now” but “how far can I get from where I am now.” For a ryokan at 55% at 45 days out, for example, the landing zone falls in the 71.9–78.8% band, and the 90s are out of reach under a July-like pattern. Reaching the 90s would require being at around 70% by the 45-days-out mark — and that reverse calculation becomes the target level for the groundwork from next month onward.
There is one more distinctive pattern on September weekdays. Among ryokan, the estimated share of properties with no confirmable listed inventory runs high on Tuesdays and Wednesdays: 31.6% for Tuesday, September 1, 32.3% for Tuesday, September 8, 32.1% for Wednesday, September 9, 28.5% for Tuesday, September 15 and 32.2% for Wednesday, September 16, all at 45 days out. Fridays and Saturdays, by contrast, run at less than half that level: 15.0% for Friday, September 4, 12.2% for Saturday, September 5, 11.1% for Friday, September 11 and 13.6% for Saturday, September 12. When weekday estimated OCC is not much different from the weekend on certain dates, the natural reading is not that demand is thick but that sellable inventory itself has been throttled back. Occupancy in a thin-denominator situation needs to be read together with how much inventory is actually being put on the market, not by its level alone.
Day-of-week shape and estimated transacted ADR — the base for a pricing calendar
Averaging estimated OCC by day of week across daily actuals for June and July 2026 — stay dates that have already passed — reveals the weekly shape in Oita Prefecture (only dates with observation coverage of 80% or more are included).
| Month and category | Mon | Tue | Wed | Thu | Fri | Sat | Sun |
|---|---|---|---|---|---|---|---|
| June 2026, ryokan | 83.4% | 85.1% | 82.8% | 83.2% | 87.4% | 92.4% | 85.6% |
| July 2026, ryokan | 76.5% | 76.4% | 75.2% | 77.9% | 81.9% | 91.1% | 84.3% |
| June 2026, resort | 82.3% | 84.0% | 78.9% | 81.2% | 84.6% | 90.2% | 82.2% |
| July 2026, resort | 75.3% | 74.3% | 72.7% | 74.5% | 76.8% | 87.2% | 80.7% |
Estimated OCC (based on OTA-listed inventory), daily actuals for months whose stay dates have passed. Observed properties: 215–286 ryokan, 30–36 resort hotels. Source: MetroEngines Research; compiled by the HotelBank Editorial Team
The within-week range in July 2026 runs from 75.2% on Wednesday to 91.1% on Saturday for ryokan — 15.9pt — and from 72.7% on Wednesday to 87.2% on Saturday for resort hotels — 14.5pt. In both categories Saturday stands out, with Sunday (84.3% ryokan, 80.7% resort) and Friday (81.9% ryokan, 76.8% resort) forming a second tier and Monday through Thursday forming a flat trough. What matters is that the trough is not “somewhere among Monday to Thursday” — all four days sink to the same level. That means filling weekdays fits the structure better when it is built around length-of-stay conditions rather than around picking a particular weekday.
On the price side, the monthly trajectory of estimated transacted ADR (year over year) is shown below.
Source: MetroEngines Research; compiled by the HotelBank Editorial Team
Comparing confirmed figures year over year, June 2026 came in at ¥15,300 for ryokan (N=321 properties, down 5.8% from ¥16,200 with N=317 a year earlier) and ¥16,800 for resort hotels (N=40 properties, up 1.5% from ¥16,500 with N=38). July 2026 came in at ¥16,000 for ryokan (N=319 properties, down 6.4% from ¥17,100 with N=311) and ¥17,000 for resort hotels (N=40 properties, down 2.3% from ¥17,400 with N=38). Ryokan have now run below the prior year for two consecutive months, while resort hotels have held roughly level with last year.
For September 2026, the estimate based on current sales conditions is ¥18,000 for ryokan (N=309 properties) and ¥20,100 for resort hotels (N=39 properties). Against August, also an estimate (¥18,100 for ryokan with N=315 properties, ¥19,500 for resort hotels with N=39 properties), September is roughly flat for ryokan and higher for resort hotels — but this is a snapshot reflecting the mix of inventory currently on sale and may shift before month-end. A straight comparison with the confirmed figures for the same month last year is best left until those numbers are final. Within the prefecture, how autumn pricing builds at the onsen-destination level — including Yufuin — is a separate question that turns on year-over-year movement in each destination.
For revenue managers running ryokan and resort hotels in Oita — implications and an action plan
(1) The 45-days-out level is a preview for one category and a waypoint for the other. Across the four July Saturdays that have already passed, the build from 45 days out to 3 days out was a median +19.1pt for ryokan and +10.5pt for resort hotels. When benchmarking your own curve against the market, a resort hotel’s position at 45 days out is close to its landing estimate, while for a ryokan the 45-days-out mark is better understood as a point where roughly two-thirds of the journey still remains. The same “60% at 45 days out” calls for a different next move depending on the category.
(2) 30 days out is the watershed for ryokan. The ryokan build runs a median +6.4pt from 45 to 30 days out and +12.7pt from 30 to 3 days out — thicker in the back half. Resort hotels, by contrast, run +5.1pt / +5.6pt, almost even, and the curve flattens once past 30 days out. A ryokan has room to switch tactics based on remaining availability at the 30-days-out mark; a resort hotel tends to have the outcome decided by the groundwork laid before 45 days out. That difference in time horizon is worth building into the internal review cycle.
(3) September stays have not started moving yet. From 45 days out to the latest observation, September 1–16 has moved −0.2 to +1.8pt for ryokan and −1.0 to +3.4pt for resort hotels. Because the market as a whole is still in its run-up, a property whose pace looks behind the market at this point is better read as “the gap has not opened yet” than as having fallen behind. Practically, the useful check is where each of your own dates sits between the category highs — 61.6% for ryokan and 78.5% for resort hotels on Saturday, September 12 (the peak date for resort hotels; the ryokan high is 62.9% on Tuesday, September 15) — and the troughs of 53.8% on Sunday, September 6 and 63.0% on Wednesday, September 2.
(4) The weekday trough is shaped to be filled by stay conditions, not by weekday selection. In the July 2026 day-of-week actuals, Monday through Thursday sank together at 75.2–77.9% for ryokan and 72.7–75.3% for resort hotels, with only Saturday standing out. Because it is not one weak weekday but the whole weekday block sitting at the same depth, a design that bridges nights — a second night added on from Friday or Saturday, or two consecutive weekday nights — fits the shape better than targeting a single weekday. Note as well that among ryokan the share of properties with no confirmable listed inventory runs around 30% on Tuesdays and Wednesdays, so simply putting weekday inventory on sale can itself be a relative differentiator in this window.
Translated into three tiers of action matched to the time remaining before September stays, this becomes the following.
| Time horizon | Action | Decision trigger (tied to figures in this article) | Objective |
|---|---|---|---|
| Today to this week (around T-45) | For each date from September 1 to 16, take stock of your own booking pace alongside the market’s 45-days-out snapshot | Whether your own Saturday, September 12 sits well below the 61.6% (ryokan) / 78.5% (resort hotel) level, or is stuck near the trough levels of 53.8% on Sunday, September 6 and 63.0% on Wednesday, September 2 | Identify the weak dates and narrow down which dates the later actions target |
| Today to this week (around T-45) | Check whether weekday inventory is set to go out to the market, and consider releasing it on any dates where it is not | Among ryokan, the share of properties with no confirmable listed inventory runs 28.5–32.3% on Tuesdays and Wednesdays, versus 11.1–15.0% on Fridays and Saturdays | Capture a window in which weekday visibility itself is relatively scarce |
| Within two weeks (before reaching T-30) | Rework weekday length-of-stay conditions (consecutive-night discounts, second-night design) ahead of single-night propositions | In the July 2026 day-of-week data, Monday through Thursday sit flat at 75.2–77.9% (ryokan) and 72.7–75.3% (resort hotels), with only Saturday at 91.1% (ryokan) and 87.2% (resort hotels) | Bridge weekday demand that is hard to capture on a single night by extending stays from the weekend |
| Within two weeks (before reaching T-30) | Check how far your own September pricing sits from the market level | Estimated transacted ADR for September 2026 (current estimate) is ¥18,000 for ryokan with N=309 properties and ¥20,100 for resort hotels with N=39 properties. Is your own pricing persistently outside that range? | Separate whether price is the reason pace is lagging or whether the issue is on the demand side |
| Toward next month (T-30 to last-minute) | For ryokan, assume the build phase begins after 30 days out and keep room to rework meal conditions (breakfast-only / with dinner) | The ryokan build from 30 to 3 days out is a median +12.7pt, thicker than the +6.4pt from 45 to 30 days out | Keep non-price variables in reserve for the window where the build works hardest |
| Toward next month (T-30 to last-minute) | For resort hotels, avoid placing excessive expectations on a last-minute build and shift the center of review toward groundwork for October onward | The resort hotel build from 30 to 3 days out is a median +5.6pt, roughly the same as the +5.1pt from 45 to 30 days out | Avoid leaving business on the table through late decisions in a category with a thin back-half runway |
Source: MetroEngines Research; compiled by the HotelBank Editorial Team
Conclusion — three yardsticks for measuring September in Oita
Yardstick 1: a category-specific “build budget.” Ryokan in Oita Prefecture add a median +19.1pt from 45 days out to 3 days out; resort hotels add +10.5pt. Carrying that width in mind when looking at a 45-days-out snapshot — how many points this market can still add — keeps a lag in pace from being either over- or under-weighted.
Yardstick 2: 30 days out as the watershed. Ryokan run +6.4pt from 45 to 30 days out and +12.7pt from 30 to 3 days out, weighted toward the back half; resort hotels run +5.1pt and +5.6pt, evenly split. Shifting the timing of reviews and actions to match the category changes how efficiently the same effort is allocated.
Yardstick 3: the weekly shape peaks only on Saturday. In the July 2026 day-of-week actuals, Monday through Thursday sit flat at 75.2–77.9% for ryokan and 72.7–75.3% for resort hotels, with only Saturday at 91.1% and 87.2% respectively. Weekdays are shaped for a design that bridges across nights and meal conditions rather than one that picks a weekday.
Stays in September 2026 are about to start moving in earnest from a position of 61.6% for ryokan and 78.5% for resort hotels at 45 days out for Saturday, September 12. With the market as a whole still in its run-up, this is a good moment to compare the shape of your own curve against the shape of the market and decide where in the timeline to place your moves.
About the data
• Definition of estimated OCC: occupancy based on OTA-listed inventory = 100 − 100 × rooms still listed on OTAs ÷ total rooms. It is an estimate based on how far the inventory sold through OTAs has been consumed, and its definition differs from actual room occupancy (it reads higher).
• Booking curve: based on observations from 45 days before the stay date through the most recent reading.
• Definition of estimated transacted ADR: the transaction price level (excluding tax) estimated from OTA and other sales data (lowest-plan level × category coefficient, ensembled across multiple channels). Past months are confirmed values; the current and future months are estimates based on current sales conditions. Median error against published operating results is 6.6%.
• Coverage and observed property counts: ryokan and resort hotels in Oita Prefecture. The booking-curve population is 286–288 ryokan / 4,472–4,540 rooms and 35–36 resort hotels / 2,500–2,510 rooms for each September 2026 date. Observed property counts for the 45-days-out snapshot and the latest observation of September stays are 210–279 ryokan and 28–34 resort hotels. For the three fixed points (45, 30 and 3 days out) on the four Saturdays in July 2026, they are 243–272 ryokan and 33–35 resort hotels. The day-of-week actuals (June and July 2026) include only dates with observation coverage of 80% or more, with 215–286 ryokan and 30–36 resort hotels observed. Property counts for estimated transacted ADR are N=309–321 ryokan and N=38–40 resort hotels (varying by month). Category classification follows the MetroEngines Research property-type taxonomy for ryokan and resort hotels.
• Aggregation scope: the booking curve covers stays from September 1 to 16, 2026 and stays on July 4, 11, 18 and 25, 2026. Estimated OCC by day of week uses daily actuals for June and July 2026. Estimated transacted ADR is monthly from January 2024 through September 2026.
• Data as of August 4, 2026. Sales conditions and inventory shift daily, so the figures in this article are a snapshot at the time of retrieval.
■ Data sources
Proprietary aggregation of publicly listed inventory and public prices collected daily from accommodation booking sites (MetroEngines Research). The booking curve tracks remaining rooms by observation date for each stay date; estimated transacted ADR is an estimate produced by an ensemble across multiple channels. No official statistics or third-party surveys are used.
■ Assumptions behind the estimates
The reference range (low / mid / high) and the landing estimates in the two-axis grid are produced by simple addition of the actual 45-to-3-days-out build on the already-passed stay dates of July 4, 11, 18 and 25, 2026 (minimum / median / maximum across the four samples) to the 45-days-out snapshot for September 2026. July is a summer demand period that includes Marine Day, and differs from September in demand seasonality and composition. Estimated OCC by day of week includes only dates with observation coverage of 80% or more.
■ Limitations and caveats
(1) Estimated OCC is based on OTA-listed inventory and reads higher than actual room occupancy. (2) Observed property counts vary by stay date and observation date (210–286 ryokan, 28–36 resort hotels), and levels swing more easily on thinly observed cross-sections. (3) Estimated transacted ADR for August and September 2026 is an estimate on a listing-snapshot basis and may move before month-end confirmation. (4) The reference range is based on the distribution of the market as a whole and neither forecasts nor guarantees where any individual property will land.
Further reading
- Tochigi Booking Curves by Type: Resort 81.1% at T-45, Only +2.6pt Left
- Okinawa Late-Summer Booking Curve 2026: Sep 5 Beats Obon, City +4.7pt
- Hokkaido City Hotels: Only Aug 15 Trails at 78.7% OCC, 45 Days Out
- Nagano Late-Summer Booking Curve 2026: Ryokan -11.8pt at 45 Days Out
- KOKO HOTELS Beppu: Limited-Service Meets Onsen Resort Economics