

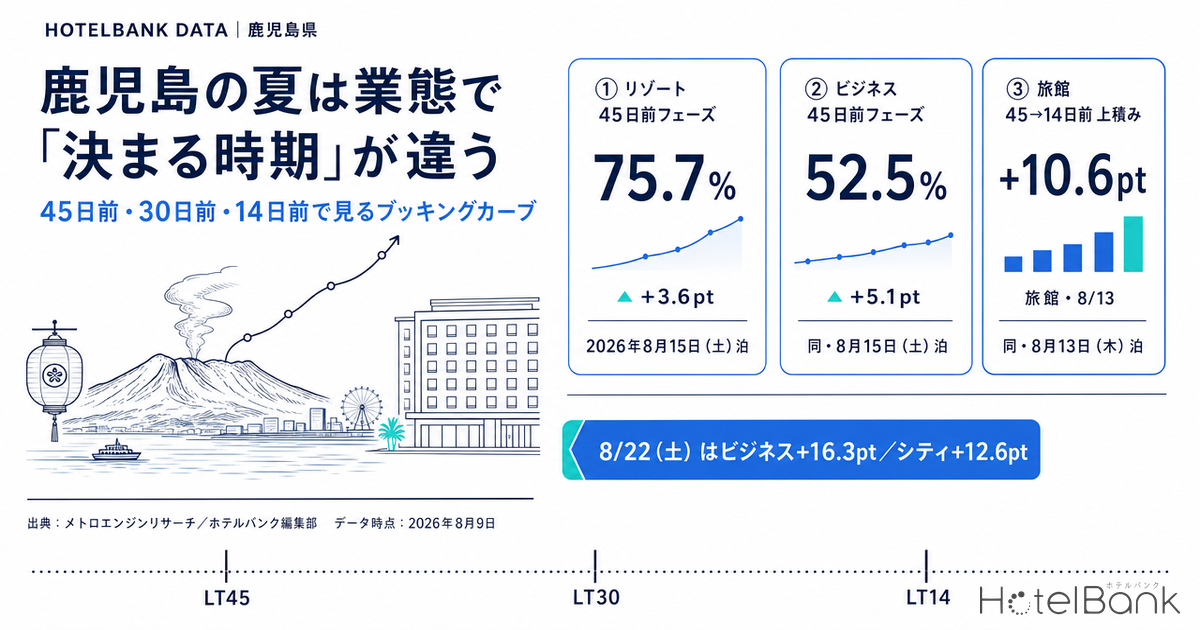
For Saturday 15 August 2026 in Kagoshima, estimated OCC (based on OTA-listed inventory) at the 45-days-out phase was 75.7% for resort hotels (38–43 properties observed), against 52.5% for business hotels (126–139 properties). For the identical stay date, how much of the shape is already locked in at 45 days out differs by 23.2 percentage points depending on property type. The pickup through the 14-days-out phase then runs +3.6pt for resort hotels, +3.4pt for city hotels, +5.1pt for business hotels and +7.6pt for ryokan — the lower the starting level, the more a type builds late. On top of that, Saturday 22 August, the first Saturday after Obon, showed business hotels at 68.8% in the 45-days-out phase, 16.3pt above 15 August, the Saturday of Obon itself. This article organises booking curves for Kagoshima’s four property types using a three-point frame — 45 days out, 30 days out and 14 days out — and considers how to allocate inventory and exposure on the premise that “when it gets decided” differs by type.
Scope: business hotels, city hotels, ryokan and resort hotels in Kagoshima. Properties observed: business 120–140 / city 21–24 / ryokan 60–76 / resort 37–43. The price metric in this article is estimated settled ADR (the transaction price level estimated from OTA and other sales data, pre-tax equivalent); occupancy is an estimate based on OTA-listed inventory. Both definitions appear at the end of the article. Data as of 9 August 2026.
- — 23.2 points——For Saturday 15 August, the 45-days-out phase was 75.7% for resort hotels against 52.5% for business hotels. For the same stay date, how far along each type is differs by type.
- — +7.6pt / +3.4pt——Pickup from 45 days out to 14 days out is largest for ryokan and smallest for city hotels. The lower the level at 45 days out, the more a type builds later.
- — The peak is Thu 13 Aug——The high point of Obon proper is not Saturday 15 August. All four types run higher on 13 August, with the gap in the 45-days-out phase reaching 9.6pt for ryokan.
- — +16.3pt——Saturday 22 August, after Obon, puts business hotels above 15 August in the 45-days-out phase. City hotels are +12.6pt, while resort hotels are +4.0pt — for them the discontinuity barely registers.
- — Ryokan +18.6%——Estimated settled ADR for July 2026 (final) rose year on year for ryokan, from ¥9,131 to ¥10,829. City hotels, by contrast, fell 9.4% (¥8,158 → ¥7,390).
45, 30 and 14 days out — a three-point frame for four property types
Tracking a booking curve day by day is risky, because the number of properties observed fluctuates from day to day and it is easy to read too much into a single day’s movement. This article therefore groups the days remaining until the stay date (lead time, hereafter LT) into three phases and treats the median of the observations within each phase as the representative value. The definitions are: “45-days-out phase = LT 45–41”, “30-days-out phase = LT 33–27”, “14-days-out phase = LT 20–14”. The number of properties observed is shown alongside each phase, and thin cross-sections are excluded from the calculation of representative values.
The table below sets out the three-point frame for all four types across three dates: Thursday 13 August, a weekday during Obon proper; Saturday 15 August, the Saturday of Obon; and Saturday 22 August, the first Saturday after Obon.
| Type | Stay date | 45 days out | 30 days out | 14 days out | 45→14 change | Properties observed |
|---|---|---|---|---|---|---|
| Business hotels | Thu 13 Aug | 57.4% | 61.1% | 64.7% | +7.3pt | 125–138 |
| Business hotels | Sat 15 Aug | 52.5% | 55.0% | 57.6% | +5.1pt | 126–139 |
| Business hotels | Sat 22 Aug | 68.8% | 73.6% | 75.3% | +6.5pt | 120–140 |
| City hotels | Thu 13 Aug | 79.2% | 82.5% | 88.0% | +8.8pt | 24 |
| City hotels | Sat 15 Aug | 74.5% | 75.5% | 77.9% | +3.4pt | 24 |
| City hotels | Sat 22 Aug | 87.1% | 89.2% | 90.5% | +3.4pt | 21–24 |
| Ryokan | Thu 13 Aug | 69.0% | 74.6% | 79.6% | +10.6pt | 64–75 |
| Ryokan | Sat 15 Aug | 59.4% | 61.7% | 67.0% | +7.6pt | 65–76 |
| Ryokan | Sat 22 Aug | 70.0% | 74.2% | 76.1% | +6.1pt | 60–76 |
| Resort hotels | Thu 13 Aug | 82.6% | 84.6% | 87.0% | +4.4pt | 38–43 |
| Resort hotels | Sat 15 Aug | 75.7% | 79.0% | 79.3% | +3.6pt | 38–43 |
| Resort hotels | Sat 22 Aug | 79.7% | 82.9% | 84.2% | +4.5pt | 37–43 |
Source: Compiled by the HotelBank Editorial Team from MetroEngines Research
Read the table vertically and the first fact about summer in Kagoshima emerges. The peak of Obon proper is not Saturday 15 August but Thursday 13 August. Estimated OCC on 13 August exceeds 15 August for all four types, with the gap in the 45-days-out phase at 4.9pt for business hotels (57.4% vs 52.5%), 4.7pt for city hotels (79.2% vs 74.5%), 9.6pt for ryokan (69.0% vs 59.4%) and 6.9pt for resort hotels (82.6% vs 75.7%). The structure in which the calendar — the flow of homecoming and grave visits — rather than the day of the week sets the demand peak appears in Kagoshima regardless of property type. Within Kyushu, Kagoshima’s pace of inventory absorption is relatively gradual; that positioning is set out as a cross-prefecture comparison in Obon T-7: Kyushu’s 31.7pt Gap.
Read it horizontally and the second fact emerges. The higher a type stands at 45 days out, the smaller its subsequent pickup. Resort hotels, sitting at 75–83% in the 45-days-out phase, move only +3.6 to +4.5pt from 45 to 14 days out across all three dates. Business hotels, at 52–69% at 45 days out, move +5.1 to +7.3pt, and ryokan, at 59–70%, move +6.1 to +10.6pt. In other words, “types that get decided early” and “types that get decided late” coexist within the same prefecture. Whether this relationship — the higher the level at 45 days out, the less room to grow close in — also holds in other prefectures is tested using the same three-point frame in Tochigi Booking Curves by Type.
Source: Compiled by the HotelBank Editorial Team from MetroEngines Research
The chart above lays out the booking curves of the four types for stays on Saturday 15 August, from 45 days remaining through to the latest observation. The resort hotel line moves on an almost parallel, gentle gradient from 75.2% at 45 days out to 82.0% at the latest observation (LT7). The business hotel line, by contrast, moves only from 52.2% to 58.1%, and the gap in level never closes. Ryokan rise most steeply of the four types, from 58.7% to 67.9%, and are still adding volume even in the most recent week of observations.
The Saturday after Obon outpaces Obon itself
What is easily overlooked in discussions of August in Kagoshima is the weekend after Obon. In the 45-days-out phase, Saturday 22 August stands at 68.8% for business hotels (120–140 properties observed), 87.1% for city hotels (21–24), 70.0% for ryokan (60–76) and 79.7% for resort hotels (37–43). That is +16.3pt, +12.6pt, +10.6pt and +4.0pt respectively above 15 August, the Saturday of Obon. The gap does not narrow at the 14-days-out phase either: business hotels are at 75.3% versus 57.6% (+17.7pt), and city hotels at 90.5% versus 77.9% (+12.6pt).
How that gap appears also differs by type, and that matters. For resort hotels the difference between 15 and 22 August is only 4.0pt, but for business hotels it is a 16.3pt discontinuity. During Obon, business demand thins out at business hotels in the prefecture, and the substitution into homecoming and leisure demand does not fully compensate. On the first Saturday after Obon, by contrast, pre-business-trip stays, weekend leisure and event demand all return at once, and city hotels have already reached 87.1% at 45 days out. The phenomenon of the post-Obon Saturday becoming the effective demand peak is not confined to Kagoshima: in Shimane Obon 2026, business hotels on Saturday 22 August build up to an estimated OCC of 90.9% (stays of 22 August 2026, aggregated across Shimane business hotels).
Source: Compiled by the HotelBank Editorial Team from MetroEngines Research
The chart above arranges the pickup (in percentage points) from the 45-days-out phase to the 14-days-out phase by type and stay date. Ryokan on 13 August (+10.6pt) is the largest, while resort hotels on 15 August (+3.6pt) and city hotels on 15 and 22 August (both +3.4pt) are the smallest. Even within the same “Obon”, ryokan retain room to add close to a tenth of their inventory after the 45-day mark, whereas for resort and city hotels the outcome is largely settled by 45 days out.
It is also worth looking further ahead. Saturday 29 August and Saturday 5 September had not yet reached the 14-days-out phase at the time of writing, so they are compared on two points: 45 days out and 30 days out.
| Stay date | Type | 45 days out | 30 days out | 45→30 change | Properties observed |
|---|---|---|---|---|---|
| Sat 29 Aug | Business hotels | 57.9% | 68.3% | +10.4pt | 130–137 |
| Sat 29 Aug | City hotels | 83.6% | 88.0% | +4.4pt | 23–24 |
| Sat 29 Aug | Ryokan | 63.5% | 66.9% | +3.4pt | 65–76 |
| Sat 29 Aug | Resort hotels | 74.4% | 76.3% | +1.9pt | 41–43 |
| Sat 5 Sep | Business hotels | 58.8% | 60.8% | +2.0pt | 130–140 |
| Sat 5 Sep | City hotels | 80.3% | 82.2% | +1.9pt | 21–24 |
| Sat 5 Sep | Ryokan | 57.2% | 56.6% | −0.6pt | 67–75 |
| Sat 5 Sep | Resort hotels | 68.8% | 69.3% | +0.5pt | 40–43 |
Source: Compiled by the HotelBank Editorial Team from MetroEngines Research
On 29 August, business hotels move +10.4pt from 45 to 30 days out — larger than the same interval for any other date or type covered in this article. The resumption of business travel after the summer holidays takes shape in a concentrated way by 30 days out for this date. For 5 September, by contrast, all four types move within +2.0pt, and ryokan are flat at −0.6pt: things have not yet started moving. Even between two Saturdays, the point at which demand takes shape shifts substantially with just one week’s difference.
Day-of-week patterns in the completed month, and monthly estimated settled ADR
Beyond leading indicators, it is worth checking the results of the month just ended on a day-of-week axis. For July 2026 (completed month), the monthly average estimated OCC (based on OTA-listed inventory) in Kagoshima was 81.5% for business hotels (132–141 properties observed), 83.2% for city hotels (22–24), 77.4% for ryokan (60–78) and 85.9% for resort hotels (38–43). Levelling this by day of the week brings out clear differences in the shape of demand by type.
Source: Compiled by the HotelBank Editorial Team from MetroEngines Research
Business hotels are high midweek — Tuesday 85.4%, Wednesday 84.8%, Thursday 85.6% — and sink on Friday (77.6%) and Sunday (69.6%): a “business travel” shape. Saturday at 88.9% reflects homecoming and leisure demand layered on top. For city hotels, Saturday stands out at 92.8% while Monday is the trough at 79.4%. Ryokan run 88.1% on Saturday and 82.4% on Sunday against a Wednesday trough of 71.8% — the strongest weekend concentration of the four. Resort hotels add Monday at 84.3% and Tuesday at 85.3% to Saturday 91.0% and Sunday 89.0%, holding the low-to-mid 80s even on weekdays, and show the smallest day-of-week spread of the four types in this article. In Kagoshima in summer, resort hotels have entered a phase of “filling regardless of the day of the week”.
Price levels are also worth checking, comparing final months year on year using monthly estimated settled ADR. The comparison between July 2026 (final) and July 2025 (final) is as follows.
| Type | Jul 2025 (final) | Jul 2026 (final) | YoY | Aug 2026 (current estimate) |
|---|---|---|---|---|
| Business hotels | ¥5,865 (N=155) | ¥5,898 (N=160) | +0.6% | ¥8,324 (N=153) |
| City hotels | ¥8,158 (N=23) | ¥7,390 (N=26) | −9.4% | ¥10,220 (N=25) |
| Ryokan | ¥9,131 (N=89) | ¥10,829 (N=81) | +18.6% | ¥12,824 (N=80) |
| Resort hotels | ¥14,038 (N=48) | ¥14,042 (N=49) | +0.0% | ¥16,602 (N=49) |
Source: Compiled by the HotelBank Editorial Team from MetroEngines Research
Comparing final months year on year, ryokan grew sharply at +18.6% (¥9,100 → ¥10,800), while city hotels fell 9.4% (¥8,200 → ¥7,400). Business and resort hotels were roughly flat. The right-hand column for August 2026 is an estimate based on current sales conditions and may move with sales through the month, so a straight comparison with final figures should wait until the month closes.
The same one point means different things once converted into yen
So far the four types have been compared only on estimated occupancy levels and their pickup in percentage points. Operational decisions, however, ultimately bite at the level of revenue per room. Substituting the estimated settled ADR for August 2026 already shown in this article, together with the estimated occupancy levels at the three cross-sections for stays on Saturday 15 August, into the definition RevPAR = ADR × occupancy converts those point differences into yen. This is not a new forecast, but a unit conversion based on the definition.
| Type | Estimated settled ADR, Aug 2026 | Pessimistic (45-days-out level) | Middle (30-days-out level) | Optimistic (14-days-out level) | Pessimistic → optimistic |
|---|---|---|---|---|---|
| Business hotels | ¥8,324 | ¥4,370 | ¥4,578 | ¥4,795 | +¥425 |
| City hotels | ¥10,220 | ¥7,614 | ¥7,716 | ¥7,961 | +¥347 |
| Ryokan | ¥12,824 | ¥7,617 | ¥7,912 | ¥8,592 | +¥975 |
| Resort hotels | ¥16,602 | ¥12,568 | ¥13,116 | ¥13,165 | +¥597 |
Source: Compiled by the HotelBank Editorial Team from MetroEngines Research
Reading this table horizontally, the difference between landing at the 45-days-out level and building up to the 14-days-out level for stays on Saturday 15 August is largest for ryokan at +¥975 per room. Resort hotels follow at +¥597, then business hotels at +¥425 and city hotels at +¥347. In percentage points the pickup is larger for business hotels (+5.1pt) than for resort hotels (+3.6pt), but converted into yen, resort hotels’ +¥597 exceeds business hotels’ +¥425. For higher-rate types, a small movement in points translates directly into a difference in money.
Ryokan’s +¥975 is 2.3 times that of business hotels. Ryokan start low at 45 days out (59.4%) and carry a high rate (¥12,824), which makes their “room to move in the remaining 45 days” the largest of any type in monetary terms. City hotels, conversely, have already built to 74.5% at 45 days out, leaving the smallest amount of money in play over the remaining 45 days. The rationale for differentiating tactics by type in the action plan below rests on this monetary gap, not on the gap in points.
Widening the combinations of rate and occupancy level gives the following picture. The vertical axis is the five estimated settled ADR levels that appear in this article; the horizontal axis is the five estimated occupancy levels actually observed for stays on Saturday 15 August.
| Estimated settled ADR \ estimated occupancy level | 52.5% Business, 45 days out | 59.4% Ryokan, 45 days out | 67.0% Ryokan, 14 days out | 74.5% City, 45 days out | 79.3% Resort, 14 days out |
|---|---|---|---|---|---|
| ¥5,898 Business hotels, Jul 2026 final | ¥3,096 | ¥3,503 | ¥3,952 | ¥4,394 | ¥4,677 |
| ¥8,324 Business hotels, Aug 2026 estimate | ¥4,370 | ¥4,944 | ¥5,577 | ¥6,201 | ¥6,601 |
| ¥10,220 City hotels, Aug 2026 estimate | ¥5,366 | ¥6,071 | ¥6,847 | ¥7,614 | ¥8,104 |
| ¥12,824 Ryokan, Aug 2026 estimate | ¥6,733 | ¥7,617 | ¥8,592 | ¥9,554 | ¥10,169 |
| ¥16,602 Resort hotels, Aug 2026 estimate | ¥8,716 | ¥9,862 | ¥11,123 | ¥12,368 | ¥13,165 |
Source: Compiled by the HotelBank Editorial Team from MetroEngines Research
Between the top-left of the grid (low rate × low occupancy) and the bottom-right (high rate × high occupancy), revenue per room differs by more than fourfold. Placing your own property’s rate and its progress at 45 days out on these coordinates lets you compare, on a single yardstick, what “moving occupancy up one step” and “moving rate up one step” are each worth in yen. Note that estimated occupancy is based on OTA-listed inventory and runs higher than actual room occupancy, so the amounts derived here should be treated not as absolute levels but as an indicator for relative comparison between types and between cross-sections.
For revenue managers running hotels and ryokan in Kagoshima — implications and an action plan
(1) Use “the level at 45 days out” to identify which type your property behaves like. At the 45-days-out phase the market splits into a high-level group — resort hotels at 75.7–82.6% and city hotels at 74.5–87.1% — and a late-building group — business hotels at 52.5–68.8% and ryokan at 59.4–70.0%. Which group your own booking pace at 45 days out resembles changes the nature of what can be done in the remaining 45 days. Closer to the former, it is a question of how to sell the remaining inventory at a higher rate; closer to the latter, it is a question of how to fill it. The tactics run in opposite directions at the very same “45 days out”.
(2) Pickup is a characteristic of the type, not a measure of effort. Pickup from 45 to 14 days out runs +3.6 to +4.5pt for resort hotels, +3.4 to +8.8pt for city hotels, +5.1 to +7.3pt for business hotels and +6.1 to +10.6pt for ryokan. Checking whether your own build-up over the final 45 days falls within these ranges gives a sense of whether things “will still move” or “will not move any more”. For a resort hotel tracking below plan at 45 days out, the market’s average pickup is around +4pt, so a judgement call is needed early rather than betting on a late recovery.
(3) Mark the 22 August discontinuity on the calendar. On Saturday 22 August, the first Saturday after Obon, business hotels were +16.3pt and city hotels +12.6pt above 15 August in the 45-days-out phase. For business and city hotels in the prefecture, August’s highest-value date may sit on the post-Obon weekend rather than during Obon itself. For resort hotels the gap stops at +4.0pt, and this discontinuity barely applies.
(4) The day-of-week trough falls on a different day for each type. In the July 2026 results, the trough was Sunday (69.6%) for business hotels, Monday (79.4%) for city hotels and Wednesday (71.8%) for ryokan. Because the “day you need to fill” differs by type even within the same prefecture, copying a neighbouring property’s moves straight into your own day-of-week strategy will target the wrong trough.
Translating the above into an action plan along a time axis gives the following.
| Horizon | Action | Decision trigger | Objective |
|---|---|---|---|
| Today–this week | Review remaining inventory for 13 and 15 August against the pickup range for your type | Your progress on 15 August from 45 days out to today falls short of the market’s pickup (business +5.1pt / ryokan +7.6pt / resort +3.6pt / city +3.4pt) | Cut losses early on types with little room for a late recovery and switch how the remaining inventory is sold |
| Today–this week | Re-estimate the inventory allocation for Saturday 22 August at a higher level than 15 August | Your settings for 22 August remain at or below those for 15 August (the market shows gaps of +16.3pt / +12.6pt at 45 days out) | Avoid missing the post-Obon weekend demand discontinuity |
| Within two weeks | Treat Saturday 29 August as “a date that gets decided at 30 days out” | The business hotel market moves +10.4pt from 45 to 30 days out while your own 29 August is roughly flat | Capture the resumption of business travel after the summer holidays while exposure still works |
| Within two weeks | Prepare stay offers matched to the day-of-week trough | Your trough differs from the July result for your type (business Sunday 69.6% / city Monday 79.4% / ryokan Wednesday 71.8%) | Align the smoothing of the week to the actual demand shape of your type |
| Looking to next month | Lock in Saturday 5 September as a 45-days-out preparation point | You alone are moving to discount early while the market has moved within +2.0pt from 45 to 30 days out (ryokan −0.6pt) | Avoid conceding rate first on dates where demand has not yet taken shape |
| Looking to next month | Reconcile monthly estimated settled ADR against your own rate band | Your actual July 2026 rate sits well away from the market’s final figures (business ¥5,898 / city ¥7,390 / ryokan ¥10,829 / resort ¥14,042) | Anchor the starting point of the autumn-onward pricing calendar to prefecture-level norms |
Source: Compiled by the HotelBank Editorial Team from MetroEngines Research
Conclusion — three yardsticks for measuring summer in Kagoshima
The first yardstick is “the height at 45 days out”. Types riding high levels in the 45-days-out phase — resort hotels at 75.7–82.6% and city hotels at 74.5–87.1% — have limited scope in the remaining 45 days. Business hotels at 52.5–68.8% and ryokan at 59.4–70.0%, by contrast, arrive at 45 days out still holding room. Which group your property’s shape belongs to can be established reliably by measuring at the same phase in the same season each year.
The second yardstick is “the width of the pickup”. From 45 to 14 days out, pickup runs +3.6 to +4.5pt for resort hotels, +3.4 to +8.8pt for city hotels, +5.1 to +7.3pt for business hotels and +6.1 to +10.6pt for ryokan. Comparing this width against your own results makes it possible to estimate late movement rather than merely hope for it.
The third yardstick is “the discontinuity in the calendar”. In August in Kagoshima, the peak of Obon proper falls on Thursday 13 August, not Saturday 15 August. And Saturday 22 August, after Obon, runs well above the Saturday of Obon — +16.3pt for business hotels and +12.6pt for city hotels at 45 days out. Allocating inventory and exposure around the discontinuities in the calendar, rather than the day-of-week calendar, is what works in a Kagoshima summer.
About the data
| Item | Detail |
|---|---|
| Definition of estimated OCC | Occupancy based on OTA-listed inventory = 100 − 100 × rooms remaining on OTA listings ÷ total rooms. It is an estimate based on how listed inventory is absorbed on OTAs, and is defined differently from actual room occupancy (it runs higher). This article labels it “estimated OCC (based on OTA-listed inventory)”. The periods covered are July 2026 (completed-month results) and stays on 13, 15, 22 and 29 August and 5 September 2026. |
| Booking curve | Based on observations from 45 days before the stay date through to the most recent point. The three-point frame in this article uses the median of each interval: “45 days out = 45–41 days remaining”, “30 days out = 33–27 days remaining”, “14 days out = 20–14 days remaining”. Cross-sections where the number of properties observed falls below half the maximum observed for that stay date are excluded from the calculation of representative values. |
| Definition of estimated settled ADR | The transaction price level (pre-tax equivalent) estimated from OTA and other sales data (lowest-plan level × type-specific coefficients, ensembled across multiple channels). Past months are final; current and future months are estimates based on current sales conditions. Median error against published operating results is 6.6%. |
| Breakdown of N | Properties observed for booking curves: business hotels N=120–140, city hotels N=21–24, ryokan N=60–76, resort hotels N=37–43 (varying by stay date and observation point). July 2026 completed-month results: business N=132–141, city N=22–24, ryokan N=60–78, resort N=38–43. Estimated settled ADR: July 2025 N=155 / 23 / 89 / 48 properties, July 2026 N=160 / 26 / 81 / 49, August 2026 N=153 / 25 / 80 / 49 (business / city / ryokan / resort). |
| Data timing | Data as of 9 August 2026. Sales conditions and inventory move daily, so the figures in this article are a snapshot as at the time of retrieval. |
Source: Compiled by the HotelBank Editorial Team from MetroEngines Research
■ Data sources
Estimated occupancy, properties observed and sellout status are compiled from listed-inventory data collected daily by MetroEngines Research from publicly available OTA information, aggregated by Kagoshima × property type (business hotels / city hotels / ryokan / resort hotels). Estimated settled ADR is the same company’s estimate from sales data; July 2025 and July 2026 are final, while August 2026 is a current estimate. The day-of-week aggregation for the completed month bundles daily observations for July 2026 by day of the week. Data as of 9 August 2026.
■ Calculation assumptions
Representative values in the three-point frame are the medians of observations within each interval: “45-days-out phase = 45–41 days remaining”, “30-days-out phase = 33–27 days remaining”, “14-days-out phase = 20–14 days remaining”. Cross-sections where the number of properties observed falls below half the maximum observed for that stay date are excluded from the calculation of representative values. The estimated RevPAR equivalent is a unit conversion substituting the August 2026 estimated settled ADR and each phase’s estimated occupancy level into the definition RevPAR = ADR × occupancy; no new forecasting model has been applied. Both axes of the two-axis grid are composed solely of values that appear in the body of this article, with no extrapolation beyond those ranges.
■ Limitations and caveats
Estimated occupancy is based on OTA-listed inventory, is defined differently from actual room occupancy and runs higher. The estimated RevPAR equivalent is therefore an indicator for relative comparison between types and between cross-sections, not an absolute monetary level. Estimated settled ADR for August 2026 may move by month-end with sales conditions, so it cannot be compared directly with final figures. The number of properties observed varies by stay date and observation point, so thin cross-sections cannot be read as standalone signals. At the time of writing, 29 August and 5 September had not reached the 14-days-out phase and are compared on two points only.
Related reading
- Obon T-7: Kyushu’s 31.7pt Gap — Fukuoka 73.0%, Kagoshima 41.3%
- Tochigi Booking Curves by Type: Resort 81.1% at T-45, Only +2.6pt Left
- Shimane Obon 2026: Only Aug 15-16 Dip; Aug 22 Business Hotels 90.9%
- Kyoto Obon 2026 Booking Curves: Ryokan Add the Most Close In, +11.4pt
- Yamanashi Obon: Ryokan Gain Only +1.1pt, Business Hotels +7.9pt
- Okinawa Late-Summer Booking Curve 2026: Sep 5 Beats Obon, City +4.7pt
- Okayama Booking Curves: 3 Checkpoints, Aug 8 Late-Surges +11.8pt
- Hyogo Booking Curves: 3.6x Pickup Gap, Ryokan Sellout Rate 28.4%