

When was your company’s business travel expense policy last revised? Following the April 2025 amendment to Japan’s Travel Expenses Act, national civil servants have shifted toward an actual-cost reimbursement system, yet many private-sector corporate policies remain frozen at levels set more than a decade ago. In this article, we use median ADR data compiled by MetroEngines Research for business-class hotels (Economy through Upper, N=4,598 properties) across all 47 prefectures, and quantitatively examine how far actual market prices exceed the per-rank ceilings (general staff, section chief, manager) typically referenced in such policies.
Metric Definitions Used in This Article
- Median ADR: For business-class hotels (hotel_category=Business Hotel, grade=Economy through Upper) across the 47 prefectures, we calculated each property’s three-day average price for May 19, 20, and 21, 2026 (Tue/Wed/Thu) and took the median value per prefecture. This is the average of advertised prices on OTAs and other channels, and differs from actual transaction prices.
- Pricing conditions: Per-room rate for double occupancy (tax inclusive), averaged across all plans (room-only through meal-inclusive plans).
- Rank-based ceilings: This article adopts the levels frequently referenced in private-sector policy revision discussions: ¥9,000 (general staff), ¥11,000 (section chief), ¥13,000 (manager), and ¥15,000 (department head ceiling equivalent).
- Excess rate: The percentage by which the actual median ADR exceeds the policy ceiling.
- Data source: MetroEngines Research (N=4,598 properties).
Excess Rate vs. Rank-Based Limits: Almost Universal Across All 47 Prefectures
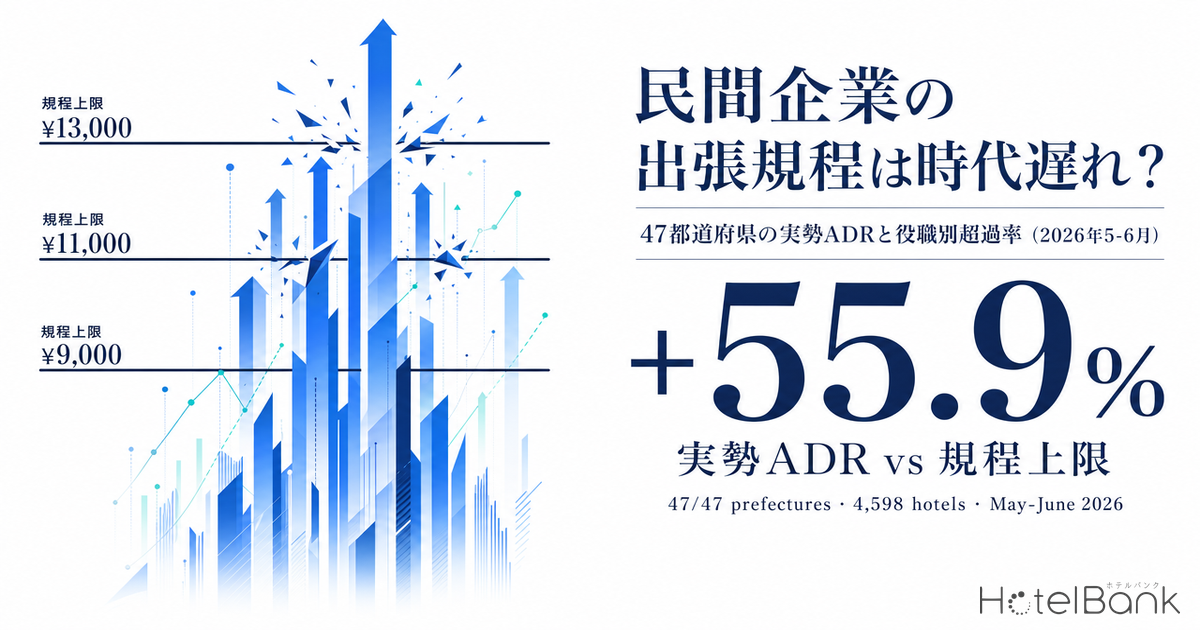
First, we tabulate how many of the 47 prefectures have actual median ADR exceeding each rank-based ceiling. We confirmed that all 47 prefectures (100%) exceed the ¥9,000 general-staff line, 46 prefectures (98%) exceed the ¥11,000 section-chief line, and 35 prefectures (74%) exceed the ¥13,000 manager line.
In other words, for general staff and section-chief tiers, it is effectively impossible to find compliant accommodation in any prefecture. Even at the manager tier, three-quarters of the country exceeds the limit, demonstrating that the gap between policy and reality has become routine even for senior business travelers with approval authority.
| Assumed Rank | Policy Ceiling | Prefectures Over Limit | Average Excess |
|---|---|---|---|
| General staff | ¥9,000 | 47/47 (100%) | +55.9% |
| Section chief | ¥11,000 | 46/47 (98%) | +28.2% |
| Manager | ¥13,000 | 35/47 (74%) | +12.4% |
| Department head ceiling | ¥15,000 | 8/47 (17%) | +13.5% |
Source: Compiled by HotelBank Editorial Team from MetroEngines Research
Looking at the average excess, in the 47 prefectures over the ¥9,000 line the actual price exceeds the limit by an average of +55.9%. Even at the ¥11,000 line the gap is +28.2%, and at the ¥13,000 line +12.4%. The crucial point is that this is not a “shortfall of a few hundred yen” but rather a structural shift where rates clearly in the upper-¥10,000 range have become standard.
47-Prefecture Map: 35 Prefectures Exceed ¥13,000
The chart below arranges median ADR by prefecture in geographic order (Hokkaido to Okinawa) and color-codes them based on the ¥13,000 manager line. The 35 prefectures above ¥13,000 are shown in blue, the 12 below in gray.
Source: Compiled by HotelBank Editorial Team from MetroEngines Research (N=4,598 properties, median of three Tue/Wed/Thu days in May 2026)
Tokyo at ¥23,469 and Kyoto at ¥20,748 stand out, with both showing an excess rate of +60-80% even against the ¥13,000 manager benchmark. Following them in the ¥15,000 range are Chiba (¥15,694), Shiga (¥15,536), Nara (¥15,275), and Nagano (¥15,227)—areas around metropolitan Tokyo and regions benefiting from inbound demand spillover.
Conversely, the prefectures that remain below the ¥13,000 line are limited mainly to Shikoku and southern Kyushu: Tokushima (¥10,801), Ehime (¥11,891), Miyazaki (¥11,902), and Tottori (¥11,954). However, even these regions clearly exceed the ¥9,000 general-staff line, so the conventional assumption that “policy excess is an urban issue” no longer holds.
Year-over-Year: ADR Rose in 42 Prefectures, National Median YoY +6.8%
We organized YoY changes by prefecture, comparing the May 2026 same-weekday sample (Tue/Wed/Thu) with the same period in 2025 (May 20, 21, 22). ADR rose in 42 of the 47 prefectures, with a national median change rate of +6.8% and an average of +5.7%.
Source: Compiled by HotelBank Editorial Team from MetroEngines Research
The top gainers are Saitama (+15.1%), Tochigi (+14.6%), Okinawa (+14.4%), and Chiba (+13.6%). It is noteworthy that prefectures around the Tokyo metropolitan area and Okinawa, where resort demand has rebounded, show comparable rates of increase. Meanwhile, Osaka declined sharply at -23.1% YoY, consistent with the rebound from the special demand created by the 2025 Osaka-Kansai Expo.
The lodging price index in the Ministry of Internal Affairs’ Consumer Price Index also rose +5.6% YoY in Q1 2026, roughly matching this article’s ADR analysis (median YoY +6.8%). In other words, even accounting for regional and weekday factors, hotel accommodation costs are structurally rising at a pace of approximately 6-7% per year. The structural drivers behind this nationwide ADR increase—namely, inflation pass-through and labor cost transfer—are decomposed against CPI in our article National Average ADR Hits Record ¥32,340 (May 2026): CPI and Labor Cost Pass-Through.
Eight Major Prefectures: Per-Rank Shortfall Simulation
For eight major prefectures, we tabulate the shortfall against each rank-based limit. “Shortfall” means actual median ADR minus policy ceiling—the amount the traveler must absorb out-of-pocket or settle separately.
| Prefecture | Median ADR | General Staff ¥9,000 | Section Chief ¥11,000 | Manager ¥13,000 |
|---|---|---|---|---|
| Tokyo | ¥23,469 | ¥14,469 | ¥12,469 | ¥10,469 |
| Kyoto | ¥20,748 | ¥11,748 | ¥9,748 | ¥7,748 |
| Osaka | ¥14,150 | ¥5,150 | ¥3,150 | ¥1,150 |
| Kanagawa | ¥14,881 | ¥5,881 | ¥3,881 | ¥1,881 |
| Fukuoka | ¥14,542 | ¥5,542 | ¥3,542 | ¥1,542 |
| Hokkaido | ¥14,283 | ¥5,283 | ¥3,283 | ¥1,283 |
| Aichi | ¥13,761 | ¥4,761 | ¥2,761 | ¥761 |
| Okinawa | ¥14,141 | ¥5,141 | ¥3,141 | ¥1,141 |
Source: Compiled by HotelBank Editorial Team from MetroEngines Research (red figures indicate shortfall above policy)
For business travel to Tokyo, even a manager faces a ¥10,469 shortfall per night. In Kyoto, the manager-tier shortfall is ¥7,748, and the section-chief shortfall is ¥9,748. When the per-night out-of-pocket cost exceeds ¥10,000, the burden on the traveler is significant, and revising the policy becomes urgent if the costs are to be reasonably reimbursed as legitimate business expenses.
In other major destinations such as Fukuoka, Hokkaido, Osaka, and Okinawa, the general-staff tier routinely faces shortfalls in the ¥5,000 range and the section-chief tier in the ¥3,000 range. For two-night trips, the shortfall often exceeds round-trip transportation costs. For weekday ADR trends in the four largest cities that are the focus of business travel demand, our article In-Depth Weekday ADR Analysis for Tokyo, Nagoya, Osaka, and Fukuoka: Visualizing Business Demand Recovery visualizes these by day of the week and grade.
Top 10 High-ADR Prefectures: Concentration of Business Travel Demand
The table below lists the 10 prefectures with the highest median ADR. In addition to the standout figures for Tokyo and Kyoto, a notable feature is that prefectures functioning as “tourist destinations also accessible to the Tokyo metropolitan area”—Chiba, Shiga, Nara, Yamagata, Yamanashi, and Nagano—cluster in the ¥15,000 range.
| Prefecture | Median ADR | YoY | N (Properties) |
|---|---|---|---|
| Tokyo | ¥23,469 | +8.8% | 556 |
| Kyoto | ¥20,748 | +9.6% | 114 |
| Chiba | ¥15,694 | +13.6% | 81 |
| Shiga | ¥15,536 | +8.8% | 64 |
| Nara | ¥15,275 | +0.5% | 20 |
| Nagano | ¥15,227 | +8.0% | 118 |
| Yamagata | ¥15,121 | +7.9% | 54 |
| Yamanashi | ¥15,109 | +6.8% | 56 |
| Kanagawa | ¥14,881 | +10.2% | 134 |
| Akita | ¥14,695 | +2.5% | 42 |
Source: Compiled by HotelBank Editorial Team from MetroEngines Research
The high values in Shiga (¥15,536) and Nara (¥15,275) suggest that business demand may be flowing into the suburbs in response to surging prices in Kyoto and Osaka. The presence of Nagano, Yamanashi, and Yamagata in the top ranks reflects a structural pattern in which business hotels are difficult to secure during periods that overlap with leisure demand (recreational seasons). For the perspective of choosing destinations based on cost-performance, our article The Reality of Soaring Business Hotel Prices: National ADR Analysis and Top 10 Most Cost-Effective Prefectures for Business Travel organizes this by prefecture and is useful as a reference for policy operations.
Practical Issues in Policy Revision: Three Options
Based on this data, the options for revising private-sector business travel policies can be broadly summarized as follows.
(1) Two-Tier System Raising Limits for Urban Areas: Shifting from the conventional “uniform nationwide” approach to a system that differentiates major cities (Tokyo, Osaka, Kyoto, etc.) from regional areas. According to surveys by the Sanro Research Institute, among companies adopting fixed-amount payments, those applying a “uniform nationwide rate” are decreasing, with two-tier and three-tier systems reflecting regional differences gaining ground. This data shows a clear stepped pattern with the ¥13,000 manager line as the benchmark: Tokyo and Kyoto in the ¥16,000-¥20,000 range, others in the ¥13,000-¥15,000 range.
(2) Transition to Actual-Cost Reimbursement: The April 2025 amendment to the Travel Expenses Act made actual-cost reimbursement the principle for national civil servants. To avoid the risk of out-of-pocket expenses for travelers under fixed-amount payments, more private-sector companies are adopting receipt-based actual-cost reimbursement systems. In situations where, as this data shows, actual ADR exceeds policy by +12% to +56%, fixed-amount payments easily become a source of perceived unfairness and reimbursement disputes among travelers.
(3) Rank Flattening: In recent years, some private-sector companies have narrowed the gap between rank-based ceilings and instead allow travelers to choose accommodation based on practical considerations (proximity to stations, breakfast, power outlets, etc.). Using this article’s median ADR (national ¥13,761) as a common reference line for all ranks and authorizing actual-cost reimbursement for amounts over the ceiling is a pragmatic solution that follows market reality while keeping policy revision costs low.
Summary: What the Latest Three-Month Data Shows
Let us summarize the key points. First, the median ADR for business-class hotels on weekdays (Tue/Wed/Thu) in May 2026 exceeds the ¥9,000 general-staff line in all 47 prefectures, the ¥11,000 section-chief line in 46 prefectures, and the ¥13,000 manager line in 35 prefectures. Second, ADR rose YoY in 42 prefectures, with a national median YoY of +6.8%—a structural upward trend consistent with the lodging CPI. Third, the standout figures for Tokyo and Kyoto are accompanied by a simultaneous “shift to suburbs” trend in Shiga, Nara, and Chiba.
The implication for private-sector companies is clear. Fixed-amount business travel expense policies that have been frozen for over a decade are becoming dysfunctional against current market prices, and a shift to one of three options—two-tier systems, actual-cost reimbursement, or rank flattening—has become a realistic choice. We hope this data will be used as foundational information for assessing “where current actual ADR stands” and “what excess rate applies to our company’s target destinations” when considering policy revision.
Note on Future-Date ADR: The ADR figures in this article are averages of advertised prices on OTAs at the time of survey, and will fluctuate as the check-in date approaches. Currently elevated prices may decline through last-minute discounts, or rise further during periods of demand concentration. The YoY comparison in this article compares the prefectural medians of May 19-21, 2026 with May 20-22, 2025 (both Tue/Wed/Thu three-day periods).
Related Articles
- National Civil Servant Travel Allowances vs. Actual ADR: Visualizing the 47-Prefecture Gap (2026 Update)
- The Reality of Soaring Business Hotel Prices: National ADR Analysis and Top 10 Most Cost-Effective Prefectures for Business Travel
- In-Depth Weekday ADR Analysis for Tokyo, Nagoya, Osaka, and Fukuoka: Visualizing Business Demand Recovery
- National Average ADR Hits Record ¥32,340 (May 2026): Structural Decomposition of “+19% in Three Years” Driven by Inflation and Labor Cost Pass-Through
- The True Nature of Labor-Cost-Driven ADR Increases: Decoding 2026’s Hotel Pricing Structure Through OCC-ADR Divergence
- Golden Week 2026 YoY ADR Analysis for Six Major Cities: Decoding the Drivers Behind Kyoto +20% and Tokyo +17%
- One Month After Kyoto’s New Lodging Tax: Kyoto ADR YoY +18.6%, Pricing Shifts Toward Premium Tier
- [March 2026 Update] Lodging Market Where Tourism, Business, and Culture Cities Intersect: New Hotel Openings in Tokyo’s 23 Wards
- Are Japanese Hotels Cheap by Global Standards? Tokyo, Osaka, and Kyoto ADR in USD vs. New York, Paris, and London
- JTA’s 2026 Budget of ¥138.3 Billion: The Ideal of Regional Distribution vs. the Reality of 2.5x ADR Disparity
- The Real Reason Behind Kyoto’s Standout ADR: A Data-Based Examination of Aoi Festival, Hinoeuma Year, and the 60-Year Cycle
- How Korean Mini-Holidays Drive Kyushu ADR: Verifying the “Routinization” of Inbound Travel with Real Market Data