

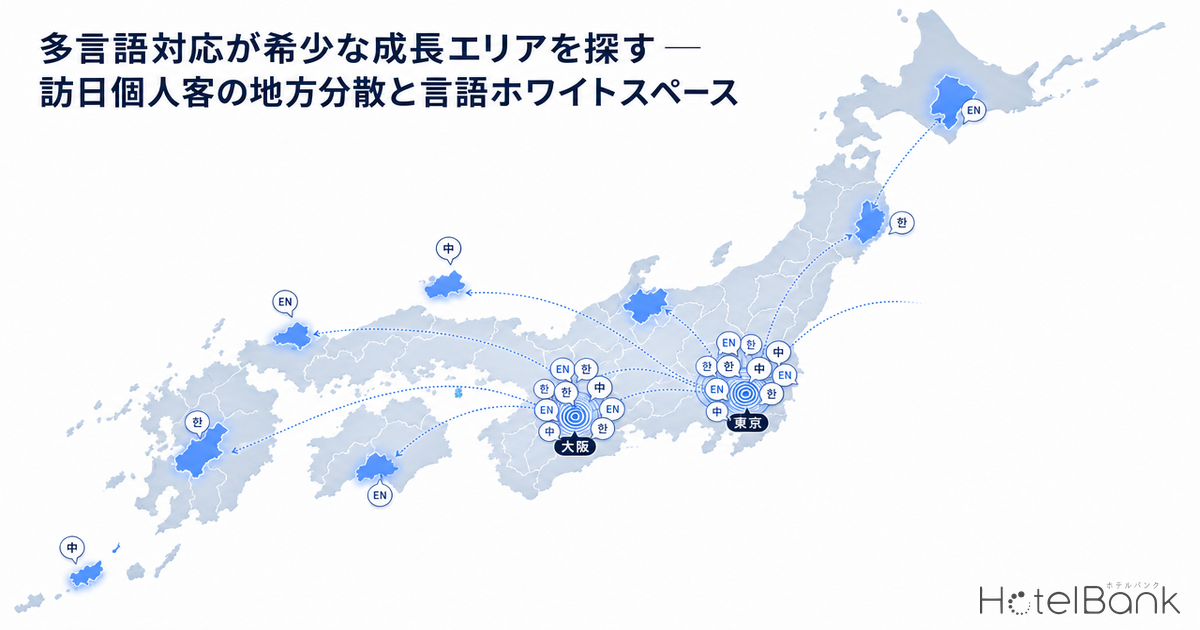
Inbound travelers’ destinations continue to quietly spread from the Golden Route of Tokyo, Osaka, and Kyoto into the regions. While May 2026 inbound arrivals were down 3.6% year-on-year overall, 19 markets including South Korea, Taiwan, and the United States set new May records. Even as total growth slows, the regional dispersion of free independent travelers (FIT) is, if anything, accelerating. In this article, we cross-reference staff evaluation tags extracted from guest reviews — “multilingual support” and “English is understood” — with country-by-country mention data to quantitatively identify areas with strong inbound demand but scarce multilingual support, in other words the growth whitespace.
Metric Definitions Used in This Article
- Inbound demand volume: Number of guest reviews posted in foreign languages (English, Traditional Chinese, Korean) over the past 24 months. A proxy indicator of how many inbound FIT travelers have actually stayed in an area.
- English support supply: Number of properties where “English is understood” was mentioned positively above a certain threshold. Represents the thickness of properties where staff language capability is actually felt by guests.
- Support density: English support supply ÷ Inbound demand volume × 1,000. The smaller the value, the scarcer multilingual-capable properties are relative to demand.
- ADR (Average Daily Rate): Average of publicly listed prices on OTAs etc. Differs from actual transacted prices. Per-room rate for two-person, one-room use (tax included), averaged across all plans (room-only through meal-included).
- Data sources: Guest review aggregation by HotelBank Editorial Team (NLP analysis); price data from MetroEngines Research.
- — May 2026 inbound arrivals were down 3.6% YoY, yet 19 markets set new May records. Slowing totals and FIT regional dispersion are happening simultaneously.
- — The leading growth whitespace where demand is thick but English support supply is thin is Okinawa (support density 0.17). Hokkaido (0.52), Fukuoka (0.60), and Oita (0.45) are also failing to keep up with supply.
- — Country-by-country asymmetry is key. Fukuoka and Oita need Korean and Chinese, while Nagano (English 92.8%) and Hiroshima (93.5%) need English; the priority languages to prepare differ by area.
- — Building out reception capability directly translates to pricing upside. Kyoto ADR is +17.2% YoY, Hokkaido +11.0% (April 2026, two-person room, tax included).
- — REIT disclosures also back up the demand. JHR (8985) occupancy 85.8%, transacted ADR +4.6%; Invincible (8963) occupancy 85.8% (+0.8pt, April 2026).
Totals Are Slowing, But 19 Markets Set May Records — Regional Dispersion Is Another Current
According to the Japan National Tourism Organization (JNTO), May 2026 inbound arrivals were 3,559,900, down 3.6% year-on-year and the second consecutive month of YoY decline. However, this decline is largely attributable to the drop in the heavily weighted Chinese market. Meanwhile, 19 markets including South Korea, Taiwan, the United States, and Malaysia set new May records, confirming firm demand across East Asia, Southeast Asia, and the West.
In other words, the current phase sees the YoY decline in totals coexisting with individual market record highs. With markets moving in different directions, destination choices are also diversifying. Repeat-heavy Korean and Taiwanese FIT travelers, having completed the Golden Route, are increasingly choosing regional cities and onsen towns as their next destinations. The behavioral pattern of touring Tokyo, Osaka, and Kyoto on the first visit and venturing to Beppu, Hokkaido, Tohoku, or the Setouchi region on second or third visits has taken hold. This non-Chinese-market dynamic has been the engine pushing up regional ADR.
For accommodation operators, this regional dispersion means new points of contact with new customer segments. On the other hand, since many regional accommodation facilities have long operated primarily for domestic guests, multilingual support is still nascent at many properties. Here, a gap is emerging between the broadening of demand and reception capabilities. This article reframes that gap as “scarcity = growth potential.”
Source: HotelBank Editorial Team research (foreign-language review counts, past 24 months, N = major area aggregates)
“English Is Understood” Is Still Scarce Nationwide — Starting with the National Evaluation Map
So how often do guests actually write that “English was understood”? When we aggregate properties where guests positively cited “English is understood” as a staff evaluation across the nation, properties with concentrated mentions are by no means numerous. Rather, properties with a high share of “English is understood” mentions in overall reviews are skewed toward guesthouses and small ryokans.
The table below shows the top properties nationwide by “English is understood” mention count in guest reviews. Notable is that the upper ranks mix not only large city hotels but also small properties such as a guesthouse in Matsushima, Miyagi (mention rate 19.8%) or Uno Port Inn in Okayama. Rather than facility scale, it appears that whether a property positions inbound FIT travelers as its core operating focus is what generates the difference in evaluation thickness.
| Rank | Area | Property | Mention rate | Total reviews |
|---|---|---|---|---|
| 1 | Osaka | HOTEL THE FLAG Shinsaibashi | 3.59% | 2,923 |
| 2 | Kyoto | Kyo-Machiya Ryokan Sakura Urushi-tei | 5.17% | 1,741 |
| 3 | Chiba | Narita Tobu Hotel Airport | 0.97% | 8,927 |
| 4 | Chiba | Hotel Nikko Narita | 1.78% | 4,604 |
| 5 | Tokyo | Hotel Sunroute Plaza Shinjuku | 1.44% | 4,796 |
| 6 | Gifu | Magome Chaya | 6.16% | 1,023 |
| 7 | Okayama | Uno Port Inn | 9.48% | 580 |
| 8 | Tokyo | THE KNOT TOKYO Shinjuku | 1.18% | 4,583 |
| 9 | Kyoto | Piece Hostel Sanjo | 2.58% | 1,902 |
| 10 | Kanagawa | Mount View Hakone | 3.67% | 1,255 |
| 11 | Miyagi | Uchi Matsushima Guesthouse | 19.82% | 227 |
| 12 | Shizuoka | K’s House Ito Onsen | 4.94% | 809 |
Source: HotelBank Editorial Team research (“English is understood” mention counts, top properties, past 24 months, positive mentions only)
What this table shows is the fact that English-support evaluation is driven more by the stance of individual properties than by the scale of cities. Put differently, even regional areas can earn high evaluations once they build out reception capability, as the Miyagi and Okayama examples show. The scarcity of regional areas is, conversely, nothing other than a differentiation opportunity for early movers.
Cross-Referencing Demand and Supply — The Support Density Map Reveals the Growth Whitespace
Here is the core of this article. Placing each area’s “inbound demand volume (foreign-language review count)” on the horizontal axis and “English support supply (number of properties evaluated as English-understood)” on the vertical axis, the relationship between the two reveals each area’s positioning. Areas where demand is thick but supply is thin — the bottom-right region — are the multilingual support growth whitespace.
Source: HotelBank Editorial Team research (inbound demand volume = foreign-language review count; English support supply = number of properties evaluated as “English understood”; past 24 months)
When we standardize the thinness of supply relative to demand as “support density (number of English-support properties per 1,000 demand reviews),” the differences between areas become more pronounced. The table below lists areas with a certain scale of inbound demand, ordered by lowest support density — that is, by largest whitespace.
| Area | Inbound demand volume | Country mix | English support supply | Support density |
|---|---|---|---|---|
| Okinawa | 24,239 | English 55% / Taiwan 35% | 4 | 0.17 |
| Chiba | 33,054 | English 92% (Narita transit) | 11 | 0.33 |
| Oita | 11,114 | Korean 29% / Taiwan 20% | 5 | 0.45 |
| Hokkaido | 46,399 | English 64% / Taiwan 20% / Korean 16% | 24 | 0.52 |
| Osaka | 74,523 | English 84% | 40 | 0.54 |
| Kumamoto | 8,546 | English 53% / Taiwan 27% / Korean 19% | 5 | 0.59 |
| Nagano | 26,895 | English 93% | 16 | 0.59 |
| Fukuoka | 26,845 | Korean 22% / Taiwan 25% | 16 | 0.60 |
| Ishikawa | 9,224 | English 91% | 6 | 0.65 |
| Shizuoka | 12,178 | English 82% | 8 | 0.66 |
Source: HotelBank Editorial Team research (support density = English support supply ÷ demand volume × 1,000; past 24 months)
Against demand volume of 24,239, Okinawa has only 4 properties evaluated for English support — a support density of 0.17, conspicuously low even nationwide. Hokkaido (0.52) and Fukuoka (0.60) are also failing to keep supply in line with their demand scale. Oita in particular hosts Beppu and Yufuin and ranks among the nation’s thickest for Korean-language reviews at 3,192, yet English support supply remains at just 5 properties with a density of 0.45. These are areas where demand is clearly observed, harboring significant potential for the properties that move first to build out reception capability.
Country Asymmetry — The Required Languages Differ Even Among “Regional” Areas
What cannot be overlooked when discussing whitespace is the significant “country asymmetry” — that is, the nationality composition of visitors differs greatly by area. Even among the same regional dispersion destinations, the substance of multilingual support to prepare differs between English-led areas and Korean/Chinese-led areas.
Looking at the language composition of reviews, Nagano (English share 92.8%) and Hiroshima (93.5%) are English-dominant areas with overwhelmingly thick Western FIT presence. On the other hand, Fukuoka is an East Asia-dominant area where Korean and Traditional Chinese together account for roughly 47%, and Oita also has a standout Korean share. Hokkaido shows a relatively balanced distribution of English, Chinese, and Korean. In other words, when considering “multilingual support” in Fukuoka or Oita, Korean and Chinese signage is effective, while in Nagano or Hiroshima, deeper English support is what works — an area-specific optimum exists.
Source: HotelBank Editorial Team research (language composition of foreign-language reviews, past 24 months)
This asymmetry releases multilingual support from the one-size-fits-all assumption that “English alone is enough.” If support is focused on the thickly demanded languages, even limited staffing tends to translate into evaluations that guests can feel. How evaluation axes differ by language is also explored in our Tokyo language-based review score gap analysis. Regional onsen towns where English support is already observed — Gifu (Takayama, Magome, support density 1.62), Gunma (Kusatsu, 3.48), and Tochigi (Nikko, 2.40) — are precisely the prime examples that have built out reception capability ahead of demand for their own visitor mix, achieving thick supply relative to demand.
Pricing Upside — Reception Capability Supports Rates
Building out multilingual support is connected not only to guest satisfaction but also to pricing upside. Looking at ADR trends in areas with thick inbound demand, Kyoto is showing strong growth at +17.2% YoY and Hokkaido at +11.0% (April 2026, two-person room, tax included). Okinawa (+5.9%) and Fukuoka (+4.8%) are also rising steadily, and we can read a tendency for the more advanced inbound FIT capture, the greater the upside for price uplift.
| Area | ADR (Apr 2026) | YoY | Properties |
|---|---|---|---|
| Kyoto | ¥49,700 | +17.2% | 1,502 |
| Hokkaido | ¥29,400 | +11.0% | 1,524 |
| Fukuoka | ¥29,100 | +4.8% | 724 |
| Okinawa | ¥27,000 | +5.9% | 1,715 |
| Osaka | ¥26,200 | +5.9% | 863 |
| Tokyo | ¥36,200 | ±0.0% | 1,584 |
Source: MetroEngines Research, compiled by HotelBank Editorial Team (ADR = average publicly listed prices, two-person room, tax included)
Disclosures from listed hotel REITs also back up the firmness of inbound demand. Japan Hotel REIT Investment Corporation (8985) recorded an April 2026 transacted ADR of ¥21,133 (+4.6% YoY), and occupancy held at a high 85.8%. Invincible Investment Corporation (8963) also showed firm operations with occupancy of 85.8% (+0.8pt YoY) across its 101 domestic hotel properties. Note that because our OTA publicly listed ADR is structurally inflated by leftover high-price plans that remain unsold, it tends to be on average +25-30% higher than REIT-disclosed transacted ADR; the direction of YoY changes, however, is consistently upward in both. Building out reception capability reduces missed demand and supports both occupancy and rate — that virtuous cycle is the upside for properties filling in the whitespace.
Summary — How to Read “Areas with Room to Grow Precisely Because They Are Scarce”
In this article, against the backdrop of advancing inbound FIT regional dispersion, we cross-referenced guest-review language data with staff evaluations such as “English is understood” and “multilingual support” to identify the growth whitespace — areas where multilingual support is scarce relative to demand. There are three takeaways.
First, areas like Okinawa, Hokkaido, Fukuoka, and Oita have clearly observed inbound demand but thin multilingual support supply. These should not be criticized as lagging, but rather seen as room to grow for properties that move to prepare ahead. Second, the visiting nationality is asymmetric by area: Fukuoka and Oita require Korean and Chinese; Nagano and Hiroshima require English. The priority languages to prepare differ. Focusing on the thickly demanded languages is the shortcut to raising evaluations with limited resources. Third, the regional onsen towns of Gifu, Gunma, and Tochigi have already achieved thick supply relative to demand by building out reception capability ahead for their own visitor mix. These are concrete roadmaps for follower areas as well.
Multilingual support is not a cost but an investment in differentiation. Areas where demand is observed yet supply is thin are precisely where moving now can build first-mover advantage. Reading the macro current of regional dispersion as a growth opportunity for one’s own area is what is required of the accommodation business going forward.
⚠ Note on data interpretation: The “inbound demand volume” and “English support supply” in this article are proxy indicators aggregated via NLP analysis of text left in guest reviews. Support that is not mentioned in reviews (cases where the property is actually multilingual-capable but is not written about in reviews) is not captured, so the actual level of support in each area may exceed the figures in this article. This is intended for trend identification and is not a definitive judgment of individual properties’ support status.
Related reading
- JNTO April 3.69 Million Arrivals at -5.5% — Even with China -56.8%, Regional ADR Rose; 9 Markets at Record Highs Show Structural Change in Inbound Demand
- Singapore Inbound Summer 2026 — One-Party 7-8 Night, High-Rate Condominium Demand Lifts Kyoto/Hokkaido/Okinawa ADR
- Has the China -58% Hole Been Filled by Non-China Inbound? — Re-examining April 2026 Accommodation Statistics and Regional ADR
- Tokyo Popular Hotels: Language-Based Review Score Gap Analysis — How Different Are Japanese and Inbound Guests’ Evaluation Axes
References and sources
- JNTO (Japan National Tourism Organization) “Inbound Arrivals (May 2026 Estimate)”
- Travel Voice “Inbound Arrivals Down 3.6% YoY in May 2026, 19 Markets at Record Highs” (June 17, 2026)
- Japan Hotel REIT Investment Corporation “Monthly Operations Status”
- Invincible Investment Corporation “Monthly Operations Status (April 2026)”
- HotelBank Editorial Team research (guest-review NLP analysis, foreign-language review counts and staff language-support tags, past 24 months)
- MetroEngines Research — OTA publicly listed price data (prefecture-level ADR and YoY)