

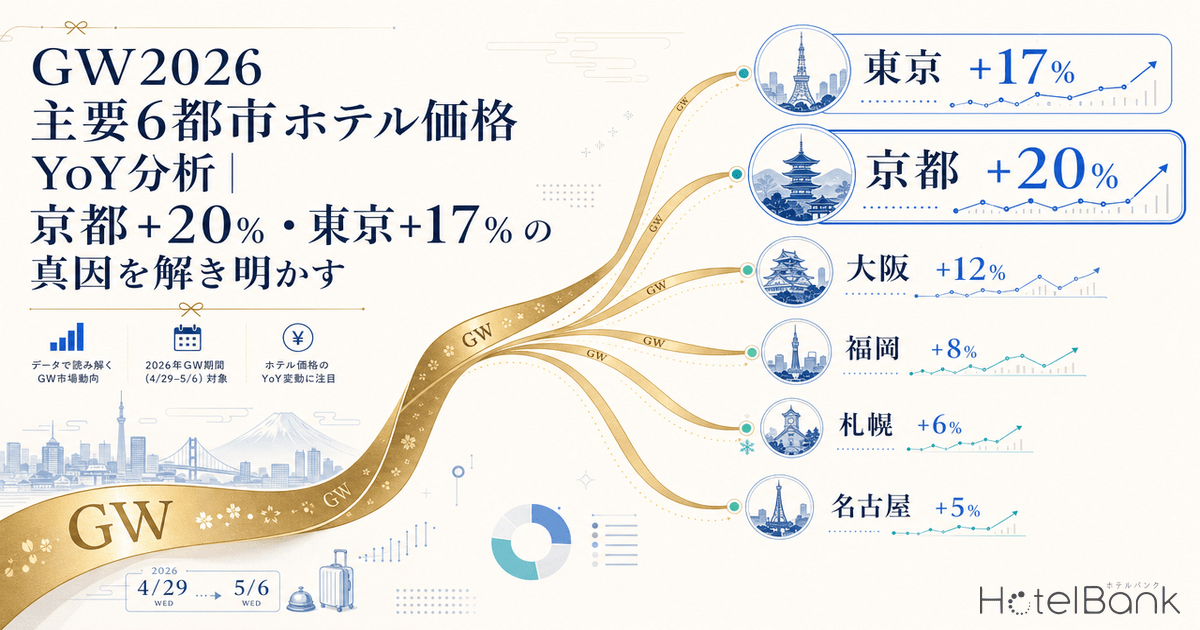

With Japan’s 2026 Golden Week (April 29 to May 6) approaching, hotel selling prices in the six major cities are showing significant changes compared to the same period last year. According to data aggregated from prices published on OTAs, monthly ADR (average selling price) for April and May rose sharply year-on-year in Kyoto by +18% to +20% and in Tokyo by +14% to +17%, while narrowing the focus to the GW dates themselves reveals stark differences between cities. This article interprets the actual data for the six cities through three lenses: inbound travel trends, domestic travel demand, and REIT operating performance.
Metric Definitions Used in This Article
- ADR (Average Daily Rate): The average of selling prices published on OTAs and similar sources. This differs from actual transaction prices. Per-room rate for double occupancy (tax included), averaged across all plans (room-only through meal-inclusive plans).
- Data source: MetroEngines Research
ADR and YoY for Six Cities During Golden Week
First, we look at the ADR for the six cities aggregated by check-in dates during the eight days of Golden Week proper (April 29 to May 6). The highest price was in Kyoto (¥48,900), followed by Okinawa (¥47,000) and Tokyo (¥41,300). On a year-on-year basis, Okinawa rose +13.3%, Hokkaido +9.7%, Fukuoka +9.2%, and Kyoto +7.1%, while Tokyo posted a more modest +4.0% and Osaka recorded a contrasting -11.3%.
Source: MetroEngines Research, compiled by HotelBank Editorial Team (N=5,683 thousand records, check-ins April 29 to May 6, 2026)
However, looking at monthly ADR for April and May rather than just the GW window, year-on-year increases were higher: Kyoto +18.6% (April) to +20.4% (May), Tokyo +17.4% to +14.2%, and Hokkaido +11.2% to +13.1%. This suggests that the special holiday demand of GW has weakened relative to demand expansion on regular days. In other words, the primary driver of ADR growth is a “year-round demand uplift” rather than holiday concentration.
| City | GW ADR (2026) | GW YoY | April YoY | May YoY | Sell-out Rate |
|---|---|---|---|---|---|
| Kyoto | ¥48,900 | +7.1% | +18.6% | +20.4% | 23.9% |
| Okinawa | ¥47,000 | +13.3% | +7.0% | +10.9% | 30.3% |
| Tokyo | ¥41,300 | +4.0% | +17.4% | +14.2% | 30.8% |
| Fukuoka | ¥38,800 | +9.2% | +5.2% | +6.4% | 27.9% |
| Hokkaido | ¥37,300 | +9.7% | +11.2% | +13.1% | 27.7% |
| Osaka | ¥31,000 | -11.3% | +8.4% | +12.5% | 29.1% |
Source: MetroEngines Research, compiled by HotelBank Editorial Team
Why Did Only Osaka Turn Negative During Golden Week?
Osaka, the only one of the six cities to record a year-on-year ADR decline during the GW window, has nevertheless shown +8% to +12% growth on a monthly basis. The reason for this divergence is believed to lie in the pricing tied to demand captured during Expo 2025 Osaka Kansai (大阪・関西万博), which was held during GW 2025. The 2025 GW fell immediately after the Expo opening, when hotel demand surged temporarily, lifting ADR. The 2026 GW reflects the rebound from that effect, leaving the year-on-year comparison for the GW window relatively low against the broader uptrend of +8% to +12%.
That said, Osaka\’s monthly ADR including weekdays remains positive year-on-year, just like the other cities. The “minus” for Osaka is therefore not a reversal of the price trend but an adjustment from the unwinding of special demand, and it should be distinguished from a structural slowdown in demand.
Monthly ADR Trends and Seasonality Across the Six Cities
Next, we review monthly ADR for the six cities from January 2024 through June 2026. All six cities show a steady upward trajectory, with the gains in Kyoto and Tokyo particularly pronounced. Kyoto rose from a peak of ¥39,474 in April 2024 to ¥50,277 in April 2026, reaching a level approximately +27% higher in two years.
Source: MetroEngines Research, compiled by HotelBank Editorial Team
The chart shows that in inbound-dependent cities such as Kyoto and Tokyo, ADR gains during winter (November to December) have become especially conspicuous. This indicates that what was traditionally the off-season is being smoothed out by the inflow of long-staying travelers from Europe, North America, and Australia. Hokkaido, by contrast, shows a clear rise from summer 2025 onward, exhibiting demand expansion in line with seasonal patterns.
Driver 1: Inbound Visitor Numbers Remain at Record Highs
The biggest driver of price increases is continuing strong inbound demand. According to the Japan National Tourism Organization (JNTO), the number of foreign visitors to Japan in February 2026 reached approximately 3.47 million, a record high for February, up +6.4% year-on-year. By market, 18 markets including South Korea, Taiwan, and the United States set February records, and the breadth of the inbound market is evident even after absorbing the shift of Lunar New Year (Spring Festival) from late January 2025 to mid-February 2026.
Note that January 2026 saw the visitor count fall -4.9% year-on-year, the first decline in four years, driven mainly by a sharp drop in arrivals from China. On the other hand, South Korea posted its first-ever single-month total above 1.1 million, underscoring the strength of other markets. In addition to the resilience of overall inbound volume, the growing diversification of source markets is supporting hotel demand across the six cities.
Driver 2: Domestic Travel Demand Edges Up, with Shorter and Closer Trips
According to estimates from the JTB Tourism Research and Consulting Co., total travelers during GW 2026 (April 25 to May 7) are projected at 24.47 million, +1.9% year-on-year, with total travel spending of ¥1.2876 trillion, +1.1%. Domestic travel accounts for 23.90 million (+1.7%), a slight gain, while overseas travel shows a notable +8.5% rise to 572,000.
The trend in average travel budgets warrants attention. The average planned budget for domestic trips is ¥46,000, down from the previous year, indicating a continuing shift toward closer destinations and shorter stays. Consumer sentiment is moving in the direction of “having room in disposable income” and “not cutting back on travel spending,” yet per-person expenditure is being held in check. This forms the baseline for domestic travel: “demand is steady, unit prices are slightly down.”
Despite this, ADR in the six cities continues to rise because the unit-price uplift from inbound demand and the stronger pricing strategies enabled by higher occupancy rates are outweighing the unit-price restraint of domestic demand.
Note on data source change: From this section onward, we use REIT monthly operating data (actual room-night transactions, i.e., transaction-based prices). These figures sit at a different level from the OTA published-price data (selling-price basis) used in the previous sections. Please focus on the YoY rate of change rather than direct comparison of absolute values.
Driver 3: REIT Operating Results Show Both Occupancy and Unit Price Rising
Beyond demand-side indicators, supply-side operating results also confirm the price uptrend. Looking at the February 2026 monthly operating results of three major REITs centered on urban hotels, occupancy, ADR, and RevPAR all maintained year-on-year gains.
Source: Compiled by HotelBank Editorial Team from each REIT\’s monthly operating data
Japan Hotel REIT Investment Corporation (8985) reported, as of February 2026, occupancy of 85.2% (+2.4 pt YoY), ADR of ¥19,449 (+3.1%), and RevPAR of ¥16,567 (+6.1%). Invincible Investment Corporation (8963) likewise sustained gains with occupancy of 86.6% (+2.0 pt), ADR of ¥13,473 (+0.9%), and RevPAR of ¥11,669 (+2.9%).
Meanwhile, Hoshino Resorts REIT Investment Corporation (星野リゾート・リート投資法人, 3287), centered on resort properties, posted occupancy of 76.5% (+1.9 pt), ADR of ¥20,771 (+8.6%), and RevPAR of ¥15,884 (+10.5%), with revenue expansion driven prominently by ADR. These data confirm that the ADR growth in the six cities is backed by a “high occupancy + rising unit price” two-engine pattern.
Source: Compiled by HotelBank Editorial Team from each REIT\’s monthly operating data
Driver 4: Slowing Supply and the Move into a “Selection Era”
On the supply side, the slowdown in new hotel openings is also significant. New hotel openings in 2026 are reported at approximately 36 properties nationwide, and although marquee projects continue—such as Imperial Hotel Kyoto Gion (帝国ホテル京都祇園), new openings in Naha, and resort-style properties in the Tokyo Bay area—the wave of large-scale development that drove the recovery phase has subsided.
Structurally, the Japan Tourism Agency has set a course of “making tourism a profitable industry,” with a clear shift in budget allocation toward “high value-add and labor-saving.” Funding for labor-shortage measures has been expanded sixfold year-on-year, and the budget for accessibility upgrades has surged thirteenfold. This policy direction is reinforcing a pivot away from rapid expansion of room supply and toward improving the value of existing facilities and optimizing occupancy.
In addition, the gap between Japanese domestic travel demand—still below 2019 levels—and inbound demand at all-time highs is propping up urban hotel occupancy and creating an environment that justifies bolder pricing. The industry is said to have moved beyond recovery into a “selection era,” where pricing power and guest experience value will increasingly differentiate winners from laggards.
Summary of Drivers by City
Qualitatively summarizing the ADR-growth drivers for each of the six cities along three axes—inbound, domestic demand, and supply constraints—yields the following.
| City | Inbound | Domestic | Supply Constraint | Key Driver |
|---|---|---|---|---|
| Kyoto | High | Mid | High | Long stays from Europe / North America / Australia + premiumization |
| Tokyo | High | Mid | Mid | Urban MICE + business demand |
| Okinawa | Mid | High | Mid | Long resort stays + new openings |
| Hokkaido | Mid | Mid | High | Seasonality + smoothing of winter demand |
| Fukuoka | Mid | High | Low | Stable business + Korean demand |
| Osaka | Mid | High | Low | Expo rebound + underlying uptrend continues |
Source: HotelBank Editorial Team\’s qualitative assessment (High: strong contribution, Mid: moderate, Low: limited)
Conclusion: 2026 GW Pricing Is a Way Station in a Structural Shift
GW 2026 ADR for the six cities ranged from +4% to +13% on a GW-window basis and +5% to +20% on a monthly basis, recording a wide spread of increases. The dominant drivers are “record-high inbound demand” and “a supply environment that allows operators to raise unit prices while maintaining occupancy,” and these are corroborated by REIT operating results.
Osaka\’s GW-window decline is a one-off effect from the unwinding of Expo-driven special demand; the underlying monthly trend remains positive in line with the other cities. Looking at the city-level driver mix, inbound-dependent Kyoto and Tokyo retain significant headroom for further unit-price gains, while Okinawa and Hokkaido—both with strong resort character—have room to grow long-stay demand. The lodging industry has entered a “selection era,” where pricing strategy and guest experience value will be tested more than ever.