

Japanese hotel investment has swung almost entirely in one direction for the past decade: toward the limited-service format, which carries no floor area other than guestrooms. Non-guestroom floor — banquet halls, wedding facilities, large production kitchens — earns less per square metre and is labour-intensive. Yet 2025 marriages came to 505,656 couples, up for a second consecutive year, and the first time in three years the count has cleared 500,000. The premise that “weddings are in permanent decline” at least needs updating. This report quantifies whether banquet floor should be converted into guestrooms, measuring returns per square metre of gross floor area, and solves for the break-even point in 41 prefectures.
Metric Definitions Used in This Article
- ADR (average daily rate): an estimated settled rate (tax-excluded equivalent), calculated by applying a category-specific adjustment coefficient to the lowest published plan level each property lists on OTAs and elsewhere (two guests per room, per-room price, tax included). Cross-checked against per-property results disclosed by listed hotel REITs, the median error is approximately 6.6%. These are estimates and differ from each property’s actual transacted prices and accounting figures. Area-level ADR is the median across the properties in scope (the level of a typical property in that area).
- OCC (occupancy): figures described in this article as “room occupancy” are published values from the Japan Tourism Agency’s Accommodation Survey. Where our own estimates are used, they are explicitly labelled as “the share of rooms sold against total room supply in the area (an estimate based on OTA sales inventory).”
- Gross floor area / room: total building floor area divided by the number of guestrooms. It includes not only guestroom areas but every floor inside the building — corridors, lobby, banquet halls, kitchens, plant rooms and so on.
- Data sources: MetroEngines Research & Consulting / Japan Tourism Agency “Accommodation Survey” / Ministry of Health, Labour and Welfare “Vital Statistics (preliminary)” / MLIT Real Estate Information Library
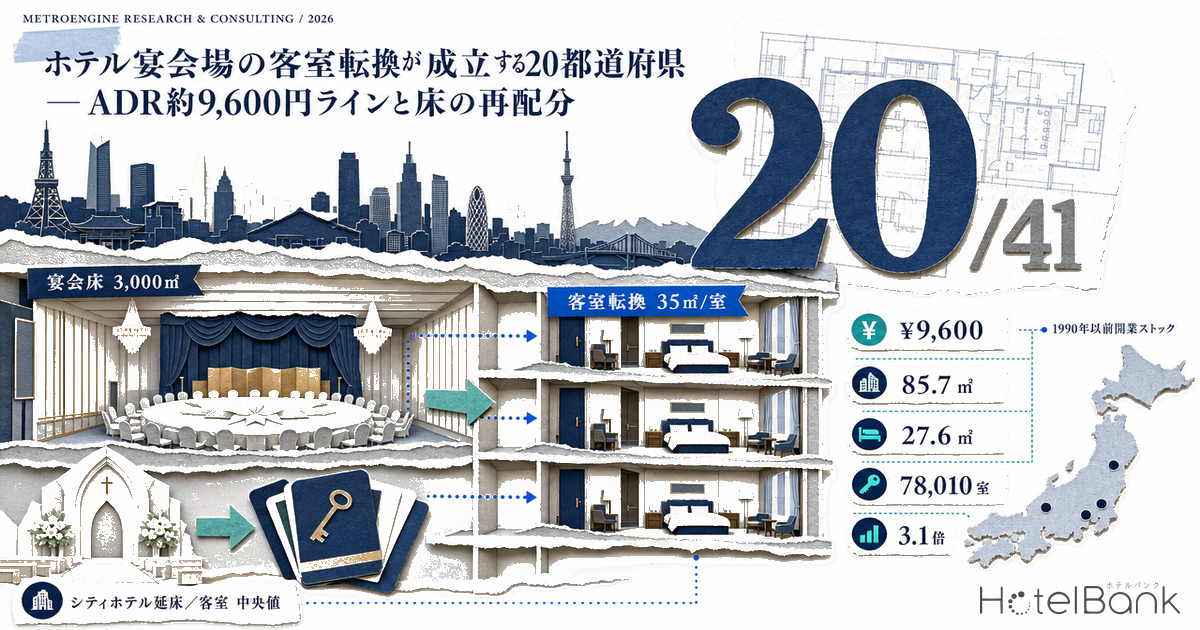
- — Conversion works in 20 of 41 prefectures. The dividing line is an estimated settled ADR of roughly ¥9,600. Below that, even banquet revenue of zero cannot repay construction at ¥2.15 million per tsubo at an 8% required yield.
- — The structural gap in floor area is 3.1x. City hotels run 85.7m² of gross floor area per room (N=188 properties); limited-service hotels 27.6m² (N=841 properties), both medians.
- — Room occupancy has already flipped. City hotels at 79.5% versus business hotels at 75.8% in 2019 reversed to 74.1% versus 75.3% for full-year 2025.
- — Partial conversion beats full conversion. On the model asset, converting only the 1,500m² grand ballroom returns 7.9% on capital, 1.1pt above the 6.8% of a full conversion.
- — Ageing stock and economics overlap. Of the 78,010 city hotel rooms opened in or before 1990, 74.5% sit in the 20 prefectures where conversion works.
505,656 marriages, up two years running — but only the count came back
According to the Ministry of Health, Labour and Welfare’s Vital Statistics (preliminary, December 2025), marriages in 2025 numbered 505,656, an increase of 5,657 (+1.1%) from the prior year. Because 2024 came in at 499,999, just short of 500,000, this is the first time in three years the figure has cleared that mark since 2022 (519,823). The increase is the second consecutive one, and statistically the bottom in marriage counts is clear.
The level itself, however, has not recovered. Against 615,652 in 2019 it is 17.9% lower, and against 650,519 a decade earlier in 2015 it is down 22.3%. In other words the decline has stopped; it has not reversed. For investment decisions on banquet floor, that distinction is decisive.
Dig one layer down and what matters for banquet floor is not the marriage count itself, but how many of those couples hold a reception and how much floor area each one needs. Recruit Bridal Souken’s “Marriage Market Survey 2025” (published 22 January 2026; married-couples module n=821, trends module n=817) puts the share holding a reception or wedding party at 43.1%, average total spend for couples holding both a ceremony and a reception at ¥2.986 million, and average guest count at 57.2.
Multiplying those three against the marriage count puts 2025 receptions at roughly 218,000 and the market at roughly ¥651.0 billion. Note that this survey covers a different population from the “Zexy Wedding Trend Survey” used through the 2024 edition, and the publisher explicitly states it does not compare with earlier years — so spend and guest counts cannot be read as a time series. What to take from it is the level, not the trajectory.
The number that matters as a level is the 57.2 guests. Fifty-seven people seated need roughly 200–250m² of function space. Floor designed around a grand ballroom seating 300 is plainly oversized against that demand. The same structure shows up in disclosures by listed full-service hotels. Imperial Hotel (9708) wrote in its FY March 2026 earnings release that on banquets, “although total attendance for general banquets declined, unit prices rose, improving profitability per event and increasing revenue. Weddings also increased revenue through efforts to win volume centred on small-scale weddings.” Headcount is down; revenue is being built on price and small-format events.
The development question, therefore, is not “keep or scrap the banquet floor.” It is a question of allocation: how much of the large box to cut, and how much of the mid-size box to keep.
Occupancy has already flipped — city 74.1%, business 75.3%
Before turning to floor area, it is worth establishing where the full-service room product itself stands. Room occupancy by accommodation type in the Japan Tourism Agency’s Accommodation Survey shows city hotels at 79.5% and business hotels at 75.8% in 2019, with city hotels 3.7pt ahead. That flipped in the pandemic year of 2020 and has not flipped back: for 2025 (final figures) city hotels are at 74.1% against business hotels at 75.3%, 1.2pt behind. In May 2026 (first preliminary) the gap persists, at 72.6% versus 74.1%.
This reversal is not uniform nationally. Taking the gap between city hotel and business hotel room occupancy across the 12 largest markets in the April 2026 prefecture-level data (second preliminary), only Kyoto is positive (+5.6pt). Osaka is −12.9pt, Hyogo −11.0pt, Tokyo −7.7pt and Kanagawa −7.1pt: the larger the metropolitan market, the wider the gap.
The meaning is plain. In the metropolitan markets, limited-service rooms fill better. Full-service hotels retain an edge in the room market only where the stay itself is the purpose of the trip, as in Kyoto. This is less a story about full-service rooms being unusually weak than about limited-service products maturing and gaining pricing power, narrowing the relative gap.
From an investor’s standpoint, the next question follows. If the relative advantage in the room market is thinning, what exactly is the “floor other than guestrooms” that full-service hotels carry actually earning?
The structure of floor area — 85.7m² per room at city hotels, 27.6m² at limited service
Across the hotels for which MetroEngines Research & Consulting can confirm gross floor area, we aggregated “gross floor area ÷ number of rooms.” City hotels come to a median of 85.7m² per room (N=188 properties), business hotels 27.6m² per room (N=841 properties). The gap is 3.1x.
A business hotel’s 27.6m² per room is the guestroom area itself (15–20m²) plus corridors, stairs, lifts and a small lobby — essentially the whole building is guestrooms.
Of a city hotel’s 85.7m² per room, even assuming 35m² per room is used as guestroom space, the remaining roughly 50m² per room is non-guestroom floor. At 200 rooms that is about 10,000m².
That non-guestroom floor covers banquet halls, restaurants, kitchens, back-of-house and large lobbies. Because gross floor area can include parking and tenant space, not all of it is banquet-related.
From here we can define a “floor-efficiency parity hurdle.” Operated at the same occupancy, the difference between the room revenue generated by one square metre of city hotel gross floor area and that generated by one square metre at a limited-service hotel is the amount the non-guestroom floor has to fill. Converting to revenue at a departmental gross operating margin of 70% for rooms and 25% for banquet and F&B (near the midpoint of the industry rule of thumb: 50–60% for limited service, 10–30% for full service), the required revenue works out as follows.
| Market | City ADR | Business ADR | City floor efficiency | Limited-service floor efficiency | Revenue required from non-guestroom floor | Wedding equivalent per 1,000m² |
|---|---|---|---|---|---|---|
| Kyoto | ¥23,908 | ¥14,046 | ¥75,452 | ¥139,872 | ¥180,375 | 60.4 couples |
| Osaka | ¥13,841 | ¥10,386 | ¥43,682 | ¥103,425 | ¥167,283 | 56.0 couples |
| Tokyo | ¥27,905 | ¥14,273 | ¥88,067 | ¥142,133 | ¥151,385 | 50.7 couples |
| Fukuoka | ¥17,887 | ¥10,880 | ¥56,450 | ¥108,345 | ¥145,304 | 48.7 couples |
| Miyagi | ¥9,483 | ¥7,524 | ¥29,928 | ¥74,925 | ¥125,992 | 42.2 couples |
| Hiroshima | ¥11,653 | ¥7,694 | ¥36,776 | ¥76,618 | ¥111,557 | 37.4 couples |
| Shizuoka | ¥13,608 | ¥7,050 | ¥42,946 | ¥70,205 | ¥76,325 | 25.6 couples |
| Nagasaki | ¥12,725 | ¥6,706 | ¥40,159 | ¥66,779 | ¥74,536 | 25.0 couples |
In Kyoto, 1,000m² of non-guestroom floor has to generate revenue equivalent to 60 weddings a year just to match limited-service floor efficiency. In Nagasaki, 25 will do. The same “1,000m² of banquet hall” faces a requirement that varies by a factor of 2.4 depending on the market.
Location analysis — divided by plot ratio, land cost per m² of floor differs 7.5x between Tokyo and Sendai
Reallocating floor is ultimately a question of how much land cost that floor is carrying. Taking the median published land price for commercial land in three markets from the MLIT Real Estate Information Library’s 2026 official land price survey, and dividing by the median designated plot ratio for the same set of points, gives land cost per square metre of gross floor area.
| Tokyo, Hibiya–Ginza | ¥11,700,000/m² |
| Plot ratio 700% → cost per m² of GFA | ¥1,671,000/m² |
| Nagoya, Meieki | ¥2,275,000/m² |
| Plot ratio 700% → cost per m² of GFA | ¥325,000/m² |
| Sendai, Aoba | ¥1,115,000/m² |
| Plot ratio 500% → cost per m² of GFA | ¥223,000/m² |
| Market | 85.7m² format | 27.6m² format |
|---|---|---|
| Tokyo | ¥143.2m | ¥46.1m |
| Nagoya | ¥27.9m | ¥9.0m |
| Sendai | ¥19.1m | ¥6.2m |
Holding an 85.7m² per room floor configuration on commercial land in Tokyo means each guestroom carries land cost of roughly ¥143 million. On the same land, a limited-service configuration carries roughly ¥46 million. In Sendai the figures are ¥19.1 million and ¥6.2 million, an absolute gap of only ¥12.9 million. The impact of the floor configuration choice on required investment scales with land prices, so it is largest in central urban locations. All three sites are in commercial zones with an 80% building coverage ratio and fire-prevention district designation, and no regulatory factor obstructing retention of banquet floor is identified. The constraint is economic, not regulatory.
The break-even point — an estimated settled ADR of about ¥9,600, clearing in 20 of 41 prefectures
The next step is to put these numbers into the form of an actual investment decision: whether the room-department gross operating profit gained by converting banquet-related floor into guestrooms exceeds the banquet-department gross profit lost plus the required return (8%) on the capital committed to the conversion works. Converted rooms are assumed at 35m² per room (gross) and construction cost at ¥2.15 million per tsubo.
■ Modelling assumptions
- Construction cost (stage 1, based on 2025 actuals): ¥2.00 million per tsubo. Based on MLIT’s “Construction Statistics Survey (Building Starts Statistics)”, 2025 hotel construction cost averaged ¥1.952 million per tsubo across all structures (steel ¥2.405 million, reinforced concrete ¥2.026 million). Banquet halls are column-free large spaces whose floor-to-floor height, floor loading and plumbing shaft layout differ from guestroom specification; even reusing the frame, services are effectively new-build, so new-build unit costs were adopted.
- Construction cost (stage 2, inflation over the build period): ¥2.15 million per tsubo. Design and construction are assumed to take two years, compounded at +5% a year to the midpoint (Turner & Townsend forecasts construction cost inflation of +5.3% in 2026 and +5.0% in 2027). The estimates below use this ¥2.15 million figure.
- Departmental gross operating margin: rooms 70%, banquet and F&B 25%. A conservative setting informed by the industry rule of thumb of 50–60% for limited service and 10–30% for city hotels (Relo Hotel Solutions) and the 38.9% GOP disclosed by Invincible Investment Corporation across 91 operated properties (FY December 2024).
- Room occupancy: 74.1% (Japan Tourism Agency 2025 final figures, city hotels nationwide). Required yield: 8%.
On these terms we solved, prefecture by prefecture, for how much banquet-related floor must earn annually before “not converting” becomes the better outcome. The higher the value, the higher the bar imposed on banquet floor — that is, the more favourable conversion is. A negative value means conversion fails to reach the required yield even if banquet floor revenue is zero.
Conversion clears the hurdle in 20 of the 41 prefectures. Tokyo (¥395,486/m²) and Kyoto (¥309,002/m²) stand well clear of the rest, at wedding-equivalent levels of 132 and 104 couples per 1,000m² per year. Those are figures you could not reach even by filling every weekend with weddings, and the natural reading is that in these two markets most banquet floor is a candidate for conversion. Okinawa (68.0 couples) and Fukuoka (59.9 couples) follow.
Conversely, in the 21 prefectures from Miyagi downward the break-even point is negative. Translated into estimated settled ADR, roughly ¥9,600 is the dividing line: in markets where the 12-month average ADR for city hotels sits below it, converting banquet floor to guestrooms cannot repay construction at ¥2.15 million per tsubo at 8%. The question to debate in these markets is not “keep the banquet floor or not” but whether to invest in large-scale reconfiguration of floor at all.
What matters most is this: of the 78,010 city hotel rooms opened in or before 1990, 74.5% — 58,107 rooms — sit in the 20 prefectures where conversion works. Ageing stock and markets with conversion economics overlap to a considerable degree.
Development scenarios — “drop only the large box” beats a full conversion
With the break-even established, we apply it to an actual asset. As a model asset for a mid-sized regional city, we posit a city hotel with 200 rooms, 17,140m² of gross floor area (85.7m² per room) and 3,000m² of banquet-related floor, assuming an estimated settled ADR of ¥12,787 (the 12-month average level in Aichi) and room occupancy of 74.1% (Japan Tourism Agency “Accommodation Survey”, final figures for January–December 2025, city hotels nationwide). RevPAR is ¥9,475.
The 3,000m² of banquet floor is split into a grand ballroom zone of 1,500m² (annual revenue of ¥70,000/m², equivalent to 23.4 weddings) and a mid-and-small function zone of 1,500m² (¥130,000/m²). The large box only turns over on weekend weddings and a handful of large banquets a year, while the smaller rooms also move on weekdays with corporate meetings, small weddings and private dining — a structure commonly seen in practice.
| Item | A. Convert all 3,000m² to guestrooms | B. Convert only the 1,500m² grand ballroom Recommended | C. Retain banquet floor, refurbish interiors |
|---|---|---|---|
| Floor area converted | 3,000m² | 1,500m² | 0m² (3,000m² refurbished) |
| Rooms added | 86 rooms (286 total) | 43 rooms (243 total) | — |
| Incremental room revenue | ¥296m / year | ¥148m / year | — |
| Incremental room GOP (70%) | ¥207.5m | ¥103.8m | — |
| Banquet GOP forgone (25%) | −¥75.0m | −¥26.2m | — |
| GOP gain from higher banquet unit prices | — | — | +¥18.8m (assuming +25% revenue) |
| Net GOP gain | ¥132.5m | ¥77.5m | ¥18.8m |
| Investment (¥2.15m/tsubo; ¥0.80m/tsubo for refurbishment) | ¥1,951.0m | ¥975.6m | ¥726.0m |
| Return on capital | 6.8% | 7.9% | 2.6% |
| Simple payback period | 14.7 years | 12.6 years | 38.7 years |
Partial conversion (B) yields more than full conversion (A). The reason is simple: A also demolishes the mid-and-small function rooms that are earning. The numbers show that reallocating floor is not a question of total volume but of whether you can identify the low-utilisation zones.
Scenario C, retaining banquet floor and refurbishing interiors, returns only 2.6% on capital even with banquet revenue lifted 25%. Because the banquet and F&B gross margin is structurally low, moving unit prices alone struggles to justify the capital committed. Reinvestment in banquet floor works when it is paired not with price increases but with more operating days — building weekday demand from corporate MICE, civic ceremonies, corporate training and retail events beyond weddings. There is clear headroom here.
| Case | Net GOP gain | Investment | Return on capital | Payback period |
|---|---|---|---|---|
| Base case | ¥77.5m | ¥975.6m | 7.9% | 12.6 years |
| ADR +10% | ¥87.9m | ¥975.6m | 9.0% | 11.1 years |
| ADR −10% | ¥67.1m | ¥975.6m | 6.9% | 14.5 years |
| Room occupancy −5pt | ¥70.5m | ¥975.6m | 7.2% | 13.8 years |
| Construction cost +15% | ¥77.5m | ¥1,121.9m | 6.9% | 14.5 years |
| Banquet revenue +30% (large box recovers) | ¥69.6m | ¥975.6m | 7.1% | 14.0 years |
| ADR −10% and occupancy −5pt | ¥60.8m | ¥975.6m | 6.2% | 16.0 years |
| Estimated settled ADR \ Room occupancy | 64.1% | 69.1% | 74.1% | 79.1% | 84.1% |
|---|---|---|---|---|---|
| ¥11,508 | 5.6% | 6.2% | 6.9% | 7.5% | 8.2% |
| ¥12,148 | 6.0% | 6.7% | 7.4% | 8.1% | 8.8% |
| ¥12,787 (Aichi level) | 6.5% | 7.2% | 7.9% (base) | 8.7% | 9.4% |
| ¥13,426 | 7.0% | 7.7% | 8.5% | 9.2% | 10.0% |
| ¥14,066 | 7.4% | 8.2% | 9.0% | 9.8% | 10.6% |
Source: MetroEngines Research & Consulting. For Scenario B (converting the 1,500m² grand ballroom into the equivalent of 42.9 post-conversion rooms at 35m² each, construction at ¥2.15 million per tsubo, investment of ¥975.6m), return on capital is the net gain — incremental room GOP (70% margin) less banquet GOP forgone (1,500m² × ¥70,000/m² per year × 25% margin = ¥26.25m) — divided by the investment. Green denotes 8% or above, the required yield; the shaded cell is the base case used in the text (estimated settled ADR ¥12,787, room occupancy 74.1%, Japan Tourism Agency final figures for January–December 2025). A simplified estimate that does not consider correlations between factors.
On sensitivity, the variable that moves this project most is ADR. A ±10% swing takes return on capital to a range of 6.9–9.0%. Because a 10% ADR decline (−1.0pt) bites at least as hard as a 15% construction cost increase (−1.0pt), the conversion decision starts with testing in the market what rate the converted rooms can actually command. Conversely, a 30% recovery in banquet revenue still leaves a 7.1% return, only 0.8pt below the base case. Even if the recovery in marriages continues, at this asset scale it is unlikely to reverse the conversion conclusion.
Where the stock is — 78,010 rooms opened in or before 1990, 58% with a renovation record
Japan has 1,174 city hotels with 203,151 rooms (within our coverage, excluding closed and suspended properties). Of these, 465 properties and 78,010 rooms opened in or before 1990, accounting for 38.4% of rooms. That cohort is now 36 years old or more, and major repairs and equipment replacement fall due in sequence.
Cohorts that opened in the 1980s or earlier show high renovation-record rates of 54–65%, whereas the 1990s cohort sits at just 38.2%. The 48,390 rooms built in the 1990s are now 26 to 36 years old and reaching their first major renewal cycle, yet the share for which a renewal history can be established is lower than for the generations on either side. The greatest scope for reconsidering the allocation of floor is in this 1990s cohort. Picking up the properties whose good locations are held back by dated guestrooms is a related question that turns on identifying renovation candidates from guest review data.
The supply side is also worth noting. New city hotel rooms fell 65% from a peak of 13,791 in 2017 to 4,809 in 2025. Business hotels fell 62% as well, from 64,272 in 2018 to 24,222, so the decline is not specific to the full-service format. What deserves more attention is that because new supply is thinning across the board, the scarcity value of existing banquet floor as “large-volume space with no substitute in the local market” may rise over time. Almost no operator is building a new mid-size or larger banquet hall in a regional city. Deciding to convert is also deciding to give up that scarcity. The reasons behind thinning new supply are tracked year by year in Construction +41% & Labor Crunch Erase Japan’s 2027-2029 Hotel Supply.
What listed REIT monthly results say about full-service versus limited-service today
Differences in floor configuration also show up in the monthly disclosures of listed hotel REITs. Lining up the figures published for June 2026 gives the following.
| Investment corporation | Disclosure scope | Occupancy | ADR | RevPAR | RevPAR YoY |
|---|---|---|---|---|---|
| Japan Hotel REIT Investment Corporation | 29 hotels with variable rent and similar structures | 81.2% | ¥18,509 | ¥15,023 | +1.7% |
| Hoshino Resorts REIT, Inc. | Entire portfolio | 74.2% | ¥18,478 | ¥13,716 | −6.4% |
| Invincible Investment Corporation | 103 domestic hotels | 82.2% | ¥12,306 | ¥10,118 | −6.0% |
| Ichigo Hotel REIT Investment Corporation | 24 hotels combined (excluding 2 closed for renovation) | 80.6% | ¥8,872 | ¥7,147 | −9.6% |
Japan Hotel REIT, which includes full-service properties, grew RevPAR +1.7% year on year with occupancy of 81.2% (June 2026) and ADR of ¥18,509. Invincible, centred on limited-service properties, posted high occupancy of 82.2% (June 2026) but ADR down 5.0% year on year, taking RevPAR to −6.0%. Limited-service leads on occupancy, full-service on rate — the same pattern holds here. That said, scope differs by company (property count, operating structure, regional mix), so these four rows cannot be read as a ranking between formats. They are a reference point for where the market stands.
The implication for investors is that as long as the full-service room department can compete on rate, the decision to replace banquet floor with guestrooms comes down to whether you can add rooms that command a rate. That lands on the same conclusion as the sensitivity analysis in the previous section, where ADR mattered most.
Investment summary — think in three bands
Band 1 — Conversion favoured (4 markets)
Tokyo, Kyoto, Okinawa, Fukuoka
Break-even points of ¥178,725–¥395,486/m². In wedding-equivalent terms, 60–132 couples a year per 1,000m² would be required — a level essentially unreachable in practice. There is substantial scope to treat converting banquet floor into guestrooms as the first option alongside refurbishment plans for ageing stock. Designing in retention of some mid-size and small function rooms keeps private dining and small-wedding demand from in-house guests intact.
Band 2 — Decided on the merits (16 markets)
Kanagawa, Hokkaido, Osaka, Shizuoka, Shiga, Hyogo, Aichi and others
Break-even points of ¥5,908–¥125,237/m². The wedding equivalent ranges from 2 to 42 couples a year, so the actual performance of the banquet floor can flip the conclusion. Measure revenue and operating days zone by zone; this band has the largest design scope for a “drop only the large box” partial conversion. In the model estimate, partial conversion beat full conversion by 1.1pt.
Band 3 — Conversion does not clear (21 markets)
Miyagi, Saitama, Gunma, Akita and others
Estimated settled ADR sits below roughly ¥9,600, so even with zero banquet revenue, construction at ¥2.15 million per tsubo cannot be repaid at 8%. The options here are not large-scale conversion but operating the existing banquet floor for more days a year, and raising room rates themselves. Once rates clear ¥9,600, conversion is worth revisiting.
| Risk factor | Detail | Sensitivity |
|---|---|---|
| Market risk (ADR) | Whether converted rooms can command the assumed rate. A ±10% swing moves return on capital across 6.9–9.0% | High |
| Construction risk | Banquet halls differ from guestroom specification in floor-to-floor height, floor loading and shaft layout, so new plumbing and HVAC costs readily exceed assumptions. A 15% construction cost increase costs 1.0pt of yield | High |
| Demand risk (banquet side) | Marriages have risen two years running. But even a 30% rise in banquet revenue costs only 0.8pt of yield, so it is unlikely to reverse the conclusion | Medium |
| Regulatory risk | All three markets are commercial zones with 80% building coverage and fire-prevention designation. No zoning constraint is identified. Existing-nonconforming status, escape routes and smoke extraction may nonetheless need review | Low |
| Loss of scarcity | Almost no new mid-size or larger banquet halls are being built in regional cities. Once lost, substitutes are hard to find within the local market | Medium |
Three things are needed as next steps in practice. First, break the banquet floor down by zone (grand ballroom / mid-size function rooms / small function rooms and meeting rooms) and measure annual revenue and operating days for each. A whole-property banquet revenue figure cannot distinguish the zones to cut from the zones to keep. Second, verify what rate the converted rooms can command in the market, benchmarked against same-grade properties in the same catchment. Third, confirm conversion feasibility at schematic design level for floor-to-floor height, floor loading, shaft positions and escape routes.
Conclusion
Marriages in 2025 rose for a second consecutive year to 505,656, clearing 500,000 for the first time in three years. The premise that “weddings are in permanent decline” is no longer accurate. At the same time the figure is 17.9% below 2019, and guest counts have shrunk to an average of 57.2. The count has bottomed, but the floor area each couple needs has fallen — that is the real position banquet floor finds itself in.
Measuring the economics of floor, city hotels carry 85.7m² of gross floor area per room against 27.6m² for limited service (medians), a gap of 3.1x. The revenue non-guestroom floor must earn to close that gap ranges from ¥180,375/m² a year in Kyoto to ¥74,536/m² in Nagasaki, a spread of 2.4x across markets. Setting conversion works at ¥2.15 million per tsubo and the required yield at 8%, conversion clears in the 20 prefectures where estimated settled ADR exceeds roughly ¥9,600 — and 74.5% of the 78,010 city hotel rooms opened in or before 1990 are located there.
What the model asset showed, however, is that partial conversion works better than full conversion. Demolishing the mid-size and small function rooms that are earning costs 1.1pt of yield. Reallocating floor is not a decision to abandon banquet space; it is the work of identifying, zone by zone, the large volumes that are under-utilised. That begins with measuring revenue and operating days by zone rather than for the property as a whole. The recovery in marriages has, if anything, bought a little time to get that work started.
Related Reading
- Corporate Retreat Conversions: 8.27% GOP Yield Across 5 Onsen Areas
- Hotels at Year 10: The Renovation Gap Is +13.6% Below 100 Rooms
- Old Malls and Warehouses as Next Hotel Rooms: Conversion Investment Boundaries
- Hotel Category Mix Explains Half of City ADR: 34 Municipalities
- Kanagawa ADR Splits: City Hotels +20.9%, Business −1.7% in June 2026
- New Hotel ADR Ramp-Up: 91 Japan Openings Split Into 4 Pricing Types
- Construction +41% & Labor Crunch Erase Japan’s 2027-2029 Hotel Supply
- Policy Rate 1.00%: Break-Even ADR Across Japan’s 8 Hotel Markets
References and Sources
■ Data sources
Estimated settled ADR is the 12-month average across 47 prefectures × category (city hotels / business hotels) × month (August 2025 – July 2026, our aggregation). Scope is the 41 prefectures where the monthly median count of city hotels is 10 or more. Gross floor area per room is the median for city hotels N=188 and business hotels N=841 (20 rooms or more, GFA per room within a 10–300m² range). Room stock covers 1,174 city hotels and 203,151 rooms in Japan (excluding closed and suspended properties). Room occupancy is from the Japan Tourism Agency “Accommodation Survey”; marriage counts from the Ministry of Health, Labour and Welfare “Vital Statistics (preliminary)”; land prices, plot ratios and zoning from the MLIT Real Estate Information Library (official land prices 2026); construction unit costs from MLIT “Construction Statistics Survey”; REIT results from the June 2026 monthly operating status materials published by each investment corporation.
■ Modelling assumptions
Converted rooms at 35m² per room (gross); construction at ¥2.15 million per tsubo (the 2025 all-structure average of ¥1.952 million per tsubo, uplifted for construction cost inflation of +5% a year to the midpoint of a two-year design and construction period); departmental gross operating margins of 70% for rooms and 25% for banquet and F&B; room occupancy of 74.1% (Japan Tourism Agency final figures for January–December 2025, city hotels nationwide); required yield of 8%. The break-even point was solved prefecture by prefecture as the amount (¥ / m²) below which “if annual banquet floor revenue falls under this level, conversion to guestrooms is the better option.” Negative values indicate the required yield is not reached even with zero banquet revenue. The development scenarios use a model asset of 200 rooms, 17,140m² of gross floor area and 3,000m² of banquet-related floor (grand ballroom 1,500m² at ¥70,000/m² a year; mid-and-small function rooms 1,500m² at ¥130,000/m² a year).
■ Limitations and caveats
The break-even points and development scenarios in this article are simplified estimates based on public data and industry-standard assumptions. An actual investment decision requires a detailed feasibility study covering the target asset’s structural conditions (floor-to-floor height, floor loading, shaft positions, escape routes), any existing-nonconforming status, departmental actual profit and loss, and detailed competitive analysis of the catchment. “City hotel” is also a category classification; we have not individually verified that each property holds banquet facilities. Gross floor area may include parking and tenant space, so not all non-guestroom floor is banquet-related. Estimated settled ADR is an estimate and differs from each property’s actual transacted prices and accounting figures. The sensitivity analyses are simplified estimates varying single factors and two axes, and do not consider correlations between factors. The four REIT rows use different disclosure scopes by company (property count, operating structure, regional mix) and do not indicate any ranking between formats.
■ Market data
- MetroEngines Research & Consulting — estimated settled ADR (47 prefectures × category × month, August 2025 – July 2026), gross floor area per room (city hotels N=188, business hotels N=841), city hotel room stock (1,174 properties and 203,151 rooms in Japan), new rooms opened (based on confirmed OTA listings)
■ Government statistics and public data
- Ministry of Health, Labour and Welfare, “Vital Statistics (preliminary), December 2025” (published 26 February 2026)
- Japan Tourism Agency, “Accommodation Survey (April 2026 second preliminary, May 2026 first preliminary, and 2025 annual final figures)”
- Japan Tourism Agency, “Accommodation Survey” (room occupancy by accommodation type, time series)
- MLIT Real Estate Information Library — official land prices (2026), zoning, fire-prevention districts, station passenger counts
- MLIT, “Construction Statistics Survey (Building Starts Statistics)” — hotel construction cost per tsubo by structure
■ REIT and listed company disclosures
- Japan Hotel REIT Investment Corporation, monthly operating status (June 2026)
- Hoshino Resorts REIT, Inc., monthly operating status (June 2026)
- Invincible Investment Corporation, monthly operating status (June 2026)
- Ichigo Hotel REIT Investment Corporation, monthly operating status (June 2026)
- Imperial Hotel, Ltd., “FY March 2026 Financial Results (Japanese GAAP, consolidated)” (14 May 2026)
■ Industry research