

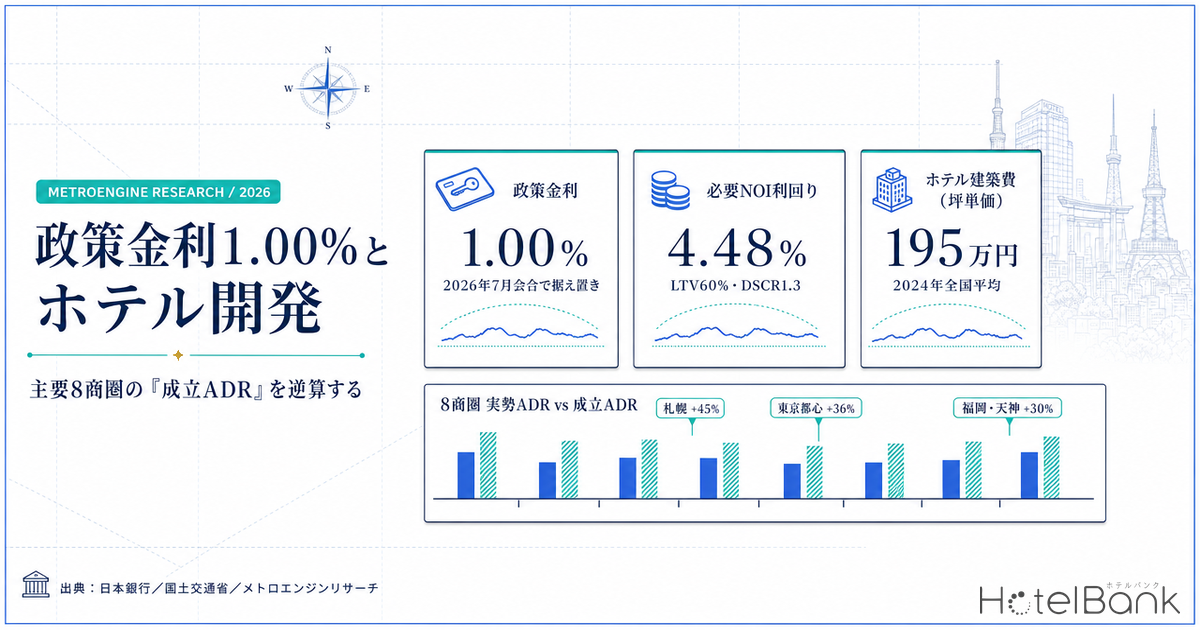
At its Monetary Policy Meeting on July 30–31, 2026, the Bank of Japan left the policy rate (the target for the uncollateralized overnight call rate) unchanged at around 1.00%. The 1.00% level itself was set at the June 15–16 meeting, when the rate was raised from 0.75% by a vote of 7 to 1. Now that a world with interest rates has settled in, hotel development and acquisition are back to answering one question in hard numbers: what ADR does a project need to clear? This article works backward from the financing-side constraints — borrowing rate, LTV and DSCR — to the required NOI yield, then multiplies through room count, occupancy and GOP margin to derive the “break-even ADR.” It then takes eight major submarkets across Japan, compares published land prices against estimated settled ADR, and quantifies which submarkets already clear the line today and how much rate growth the others still need.
Metric Definitions Used in This Article
- ADR (average daily rate): an estimated settled rate (tax-exclusive equivalent), calculated by applying category-specific adjustment coefficients to the lowest publicly listed plan level each property posts on OTAs and similar channels (double occupancy, per-room rate, tax-inclusive). Cross-checked against property-level results disclosed by listed hotel REITs (Invincible Investment Corporation, 184 property-months, April–May 2026), the median error is approximately 7.5%. These are estimates and differ from each property’s actual transacted prices and accounting figures. Area-level ADR is the median across the properties in scope (the level of a standard property in that area).
- NOI (net operating income): GOP (gross operating profit) less the FF&E (furniture, fixtures and equipment) reserve. In this article it is treated as a pre-depreciation, pre-interest figure.
- DSCR: NOI ÷ annual debt service. LTV: loan amount ÷ total project cost.
- Data sources: MetroEngines Research & Consulting / MLIT Real Estate Information Library / e-Stat “Statistics on Building Construction Starts” / Bank of Japan
- — The required NOI yield is 4.48% (borrowing rate 3.00%, LTV 60%, DSCR 1.3x). Even when the rate moves 1.75 points, from 2.25% to 4.00%, the required yield widens by only 0.88 points.
- — Four of the eight major submarkets (Sapporo Odori–Susukino, Fukuoka Tenjin, Fukuoka Hakata Station, Osaka Shinsaibashi–Hommachi) clear the line at today’s prevailing rates even on submarket-standard land prices. Sapporo runs 45% above its break-even line.
- — Central Tokyo needs a 36% rate increase. On a bottom-quartile land price, however, the break-even ADR falls from ¥23,600 to ¥15,800 and the prevailing ¥17,300 carries a 10% cushion.
- — Construction cost moves from ¥1.950 million per tsubo (2024 actual) to ¥2.379 million (assumed 2028 build). That lifts project cost, but it also suppresses new entry and tightens medium-term supply and demand.
- — A 3-point gain in occupancy cuts the break-even ADR by about ¥300; a 3-point gain in GOP margin cuts it by ¥700–900. Site selection and operating quality drive feasibility more than the interest rate does.
Conclusion — Sapporo and Fukuoka clear at today’s rates; in central Tokyo, site selection decides the outcome
The conclusion first. Assuming a newly developed 100-room limited-service hotel and standard terms of a 3.00% borrowing rate, 60% LTV and 1.3x DSCR, the required NOI yield is 4.48%. Setting the “break-even ADR” implied by land and construction cost at that yield against each submarket’s prevailing estimated settled ADR, four submarkets are already in feasible territory at today’s rates: Sapporo Odori–Susukino (prevailing rate 45% above the break-even line), Fukuoka Tenjin (30%), Fukuoka Hakata Station (26%) and Osaka Shinsaibashi–Hommachi (18%).
Nagoya Meieki, Nagoya Sakae and Osaka Umeda, by contrast, sit almost exactly on the line — a few more percent of rate growth and the arithmetic works. Central Tokyo (the Marunouchi, Ginza and Nihonbashi area) comes out at a break-even ADR of roughly ¥23,600 if land is acquired at the submarket median price, against a prevailing rate of about ¥17,300 — a required upside of 36%. That, however, assumes the submarket’s standard land price. Within the same submarket, a site at the bottom-quartile level (about ¥4.61 million per square meter) brings the break-even ADR down to roughly ¥15,800, putting the prevailing rate 10% above the line. In central Tokyo, “choosing the site within the submarket” matters more to feasibility than “choosing the submarket.”
Financing assumptions — across three reference-rate cases, the required NOI yield runs from 4.11% to 4.99%
Start by quantifying the financing-side constraint. Per the Bank of Japan, the short-term prime rate at major banks (modal value) has been 2.125% since February 9, 2026, and the long-term prime rate is 3.15% as of the June 10, 2026 revision. Non-recourse loans for hotel development and acquisition add a spread over these reference rates, sized to sponsor credit and asset risk. Three cases are used here.
| Case | Reference rate | Spread | Applied rate | Loan constant (25-year amortizing) |
|---|---|---|---|---|
| A. Floating, linked to short-term market rates | Uncollateralized overnight call 1.00% | +1.25% | 2.25% | 5.27% |
| B. Linked to short-term prime | Short-term prime 2.125% | +0.875% | 3.00% | 5.74% |
| C. Long-term fixed | Long-term prime 3.15% | +0.85% | 4.00% | 6.40% |
The required NOI yield is given by DSCR × loan constant × LTV. At 1.3x DSCR and 60% LTV, that is 4.11% in Case A, 4.48% in Case B and 4.99% in Case C. Even when the rate moves 1.75 points, from 2.25% to 4.00%, the required NOI yield widens by only 0.88 points. Raising LTV from 60% to 70% lifts the required NOI yield by roughly 0.7 points at the same DSCR. The obvious structure — the more leverage applied, the more earning power the asset must deliver — shows up cleanly in the numbers.
| Borrowing rate | LTV 60%, DSCR 1.3 | LTV 70%, DSCR 1.3 | LTV 60%, DSCR 1.5 | LTV 70%, DSCR 1.5 |
|---|---|---|---|---|
| A. 2.25% | 4.11% | 4.80% | 4.75% | 5.54% |
| B. 3.00% Base case | 4.48% | 5.23% | 5.17% | 6.03% |
| C. 4.00% | 4.99% | 5.83% | 5.76% | 6.72% |
Construction cost — ¥1.95m per tsubo in 2024, and ¥2.38m if the build lands in 2028
Next, the project-cost side. Taking accommodation-use buildings from e-Stat’s “Statistics on Building Construction Starts” and dividing planned construction cost by floor area gives a 2024 national average of ¥1.950 million per tsubo. That is up 40% in two years from ¥1.390 million in 2022. Construction starts numbered 2,836 buildings in 2024 across roughly 1.76 million square meters of floor area, a sharp recovery from 2023 (2,222 buildings, roughly 900,000 square meters).
Because development projects take several years from groundbreaking to opening, using the actual figure as-is would miss cost escalation during the build. Here we assume a 2029 opening (construction 2027–2029, cost midpoint in 2028) and compound in construction-cost inflation of +5.6% in 2025, +5.3% in 2026, +5.0% in 2027 and +4.5% in 2028. That is +22.0% versus 2024, giving ¥2.379 million per tsubo.
Rising construction cost is a burden on the business plan and, at the same time, a brake on new supply. Seen from the existing stock, a higher cost of entry translates into tighter medium-term supply and demand — an upside factor. That supply-side spillover is mapped against scheduled openings in Construction +41% & Labor Crunch Erase Japan’s 2027-2029 Hotel Supply.
Two business models — break-even ADR formulas for a 100-room limited-service and a 200-room full-service hotel
Once project cost and required NOI yield are fixed, the break-even ADR follows uniquely. Two models with different formats are used here. The occupancy assumptions reference recent operating results published by listed hotel REITs: Invincible Investment Corporation’s 101 domestic hotels ran 82.7% occupancy in June 2026; Japan Hotel REIT Investment Corporation’s 29 hotels under variable-rent and similar structures ran 81.2%; Ichigo Hotel REIT Investment Corporation’s total portfolio ran 80.6%. On that basis, 82% is applied to the limited-service model and 80% to the full-service model.
| Assumption | Model A: 100-room limited-service | Model B: 200-room full-service |
|---|---|---|
| Occupancy (OCC) | 82% | 80% |
| Rooms revenue as a share of total revenue | 92% | 72% |
| GOP margin (of total revenue) | 42% | 30% |
| FF&E reserve (of total revenue) | 3% | 4% |
| Gross floor area per room | 30 m² | 55 m² |
| Assumed floor-area ratio | 600% | 600% |
| Construction cost (¥2.38m/tsubo) | ¥21.59m per room | ¥39.58m per room |
| NOI coefficient | ADR × 126.9 (¥ per room-year) | ADR × 105.4 (¥ per room-year) |
In Model A, at a project cost of ¥30 million per room, the required ADR swings from ¥9,700 to ¥15,900 depending on financing terms — ¥9,700 in rate Case A at 60% LTV and 1.3x DSCR, ¥15,900 in rate Case C at 70% LTV and 1.5x DSCR. In other words, for the identical asset, how the financing is structured alone moves the break-even ADR by a factor of 1.6.
| Borrowing terms | LTV 60%, DSCR 1.3 | LTV 70%, DSCR 1.3 | LTV 60%, DSCR 1.5 | LTV 70%, DSCR 1.5 |
|---|---|---|---|---|
| A. 2.25% | ¥9,700 | ¥11,300 | ¥11,200 | ¥13,100 |
| B. 3.00% | ¥10,600 | ¥12,400 | ¥12,200 | ¥14,300 |
| C. 4.00% | ¥11,800 | ¥13,800 | ¥13,600 | ¥15,900 |
Operating variables matter too. At the same ¥30 million per room and rate Case B, setting full-year occupancy at 75% puts the required ADR at ¥11,600; at 85% it is ¥10,200 and at 88% it is ¥9,900. At a 36% GOP margin it is ¥12,500; at 48% it is ¥9,200. Adding 3 points of occupancy and improving the GOP margin by 3 points therefore lower the break-even ADR by ¥300 and ¥900 respectively. Revenue management and operating efficiency are powerful levers for lifting feasibility in a rising-rate environment.
Submarket analysis — matching published land prices against estimated settled ADR
This is the heart of the exercise. Commercial land prices for eight submarkets nationwide were taken from the 2026 Official Land Price Publication via the MLIT Real Estate Information Library. The catchment is roughly a 1.5 km radius from each submarket center, covering commercial-use standard sites. Alongside them sit the estimated settled ADR for each ward compiled by MetroEngines Research (12-month average, July 2025 to June 2026). The mirror image of this exercise — solving from the land-price side for the maximum price a given ADR can support — produces the same feasibility boundary approached from the opposite direction.
| Submarket | Median commercial land price (¥/m²) | YoY | Project cost (¥m/room) | Break-even ADR | Prevailing ADR | vs. break-even |
|---|---|---|---|---|---|---|
| Sapporo Odori–Susukino (Chuo Ward) | 1,105,000 | +8.6% | 27.1 | ¥9,600 | ¥13,900 | +45% |
| Fukuoka Tenjin (Chuo Ward) | 2,355,000 | +9.1% | 33.4 | ¥11,800 | ¥15,300 | +30% |
| Fukuoka Hakata Station (Hakata Ward) | 2,000,000 | +9.7% | 31.6 | ¥11,200 | ¥14,000 | +26% |
| Osaka Shinsaibashi–Hommachi (Chuo Ward) | 2,030,000 | +16.3% | 31.7 | ¥11,200 | ¥13,300 | +18% |
| Nagoya Meieki (Nakamura Ward) | 1,410,000 | +5.2% | 28.6 | ¥10,100 | ¥10,100 | ±0% |
| Nagoya Sakae (Naka Ward) | 1,360,000 | +4.5% | 28.4 | ¥10,000 | ¥9,600 | +4% needed |
| Osaka Umeda (Kita Ward) | 2,390,000 | +15.9% | 33.5 | ¥11,800 | ¥11,300 | +5% needed |
| Central Tokyo (Chiyoda City, Chuo City) | 9,050,000 | +10.7% | 66.8 | ¥23,600 | ¥17,300 | +36% needed |
Sapporo has the widest cushion for a straightforward reason: at ¥1.105 million per square meter, its median commercial land price is the lowest of the eight, while its estimated settled ADR of ¥13,900 is on par with Fukuoka Hakata Station (¥14,000). Land costs one-eighth of central Tokyo’s, yet rates hold at 80% of the level. Fukuoka’s two submarkets share the same structure — high rate levels relative to land cost.
Osaka’s two submarkets sit in opposite positions. Shinsaibashi–Hommachi runs 18% above the break-even line, while Umeda falls 5% short. Umeda’s median land price of ¥2.390 million per square meter exceeds Shinsaibashi–Hommachi’s ¥2.030 million, yet the estimated settled ADR for limited-service inverts the ranking: ¥11,300 in Umeda against ¥13,300 in Shinsaibashi–Hommachi. Umeda is a submarket where land cost has run ahead, and the phase in which rates catch up is the upside. That land prices in both submarkets are growing around +16% year on year — the highest in the country — is itself the market pricing in future rate growth.
The upside range — site selection moves the break-even ADR by 30%
The submarket median is the price of “standard land in that submarket,” and actual hotel sites are often cheaper parcels. So the break-even ADR was also calculated for each submarket assuming land acquired at the bottom-quartile price level.
| Submarket | Bottom-quartile land price (¥/m²) | Project cost (¥m/room) | Break-even ADR | Prevailing ADR | vs. break-even |
|---|---|---|---|---|---|
| Sapporo Odori–Susukino (Chuo Ward) | 455,000 | 23.9 | ¥8,400 | ¥13,900 | +65% |
| Fukuoka Tenjin (Chuo Ward) | 1,710,000 | 30.1 | ¥10,600 | ¥15,300 | +44% |
| Fukuoka Hakata Station (Hakata Ward) | 1,550,000 | 29.3 | ¥10,400 | ¥14,000 | +35% |
| Osaka Shinsaibashi–Hommachi (Chuo Ward) | 1,520,000 | 29.2 | ¥10,300 | ¥13,300 | +29% |
| Nagoya Meieki (Nakamura Ward) | 565,000 | 24.4 | ¥8,600 | ¥10,100 | +17% |
| Osaka Umeda (Kita Ward) | 1,490,000 | 29.0 | ¥10,300 | ¥11,300 | +10% |
| Central Tokyo (Chiyoda City, Chuo City) | 4,610,000 | 44.6 | ¥15,800 | ¥17,300 | +10% |
| Nagoya Sakae (Naka Ward) | 677,000 | 25.0 | ¥8,800 | ¥9,600 | +9% |
On this assumption, all eight submarkets fall into feasible territory. Central Tokyo in particular sees its break-even ADR drop ¥7,800, from ¥23,600 to ¥15,800, moving the prevailing ¥17,300 into a 10% cushion. Even within the same Chiyoda and Chuo Cities, land prices in prime Marunouchi and Ginza run close to double those in secondary locations such as Kanda, Hatchobori and Ningyocho. Site selection for a limited-service hotel is precisely the work of capturing that gap.
Submarkets that clear at today’s rates
Sapporo, Fukuoka, Osaka (Shinsaibashi–Hommachi)
Run 18–45% above the break-even line even on submarket-standard land prices. Site options are broad and the business plan has room to flex. There is a buffer for now even if land prices keep rising.
Submarkets where rate growth decides the outcome
Nagoya (Meieki, Sakae), Osaka (Umeda)
Almost exactly on the line. Another 4–5% of ADR growth and they clear even at standard land prices. Gains in occupancy and GOP margin on the operating side translate directly into upside.
The submarket where site selection is the biggest lever
Central Tokyo
At the submarket median land price it needs 36% of rate growth, but on a bottom-quartile site today’s rates carry a 10% cushion. Choosing the location within the submarket beats switching submarkets.
The full-service threshold — the 200-room model nearly doubles project cost
The 200-room full-service model assumes 55 m² of gross floor area per room and ¥39.58 million of construction cost, putting project cost at nearly twice the limited-service level. Because its NOI coefficient of ADR × 105.4 is lower than the limited-service model’s, the break-even ADR rises by more than the increase in project cost alone.
| Submarket | Project cost (¥m/room) | Break-even ADR | Prevailing ADR | Properties in scope | vs. break-even |
|---|---|---|---|---|---|
| Osaka Umeda (Kita Ward) | 61.5 | ¥26,100 | ¥28,000 | 18 | +7% |
| Fukuoka Tenjin (Chuo Ward) | 61.2 | ¥26,000 | ¥30,000 | 10 | +15% |
| Sapporo Odori–Susukino (Chuo Ward) | 49.7 | ¥21,100 | ¥19,700 | 26 | +7% needed |
| Central Tokyo (Chiyoda City, Chuo City) | 122.5 | ¥52,100 | ¥35,400 | 32 | +47% needed |
A full-service hotel in central Tokyo comes to more than ¥120 million per room at the submarket median land price, for a break-even ADR of ¥52,100 — a required upside of 47% against the prevailing ¥35,400. That is a conservative assumption, applying a 600% floor-area ratio uniformly; actual large-scale central-Tokyo projects benefit from sites with ratios above 1,000% and from land-cost allocation across mixed-use development with offices and retail. Property-level acquisition records at listed hotel REITs show a median acquisition price of ¥63.27 million per room for holdings in Minato City, Tokyo (7 properties) — actual transactions, including mixed-use development and acquisitions of existing buildings, land below this calculation.
Supply pressure — the confirmed pipeline thins after 2027, but the count will grow
Future supply cannot be ignored in any discussion of break-even ADR. Aggregating building-plan data from MLIT’s Building Starts Statistics Survey within the scope MetroEngines Research tracks, hotel plans on a building-confirmation basis number 64 projects and roughly 14,500 rooms. By year: 22 projects and 5,304 rooms in 2025; 21 and 4,967 in 2026; 13 and 2,922 in 2027; 7 and 1,228 in 2028; and 1 project with 100 rooms in 2029. Limiting to projects of 100 rooms or more gives 57 projects and roughly 14,100 rooms — a mix dominated by large developments.
One caveat matters here: because building confirmation is typically filed one to two years before opening, counts for 2028 and beyond are structurally undercounted. These figures are a floor for the confirmed pipeline as of now, and they will grow as further applications are filed. Reading the thin post-2027 years as “supply stops” is not appropriate.
By region, Tokyo leads with 17 projects, followed by Kyoto, Chiba, Hokkaido and Kanagawa at 5 each and Osaka at 4. Plans are moving even in submarkets with ample feasibility cushion such as Sapporo and Fukuoka, which puts the question of how much first-mover advantage can be secured squarely on the table.
Where estimated settled ADR stands — seasonal patterns differ by submarket
Finally, a look at the prevailing rates that form the denominator of the feasibility test. Estimated settled ADR for limited-service hotels in the five major submarkets is plotted monthly from July 2025 to June 2026. Central Tokyo (Chiyoda City) peaked at ¥20,400 in April 2026 and stood at ¥12,900 in June 2026. Fukuoka Hakata Station held a stable ¥12,500–15,700 range across the year, the narrowest swing of the group. Sapporo’s Chuo Ward shows the strongest seasonality: a winter-event peak of ¥20,300 in February 2026 against a drop to ¥8,300 in April.
Break-even ADR is judged on a full-year average, but the more volatile a submarket’s rates, the more room revenue management has to lift the annual figure. In a submarket like Sapporo, with a 2.4x monthly swing, measures that raise low-season rates carry a correspondingly large impact on annual ADR.
Summary — a 1.00% policy rate does not mean “infeasible”; it means the conditions are now explicit
Many Bank of Japan board members are reported to share the view that a 1.00% policy rate still represents accommodative financial conditions. The calculations here bear that out: under standard terms of a 3.00% borrowing rate, 60% LTV and 1.3x DSCR, the required NOI yield is only 4.48%, and four of the eight submarkets clear at today’s rates even on submarket-standard land prices. Assuming a bottom-quartile site, all eight fall into feasible territory.
What matters more is that with the interest rate now an explicit cost in the formula, feasibility can be judged precisely. A 1.75-point move in the rate widens the required NOI yield by 0.88 points. Against that, a 3-point gain in occupancy cuts the break-even ADR by ¥300, and a 3-point gain in GOP margin cuts it by ¥700–900. Halving the land price cuts the break-even ADR by 30%. The structure in which site selection and operating quality outweigh interest rates has not changed.
Construction cost rose 40% from 2022 to 2024, and pricing in inflation during the build period puts ¥2.38 million per tsubo within sight for 2028. That lifts project cost, but it also raises the bar for new entry and increases the scarcity value of existing stock. Together with a confirmed pipeline that looks thin from 2027 onward, the medium-term picture is one in which tighter supply and demand support rate upside.
How to read these calculations: the break-even ADR in this article is a simplified calculation based on published statistics and public data. Actual investment decisions require the specific conditions of the target site (floor-area ratio, site shape, district plans, presence of existing buildings), real quotes from construction firms, individually negotiated terms with lenders, and a detailed feasibility study. Land prices are statistics for commercial standard sites within each submarket and differ from individual transaction prices.
Related Reading
References and Sources
■ Data sources
Estimated settled ADR is an estimate calculated by applying category-specific adjustment coefficients to the lowest publicly listed plan level each property posts on OTAs and similar channels (by ward, business-hotel category, 12-month average from July 2025 to June 2026; properties in scope are noted in each table). Land prices are commercial standard sites from the MLIT Real Estate Information Library, “Official Land Price Publication (2026),” within roughly a 1.5 km radius of each submarket center (N=20–60 sites per submarket). Construction cost is derived by dividing planned construction cost by floor area in e-Stat “Survey on Building Construction Starts” (statistics ID 0003114490, use category “52 accommodation business”). Reference rates are from Bank of Japan, “Changes in the Long- and Short-Term Prime Rates (Major Banks).” Occupancy assumptions come from June 2026 monthly disclosures by three listed hotel REITs.
■ Calculation assumptions
Required NOI yield = DSCR × loan constant × LTV (25-year term, level payments of principal and interest). Spreads (+0.85% to +1.25%) are assumed values set at levels typical of development and acquisition deals. Model A is 100 rooms, 30 m² of gross floor area per room, 82% occupancy, 42% GOP margin and a 3% FF&E reserve; Model B is 200 rooms, 55 m² per room, 80% occupancy, 30% GOP margin and a 4% FF&E reserve. A 600% floor-area ratio is assumed, and land cost is converted per room as “land price × 5” (Model A). Construction cost compounds inflation assumptions of +5.6% (2025), +5.3% (2026), +5.0% (2027) and +4.5% (2028) onto the 2024 actual of ¥1.950 million per tsubo, giving ¥2.379 million per tsubo for an assumed 2028 build.
■ Limitations and caveats
The break-even ADR in this article is a simplified calculation based on published statistics and public data; actual investment decisions require the specific conditions of the target site (floor-area ratio, site shape, district plans, presence of existing buildings), real quotes from construction firms, individually negotiated terms with lenders, and a detailed feasibility study. Cross-checked against property-level results disclosed by listed hotel REITs (Invincible Investment Corporation, 184 property-months, April–May 2026), the median error of estimated settled ADR is approximately 7.5%, and it differs from each property’s actual transacted prices and accounting figures. Land prices are statistics for commercial standard sites within each submarket and differ from individual transaction prices. The confirmed pipeline is on a building-confirmation basis as of the survey date (N=64 projects) and is expected to increase as further applications are filed.
■ Market data
- MetroEngines Research & Consulting — estimated settled ADR (by ward and category, July 2025 to June 2026) and acquisition-price data for listed hotel REIT holdings (as of July 27, 2026, N=301 properties)
■ Financial and interest-rate data
- Bank of Japan, “Changes in the Long- and Short-Term Prime Rates (Major Banks)”
- Bank of Japan, “Monetary Policy Meetings: Operations and Decisions”
- Dai-ichi Life Research Institute, “Policy Rate Raised to 1.00% — the June 2026 BOJ Monetary Policy Meeting” (Hideo Kumano, June 2026)
- Mitsubishi Research Institute, “BOJ Monetary Policy Meeting (June 15–16, 2026) — Policy Rate Raised to 1.0%, Halt to the Reduction in JGB Purchases Decided”
- Nikkei, “BOJ Decides to Hold the Policy Rate at 1.0%, Revises Growth Outlook Upward” (July 31, 2026)
■ Government statistics and public data
- MLIT Real Estate Information Library, “Official Land Price Publication (2026)”
- e-Stat, “Survey on Building Construction Starts” (statistics ID 0003114490, use category “52 accommodation business”)
- MLIT, “Building Starts Statistics Survey” (hotel building-plan data)
■ REIT and industry reports
- Invincible Investment Corporation, “Monthly Operating Results (June 2026),” 101 domestic hotels
- Japan Hotel REIT Investment Corporation, monthly operating results (29 hotels under variable-rent and similar structures, June 2026)
- Ichigo Hotel REIT Investment Corporation, “Monthly Operating Results (June 2026)”
- Relo Hotel Solutions, “What Is Hotel GOP?” (GOP margin benchmarks by category)
- JLL, “Japan Hotel Investment Market” (construction-cost inflation and the new-supply ratio)