

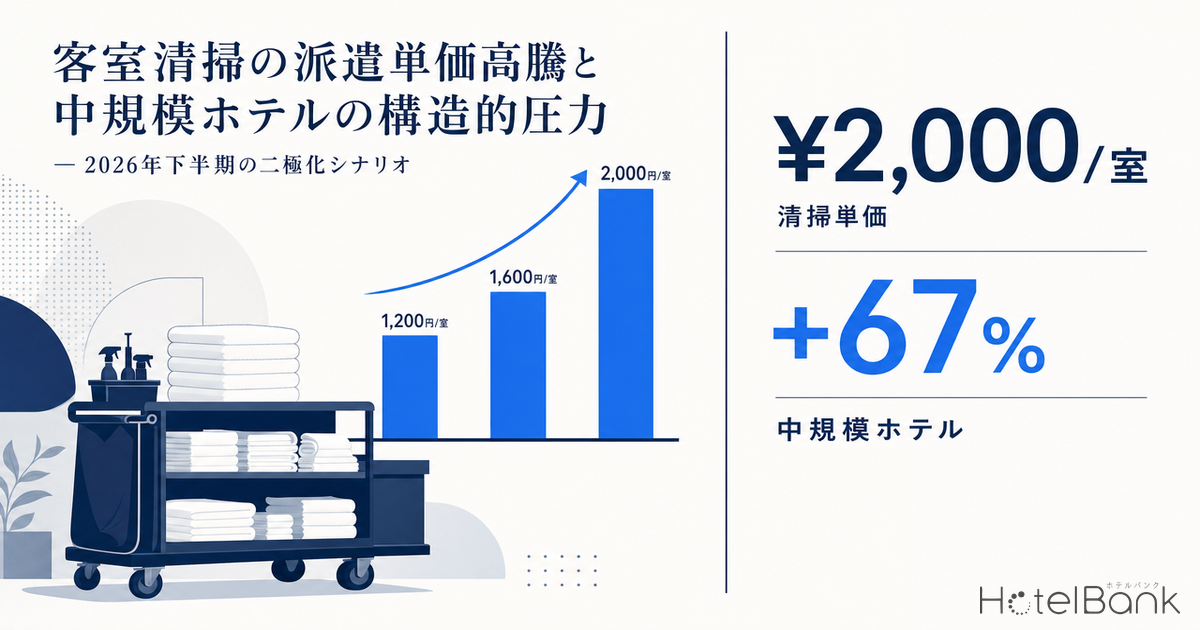
From 2025 into 2026, hotel-industry dispatch rates for guest room cleaning have continued to surge. Japan’s minimum wage was revised in October 2025 to a national average of ¥1,121, exceeding ¥1,000 in every prefecture for the first time. In tandem, cleaning dispatch rates have climbed into the ¥1,500–2,000 per-hour range, and per-room outsourcing costs have ballooned to roughly 1.8x on average. This article combines OTA listed-price data covering approximately 12,000 properties, Japan Tourism Agency lodging statistics, and J-REIT monthly operating results to visualize the structural pressures facing mid-size business hotels (30–80 rooms) that cannot internalize cleaning operations, and the dividing line of polarization heading into the second half of 2026.
Metric Definitions Used in This Article
- ADR (Average Daily Rate): The average of listed prices published on OTAs and similar channels. This differs from actually transacted prices (cross-checks against J-REIT disclosures show listed-price ADR runs about +25–30% higher than transacted ADR; the structural reason is that unsold higher-priced plans remain visible on OTAs, pulling the public-price average above realized transaction prices). Figures represent per-room rate for double occupancy (tax included), averaged across all plans (room-only through meal-inclusive).
- OCC (Occupancy Rate): Share of sold rooms versus total area inventory (estimated from OTA sales inventory). J-REIT monthly OCC figures are transaction-based (realized).
- Cleaning Rate: Per-room cleaning outsourcing fee billed by dispatch contractors to hotel operators (post-checkout cleaning plus linen change). Varies by region, room size, and bed count.
- Data Sources: MetroEngines Research / Japan Tourism Agency Accommodation Travel Statistics Survey / J-REIT Monthly Operating Results / MHLW Minimum Wage Statistics / Teikoku Databank
Nationwide ¥1,000+ Minimum Wage Has Pushed Up Cleaning Rates
Japan’s FY2025 regional minimum wage revisions lifted the national average to ¥1,121 (+¥66 YoY). Tokyo reached ¥1,226, Osaka ¥1,177, and even the lowest prefectures (Kochi, Miyazaki, Okinawa) hit ¥1,023, putting every prefecture above ¥1,000. While minimum wage directly sets the floor for part-time and casual labor costs, in the hotel industry it links straight to the per-room cleaning rates set by dispatch agencies. The vast majority of cleaning staff are part-time or dispatched workers, and agencies build their per-room price by stacking minimum wage plus social-insurance premiums, administrative overhead, and profit margin. The reality that the 2026 ADR upcycle has shifted from “demand-driven” to “labor-cost pass-through-driven” is detailed in The True Nature of Labor-Cost Pass-Through ADR Growth: Reading the 2026 Hotel Price Structural Shift Through OCC×ADR Divergence, which dissects the OCC–ADR divergence data.
Cleaning contractor disclosures show that per-room outsourcing fees, which stood in the ¥600–1,000 standard range as of 2021, had moved up to ¥1,200–2,000 by 2024–2025. Industry surveys put the average per-room cleaning cost at roughly 1.8x its earlier level. This is more than a simple labor-cost rise: it reflects a severe contraction in labor supply (over 60% of hotel properties report zero applicants), which has strengthened dispatch agencies’ pricing power. The structure by which the ability to pass labor-cost increases through to ADR becomes the dividing line for bankruptcy risk is quantified by ADR tier in Labor-Cost Pass-Through and Bankruptcy Risk in the Lodging Industry: ADR Data Reveals the Sustainability Threshold.
Source: Ministry of Health, Labour and Welfare “Regional Minimum Wages,” MetroEngines Research, HotelBank Editorial Team
The Structure Behind 60%+ “Zero Applicants” at Cleaning Sites
The labor market for guest room cleaning is being squeezed simultaneously by post-COVID tourism recovery and the retirement of baby-boomer (the so-called “2025 problem”) frontline workers. Japan Tourism Agency data shows 2025 inbound arrivals hit a record 42.68 million, more than 30% above the pre-COVID 2019 peak of 31.88 million. Meanwhile, 62% of hotel properties report being unable to attract any applicants at all (per industry-press reporting), and frontline operations are caught in a structure where assembling a cleaning team alone consumes the day.
To ease this supply-demand crunch, hotel-sector use of the gig-work app “Timee” has expanded roughly 1.3x YoY. Timee draws a high share of middle-aged and older applicants, and because hotel room cleaning is relatively low in physical strain, matching tends to succeed. That said, gig work is fundamentally a stopgap for immediate headcount; it does not halt the structural rate increase itself. If anything, as instant-matching labor markets expand, dependence on dispatch and spot labor — where no fixed employment contract is required — deepens, and pricing power may tilt further toward the worker side.
Foreign workers form another pillar of the response. The Specified Skilled Worker (“Lodging”) program had its acceptance requirements clarified by 2026 and provides a meaningful workforce supplement for the industry. However, “engagement in guest room cleaning alone is not permitted” — employment must encompass overall lodging services including front desk, customer service, and restaurant duties. In other words, the SSW track cannot be used as a pure cleaning-staff channel, making it structurally ill-suited to directly resolve the cleaning rate surge.
Structural Pressure on Mid-Size Business Hotels (30–80 Rooms)
The impact of cleaning rate inflation varies sharply by hotel scale. Comparing business-hotel ADR by size band between the Tokyo / Kansai / Chubu metros (Tokyo, Kanagawa, Chiba, Saitama, Osaka, Kyoto, Hyogo, Nara, Aichi) and the rest of Japan, using MetroEngines Research OTA listed-price data, reveals an interesting structure.
Looking at YoY change from March 2024 to March 2026, in the major metros the 30–79 room mid-size band rose +8.6% (¥20,400 → ¥22,200), the 80–199 room mid-large band +11.1% (¥20,400 → ¥22,600), and the 200+ room large band +10.2% — price pass-through clearly accelerates with scale. By contrast, the under-30-room small band rose just +0.3% (¥28,700 → ¥28,800), essentially flat, and has been unable to capture the benefit of the ADR upcycle. In the regional markets, every size band rose +10–13%, but the absolute level itself is 30–40% lower than in the metros, leaving little headroom to absorb cleaning rate increases. The same polarization is also visible in the new-opening market: Reading the Optimal Scale Strategy from 582 Hotel Openings in 2026: The Polarization Between High-ADR 30-Room Properties and Scale-Efficient 300-Room Properties uses room-count distribution to verify the split between the “30–79 room high-ADR band” and the “200+ room scale-efficiency band.”
Source: MetroEngines Research (N = 5,228 properties in 2024 / 5,287 properties in 2026, business hotels only), HotelBank Editorial Team
When weighing the capacity to absorb cleaning costs, the key ratio is “cleaning outsourcing fee as a share of per-night ADR.” Assuming cleaning rates reach ¥1,800 (regional) to ¥2,200 (metro) per room, a regional mid-size business hotel with an ADR in the mid-¥15,000s sees cleaning eat 12–15% of revenue. By contrast, a metro mid-size property with an ADR in the mid-¥22,000s holds that ratio at about 10%. City hotels and resorts with larger room footprints carry an even higher per-room cleaning rate, but because their ADR sits at the ¥39,000–¥50,000 level, the ratio stays relatively contained. The structurally pressured segment, in short, is the “30–80 room, regional business hotel” — mid-level ADR and mid-level scale.
Source: HotelBank Editorial Team estimates using MetroEngines Research and industry public data (assumes ¥1,800–2,200 per-room cleaning rate)
What J-REIT Monthly Results Reveal About Scale Economies and In-Sourcing Advantage
To read the impact of scale economies on cleaning costs, we turn to J-REIT monthly operating results. Comparing the February–March 2026 results of seven investment corporations — Ichigo Hotel REIT (いちごホテルリート投資法人), Invincible Investment (インヴィンシブル投資法人), Japan Hotel & Residential Investment (日本ホテル&レジデンシャル投資法人), Japan Hotel REIT (ジャパン・ホテル・リート投資法人), Hoshino Resorts REIT (星野リゾート・リート投資法人), Mori Trust Hotel REIT (森トラストリート投資法人), and Kasumigaseki Hotel REIT (霞ヶ関ホテルリート投資法人) — a common pattern emerges: REITs that hold multiple, 100+ room large-scale properties hold OCC in the 85–88% range while progressing on inflationary ADR pass-through. Invincible posted average OCC 87.6% across 104 properties, Ichigo Hotel REIT 87.5% across 26 properties, Japan Hotel & Residential 88.7% across 20 properties, and Japan Hotel REIT 85.1% across 8 properties — all at high occupancy levels.
Most of these REIT-held properties operate either “in-housed housekeeping” or “long-term fixed-rate contracts with a specific cleaning vendor,” which insulates them, relatively speaking, from spot dispatch-rate spikes. Holding multiple properties also affords the flexibility to rotate cleaning staff shifts across the portfolio. By contrast, stand-alone 30–80 room properties often request dispatch service on an as-needed basis based on the day’s booking situation, and in supply-tight periods they directly absorb the rise in spot rates.
Source: HotelBank Editorial Team using monthly operating data of each REIT (February–March 2026, full portfolio)
The 2026 H2 Polarization Scenario — The Robot Adoption Threshold
Heading into the second half of 2026, mid-size business hotels are likely to branch into three strategic choices. First, “in-house housekeeping plus multi-skill cross-training.” Second, “deployment of cleaning robots and housekeeping support systems.” Third, “thorough price pass-through (high-value-add plan design plus breakfast pairing).”
Cleaning robot deployments expanded sharply in 2025. Labor-saving investment is similarly accelerating in front-desk operations; for GOP scenarios for 80-room and 150-room properties under facial-recognition check-in deployment, see Riding Out the Labor-Cost Shock with Facial-Recognition Check-In, which analyzes the labor-saving strategy threshold. Richmond Hotels has deployed AI cleaning robots across its 42 directly operated properties, shortening cleaning time and standardizing quality. At Yumoto Fujiya Hotel in Hakone, deployment of PUDU CC1 cut cleaning time by 10–20%. JTB Shoji, Aim Technologies, and Solution Alive jointly commercialized in 2025 a system linking cleaning, serving, and transport robots, along with a linen transport robot. The threshold for adoption (the rough payback line) sits at roughly “50+ rooms, OCC 70%+, and 300+ operating days per year.” In the 30–50 room band, the per-robot operating days are insufficient, so combinations with in-sourcing or shared-use cooperative models become the realistic alternatives.
Source: HotelBank Editorial Team estimates using disclosures from Richmond Hotels, Yumoto Fujiya, JTB Shoji, and others
Record-High Labor-Shortage Bankruptcies — The Reality of “Profitable Shutdowns”
According to Teikoku Databank, labor-shortage bankruptcies in FY2025 (April 2025–March 2026) reached 441 cases, exceeding 400 for the first time and setting a new record. By industry, services led with 114 cases, construction 112, and transport/communications 69. Notably, businesses with fewer than 10 employees accounted for roughly 75% (333 cases) of the total. Hotel and ryokan operator bankruptcies in the same period totaled 80 cases with ¥34.5 billion in liabilities — a YoY increase of +2.6% in case count and +65.4% in liabilities. Even as tourism demand sets new records, frontline labor shortages are driving a structure of “profitable shutdowns.”
Note on Forward-Date ADR: ADR figures in this article reflect the average of listed sales prices on OTAs at the time of survey and will fluctuate as check-in dates approach. Prices currently set high may decline through last-minute markdowns. Industry-average cleaning rates are derived from dispatch contractor disclosures and trade press reporting and may differ materially under individual contract terms.
Conclusion — How to Cross the Polarization Threshold
The cleaning rate surge is more than a simple cost increase: it is structural pressure whose absorption capacity varies sharply by hotel “scale” and “location.” What the data in this article shows is that regional business hotels at mid-level ADR (¥15,000–¥22,000) and mid-level scale (30–80 rooms) sit in the toughest position. Metro mid-large and large properties, REIT-held portfolios with multiple assets, and brand chains advancing in-house housekeeping are weaponizing scale economies and price pass-through power to absorb cleaning rate increases while expanding revenue opportunities.
The choices for H2 2026 are clear. Properties that can execute some combination of (1) in-house housekeeping and multi-skill cross-training, (2) cleaning robot deployment at scales meeting 50+ rooms and OCC 70%+, or (3) thorough price pass-through via high-value-add plan design, can convert the cleaning rate surge into a growth opportunity. Conversely, properties unable to pursue these options, and remaining dependent on outsourced dispatch labor, carry the risk of becoming the next reserve list in labor-shortage bankruptcy statistics. For a regional exit-risk map and the pressure structure concentrated on mid-size ryokan in Tohoku and Chugoku, see Exit-Risk Prefecture Map — The Direct Hit of Full-Scale Zero-Zero Loan Repayments in H2 2026, which publishes the by-prefecture map. For mid-size regional business hotels, H2 2026 will be the period that decides “which side of the polarization line they end up on.”
Related Reading
- Riding Out the Labor-Cost Shock with Facial-Recognition Check-In — Labor-Saving Strategy and 80/150-Room GOP Scenarios for Small-Mid Business Hotels
- Labor-Cost Pass-Through and Bankruptcy Risk in the Lodging Industry: ADR Data Reveals the Sustainability Threshold
- Exit-Risk Prefecture Map — H2 2026 Direct Hit from Full-Scale Zero-Zero Loan Repayments, with Pressure Concentrated on Mid-Size Ryokan in Tohoku and Chugoku
- A View from the “Exit Side”: Forecasting the Re-Acceleration of Hotel and Ryokan Bankruptcies in H2 2026
- The True Nature of Labor-Cost Pass-Through ADR Growth: Reading the 2026 Hotel Price Structural Shift Through OCC×ADR Divergence
- Reading the Optimal Scale Strategy from 582 Hotel Openings in 2026: The Polarization Between High-ADR 30-Room and Scale-Efficient 300-Room Properties
- Record-High National Average ADR ¥32,340 (May 2026): The Structural Breakdown Behind “+19% in 3 Years” Driven by Inflation and Labor-Cost Pass-Through
References and Sources
Market Data
- MetroEngines Research — OTA listed-price data (business hotels, N = 5,287 properties as of March 2026), ADR aggregation by size band
Government Statistics and Public Data
- Japan Tourism Agency, “Accommodation Travel Statistics Survey (2025 annual preliminary, January 2026 first-preliminary)”
- MLIT, “Survey on the Status of Foreign Worker Acceptance in Lodging Facilities” (March 2025)
- Japan Tourism Agency, “Foreign Worker Acceptance in the Lodging Sector (Specified Skilled Worker)”
Private Surveys and Industry Reports
- Teikoku Databank, “Bankruptcy and Closure Trends in the Lodging Industry (2025)”
- Teikoku Databank, “FY2025 Bankruptcy Aggregation Report (April 2025–March 2026)”
- Teikoku Databank, “Labor-Shortage Bankruptcies Hit Record 441 Cases”
- Kanko Keizai Shimbun, “80 Hotel and Ryokan Bankruptcies in FY2025, ¥34.5 Billion in Liabilities”
- Timee, “Hotel Industry Gig-Work Usage Report”
J-REIT Monthly Operating Results
- Ichigo Hotel REIT (3463), Invincible Investment (8963), Japan Hotel & Residential Investment (3472), Japan Hotel REIT (8985), Hoshino Resorts REIT (3287), Mori Trust Hotel REIT (8961), Kasumigaseki Hotel REIT (401A) — February–March 2026 monthly results
Industry Articles and Practitioner Information
- Fullcast Holdings, “The Current State of Labor Shortages in Guest Room Cleaning”
- Teramoto, “The 2025 Problem and Guest Room Cleaning”
- Teramoto, “IoT/Robotics and the Cleaning Staff Shortage”
- Rise Service Create, “Rising Hotel Cleaning Staff Demand and Solutions to the Labor Shortage”
- tokonatsu, “Hotel Guest Room Cleaning Price Guide”
- Nikkan Kogyo Shimbun, “Richmond Hotels Deploys AI Cleaning Robots Across All Properties”
- Robotstart, “JTB Shoji, Aim Technologies, and Solution Alive Robotics Linkage System”
- DFA Robotics, “Cleaning Robot Deployment at a Hotel in Hakone-machi”
Minimum Wage