

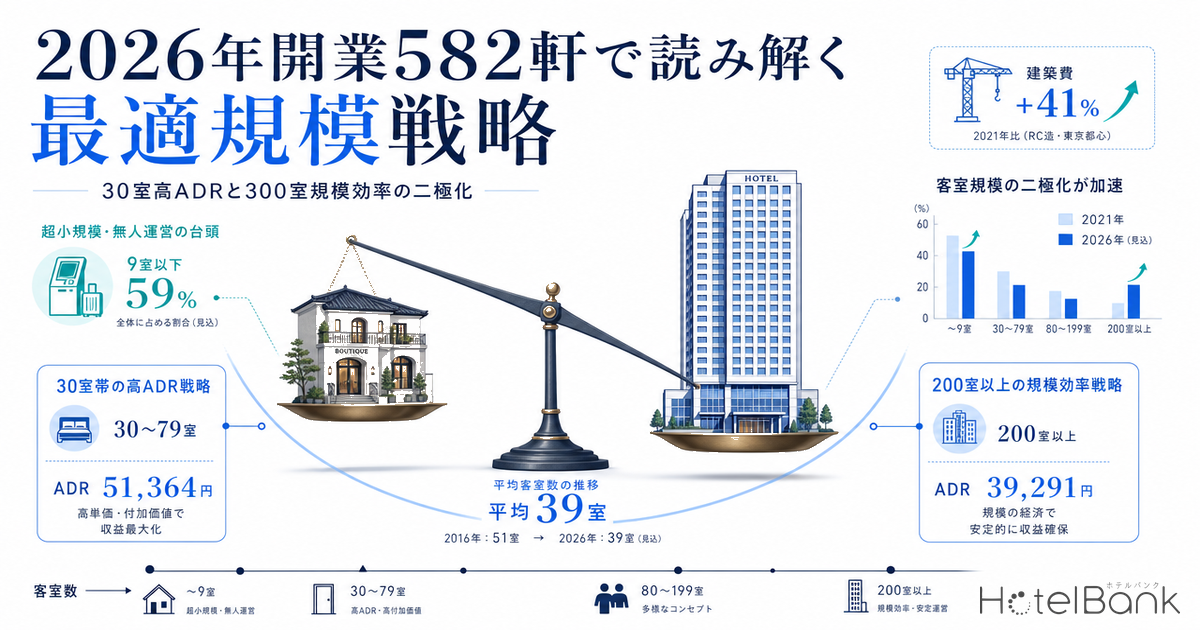
With construction cost per tsubo up 41% in two years and the new-supply ratio falling to one-quarter of the Asia-Pacific average, where is the optimal scale for hotel investment? Analyzing the room-count distribution, occupancy performance, and price tiers of 582 properties slated to open in Japan in 2026 reveals an average size shrinking to 39 rooms while the market polarizes into a “high-ADR 30–79-room band” and a “scale-efficient 200+-room band.” This article verifies the gap between the strongest- and weakest-performing buckets by combining OTA public price data, industry-standard breakeven benchmarks, and land price data.
Metric Definitions Used in This Article
- ADR (Average Daily Rate): Average of selling prices publicly listed on OTAs. Differs from actual transaction prices (cross-referencing with REIT disclosures suggests OTA ADRs run +25–30% higher than realized ADRs). Per-room rate for double occupancy (tax-included), averaged across all plans (room-only through meal-inclusive).
- OCC (Occupancy Rate): Ratio of sold rooms to total room inventory in the area (estimated from OTA sales inventory).
- RevPAR Estimate: Revenue indicator calculated as ADR × OCC. Used only at the area/bucket level, not applied to individual hotels.
- Data Source: MetroEngines Research & Consulting
Of the 582 hotels scheduled to open in 2026 and tracked by MetroEngines Research & Consulting, all 582 have room-count data: average size is 39 rooms, with the largest at 750 rooms (The Royal Park Hotel Maihama Resort Tokyo Bay). By bucket, 9 rooms or fewer account for 343 properties (59%) and 10–29 rooms for 73 properties (13%), meaning small-scale properties under 30 rooms alone make up 72% of the total. By contrast, mid-to-large properties of 150+ rooms total just 57 (10%). This extreme miniaturization reflects investment concentration into the “unmanned compact” model amid soaring construction costs.
The core finding of this article is that ADR and RevPAR estimates form a “U-shape” across buckets. The highest ADR is in the 30–79-room band (¥51,400), while the lowest is in the 80–149-room band (¥39,300). Mid-scale properties cannot reach luxury price levels yet also fail to capture economies of scale — a structural no-man’s-land that is most directly exposed to construction cost inflation. By contrast, the 30–79-room band has formed a small-luxury winning pattern in resort and hot-spring destinations, while the 200+-room band pursues scale efficiency in major urban centers. For the supply impact of the luxury band specifically, our analysis of Six Luxury Hotels Opening in Japan in 2026 examines six properties individually, including Imperial Hotel Kyoto (帝国ホテル京都), Capella Kyoto, and Conrad Nagoya.
Sorting the room-count distribution into six buckets reveals a stark miniaturization trend. Mini properties of 9 rooms or fewer total 343 (of which 247 are vacation-rental properties), 10–29 rooms 73 properties, 30–79 rooms 71, 80–149 rooms 38, 150–299 rooms 52, and 300+ rooms 5. Looking at total room count, the 9-rooms-or-fewer bucket contributes just 713 rooms while the 150–299-room bucket supplies 10,735 and the 300+ bucket 2,345 — meaning market supply capacity is concentrated in large properties despite their smaller count.
Category composition is also distinctive. Vacation rentals lead with 247 properties, followed by business hotels (54), guesthouses (27), hostels (23), resort hotels (21), machiya townhouses (21), and ryokan (19). Aggregating categories suited to unmanned operation — vacation rentals, guesthouses, hostels, machiya, cottages, pensions, and glamping — yields 324 properties, or 56% of the total. This suggests that the majority of 2026 openings are likely designed around compact operating models that minimize on-site front-desk staffing.
By prefecture, Okinawa leads with 45 properties, followed by Kyoto (39), Tokyo (37), Shizuoka (35), Fukuoka (31), and Hokkaido (31). The size distribution, however, varies markedly by region. Kyoto’s average is just 12 rooms, dominated by machiya and shukubo formats. Okinawa averages 49 rooms with a mix of vacation rentals and small resorts; Tokyo averages 39 rooms; Osaka averages 107, reflecting concentrated urban investment. Yamanashi (30 properties, average 10 rooms) and Nagano (24 properties, average 11 rooms) represent dispersed small-scale resort investment, while Kumamoto (15 properties, average 64 rooms) skews toward mid-scale business hotels. For regional mid-scale supply trends, our analysis of Atami’s new hotel pipeline similarly observes a sustainable supply structure led by mid-scale properties, confirming the role of the 50–100-room band in regional resort markets.
Within each bucket, we aggregated ADR and OCC only for properties with at least 30 days of observed selling-price data between April and June 2026. The results trace a clear U-shape. The 10–29-room band registers ¥49,000 and the 30–79-room band ¥51,400 — these “compact luxury” bands posting the highest ADRs. By contrast, the 80–149-room band falls to ¥39,300, the 150–299-room band to ¥38,800, and the 300+-room band to ¥41,800: once a property crosses 80 rooms, ADR drops sharply.
The gap widens when viewed through RevPAR estimates. The 30–79-room band reaches ¥37,800 (bucket high), versus just ¥23,500 in the 80–149-room band — a 38% drop from the top. Once a property exceeds 80 rooms, OCC falls to roughly 60% in mid-scale bands (80–149 rooms = 59.7%, 150–299 rooms = 62.4%, 300+ = 59.4%). Vacancies are filling reasonably well, yet ADR remains suppressed: demand exists but cannot be captured through pricing — the structural challenge facing the mid-scale band.
| Bucket | Properties | Total Rooms | Avg ADR | OCC | RevPAR Est. |
|---|---|---|---|---|---|
| ≤9 rooms | 343 | 713 | ¥39,960 | 87.2% | ¥34,833 |
| 10–29 rooms | 73 | 1,342 | ¥48,966 | 71.3% | ¥34,908 |
| 30–79 rooms | 71 | 3,523 | ¥51,364 | 73.6% | ¥37,812 |
| 80–149 rooms | 38 | 4,079 | ¥39,291 | 59.7% | ¥23,454 |
| 150–299 rooms | 52 | 10,735 | ¥38,756 | 62.4% | ¥24,181 |
| 300+ rooms | 5 | 2,345 | ¥41,772 | 59.4% | ¥24,823 |
Breaking the data down by location type sharpens the picture. Within the 30–79-room band, resort/ryokan/vacation-rental properties (resort-type) post an ADR of ¥66,700 — the highest of any bucket-location combination. Business and city-hotel properties (urban-type) come in at ¥41,800, a wide gap. In the 150–299-room band, resort-type properties again register a high ¥73,900, but the count is just 6. Mid-scale urban properties (80–149-room urban-type) sit at ¥35,900, while 150–299-room urban-type at ¥31,500 — confirming the structural difficulty of capturing luxury pricing in urban mid-scale formats.
Plotting all 529 properties on a room-count × ADR matrix reveals three distinct zones. The first is the “Small Luxury White Space ①” at ≤30 rooms × ADR over ¥100,000, containing 13 properties including FUFU Jogashima (34 rooms, ¥164,400) and edit x seven Setouchi Shodoshima (45 rooms, ¥118,100). The second is the “Compact Mid White Space ②” at 20–80 rooms × ADR ¥30,000–60,000, a zone concentrated with emerging brands such as TABI Ueno (35 rooms, ¥110,000). The third is the “Scale Efficiency Band” at 150+ rooms × ADR ¥20,000–40,000, densely populated by Toyoko Inn and APA Hotel chains.
Particularly noteworthy is the “commodity layer” within the 80–149-room band. Properties such as Hotel Kameyama Hills (85 rooms, ¥7,700), Tabist Ishinomaki (82 rooms, ¥9,900), Epoca Base Ube (132 rooms, ¥11,200), and Henn-na Hotel Express Osaka Namba Nihonbashi Annex (80 rooms, ¥15,400) cluster here with ADRs below ¥20,000. With construction cost per tsubo now at ¥1.95 million, achieving breakeven at this price point demands extremely high occupancy, dramatically lengthening the payback period for initial investment.
WS① Small Luxury
1–45 rooms × ADR ¥100,000+
Vacation rentals, villas, and small ryokan in resort and hot-spring locations. 13 properties qualify. Combining locational advantage × differentiated service × unmanned/minimal operation leaves room for yields above 10%.
Dense Mid-Scale Struggle Band
80–149 rooms × ADR ¥10–20k
Zone directly hit by construction-cost inflation. Mismatch between the labor burden needed to sustain full service and the achievable price tier forces breakeven occupancy higher.
Large Scale 200+ Room Efficiency Band
200–750 rooms × ADR ¥30–80k
Concentrated in urban centers and airport-accessible locations. Requires scale to spread fixed costs of front desk, F&B, and banquet operations across the room count. Skewed toward Okinawa, Osaka, and Chiba.
Interpreting the 2026 size distribution requires the sharp uptrend in construction costs as a baseline assumption. According to MLIT’s Statistics on Building Construction Starts, the national hotel construction cost per tsubo rose from ¥1.383 million in 2022 to ¥1.950 million in 2024 — a +41% jump in just two years. For wood construction alone, the cost has surged from the ¥730,000 range to the ¥1.23 million range, closing in on steel-frame levels. By structure type, the cost varies widely by grade: ¥3.244 million/tsubo for reinforced steel-frame concrete, ¥1.736 million for reinforced concrete, and ¥1.647 million for steel-frame.
Reinforcing this trend, JLL’s 2025 Japan Hotel Investment Market report estimates Japan’s new hotel supply ratio at roughly 1.5% of existing stock — well below the Asia-Pacific average of 6.6%. With new development constrained, planned projects polarize into either the full-service band where high ADR and meaningful F&B/banquet revenue are achievable, or the compact band that minimizes costs through small-scale unmanned operation. The mid-scale band (80–150 rooms) struggles to adopt either strategy and bears the brunt of relative cost pressure.
Industry GOP benchmarks also correlate with scale. Invincible Investment Corporation’s disclosures for the 91 MHM-operated properties show a GOP ratio of 38.9% for FY December 2024 (+1.6 pt YoY), recovering toward the pre-COVID 2019 level (39.8%). By format, benchmark GOP ranges are: limited-service 50–60%, city hotel 10–30%, resort hotel 20–40%, and ryokan 5–15% (Relo Hotel Solutions reference). The more revenue departments outside rooms a property carries, the more GOP tends to compress. This dynamic illustrates why the 80–149-room band — where banquet and F&B demand is hard to read — cannot sustain the fixed costs of full-service operations.
We compare profitability across four hypothetical size scenarios. Assumptions: construction cost uses structure-type standards (steel-frame ¥1.65M/tsubo, RC ¥1.75M/tsubo); ADR and occupancy are set conservatively from 2026 opening data; GOP ratios follow format-specific benchmarks. Land cost is reverse-calculated from published land prices by location, with land conditions differing across scenarios.
| Item | ① 30-Room Small Luxury | ② 80-Room Compact | ③ 150-Room City | ④ 300-Room Large Scale Eff. |
|---|---|---|---|---|
| Location | Hot Spring / Resort | Regional City Station Front | Major City Station Front | Greater Tokyo / Osaka / Kyoto |
| ADR Assumption | ¥80,000 | ¥20,000 | ¥25,000 | ¥30,000 |
| OCC Assumption | 65% | 75% | 78% | 80% |
| Annual Room Revenue | ¥57M | ¥440M | ¥1.07B | ¥2.63B |
| Operating Staff | Unmanned/Minimal | 6 | 30 | 80 |
| GOP Ratio Assumption | 50-60% | 25-35% | 20-30% | 30-40% |
| Initial Investment (Land + Construction) | ¥150M | ¥800M | ¥2.0B | ¥4.5B |
| Gross Yield Guide | ~10% | ~5% | ~5% | 5–6% |
| Breakeven OCC | 35-45% | 65-75% | 60-70% | 55-65% |
The conclusion from this scenario modeling is that while the “30-room small luxury” and “300-room scale efficiency” types post superficially similar yield levels, their risk profiles diverge sharply. The 30-room format can maintain high GOP through per-room price × differentiation × unmanned operation, but recovery is difficult once the rarity of its location or service erodes. The 300-room format permits flexible operation along both occupancy and ADR in response to demand, but its initial investment is orders of magnitude larger, limiting site-selection freedom.
By contrast, the 80–150-room band sits in a middle state where “ADR cannot reach luxury yet occupancy efficiency cannot match large-scale,” structurally pushing breakeven occupancy above 65%. The real-data 80–149-room OCC of 59.7% (≈40% vacancy) is the worst across buckets, while ADR is also the lowest at ¥39,300 — confirming the inability to earn through either occupancy or pricing.
*The above is a simplified estimate based on industry benchmarks (Invincible Investment Corporation 91-property MHM GOP results, Relo Hotel Solutions format benchmarks, JLL market report) and 2026 opening data. Actual investment decisions require property-level feasibility studies.
We verify optimal location by size against land price data. Karuizawa’s 2025 published land price is ¥138,700/㎡ for commercial land (+10.18% YoY) and ¥62,666/㎡ for residential land (+10.86%) — exceptional growth for a national resort destination. Even at these prices, 30-room small-luxury projects need only 300–500㎡ per property, so a standard breakdown of the ¥150M initial investment is 40–50% land and 50–60% construction.
Greater Tokyo commercial land, by contrast, rose sharply in the 2026 published prices: Tokyo 23 wards averaged +13.8%, with the high in Shibuya-ku Sakuragaoka-cho (near Shibuya Sakura Stage) reaching +29.0%. These are exactly the locations where 300-room class hotels move in, making land acquisition costs disproportionately large. For a 300-room, 10,000㎡ gross-floor-area project, acquiring 2,000㎡ in Shibuya or Ginza would likely exceed construction cost — structurally narrowing large hotel development to developer-led mixed-use projects.
| Location Type | Optimal Size | Land Price Level | Land / Construction Ratio | Example Areas |
|---|---|---|---|---|
| Resort / Hot Spring | 10–45 rooms | ¥60-150k/㎡ | 40-50% / 50-60% | Karuizawa, Atami, Yomitan |
| Regional City Station Front | 80–150 rooms | ¥150-400k/㎡ | 30-40% / 60-70% | Kanazawa, Okayama, Kumamoto |
| Major City Central Commercial | 200+ rooms | ¥1M-67M/㎡ | 60-80% / 20-40% | Shibuya, Ginza, Shinsaibashi |
2026 opening data confirms this location × size pairing. Okinawa (45 properties, avg 49 rooms) and Kyoto (39 properties, avg 12 rooms) lead with dispersed small-scale investment in resort and tourist areas; Osaka (21 properties, avg 107 rooms) shows concentrated mid-to-large urban investment; and Chiba’s largest property is the 750-room Disney Resort area format. Yamanashi (30 properties, avg 10 rooms) and Nagano (24 properties, avg 11 rooms) typify ultra-small-scale investment that captures resort-work demand.
We organize the structural factors behind the 80–149-room band’s struggle that can be read from the data. First, staffing thresholds. The minimum headcount required for 24-hour front-desk operation is roughly 6–8 (three shifts × two staff + leave buffer), unchanged whether the property has 10 rooms or 100. At 30 rooms or fewer, the “unmanned / minimal operation” model is selectable, keeping monthly labor costs under ¥500,000. Above 150 rooms, dedicated housekeeping, F&B, banquet, and facilities staff are required, but ¥15 million-class monthly labor costs can be spread across many rooms. The 80–149-room range cannot easily access either advantage.
Second, brand affiliation thresholds. Marriott, Hilton, Hyatt, and other global chains typically require at least 150 rooms as a contracting condition, leaving the 80–149-room band unable to access international brand benefits. Domestic brand contracts (Tabist, KOKO HOTEL, R Hotel series, etc.) are increasing as substitutes, but their ADR uplift is limited. As an attempt to bring global brands into mid-tier cities, formats such as the 182-room Tokyu Stay × Mercure Hiroshima dual-brand strategy — where domestic operators license foreign brands — have emerged. In real data, the 80–149-room urban-type average ADR is ¥35,900, far below the same band’s resort-type ¥52,100.
Third, minimum scale for F&B and banquet facilities. To equip a property as a city-hotel format with breakfast restaurant, banquet hall, and meeting rooms generally requires 150+ rooms (industry rule of thumb). At 80–149 rooms, properties are too small to host full-service functions yet large enough to leave idle space when operated as a limited-service property — a structural dilemma. As a result, with elevated fixed-cost ratios and limited ADR capture, breakeven occupancy ends up higher than other bands.
The investment compass drawn from data on 582 properties opening in 2026 and industry benchmarks is a clear polarization strategy. First, with construction cost per tsubo now at ¥1.95 million, the rational play is concentrated investment in either the “high-ADR 30–79-room band” that compresses per-room construction cost, or the “scale-efficiency 200+-room band” that thins fixed costs over many rooms. The middle 80–149-room band trails other bands in both ADR (¥39,300) and occupancy efficiency (OCC 59.7%), and at today’s construction cost levels its payback period easily extends.
Second, regional strategy should branch by scale. In resorts and hot-spring areas (Karuizawa, Okinawa, Kyoto, Yamanashi, Nagano), favor dispersed, unmanned 10–30-room formats; in regional cities, prefer renewal and conversion of existing mid-scale stock and avoid new 80–149-room builds; in Greater Tokyo, Osaka, and central Kyoto, target the scale-efficient 200+-room format. The fact that 2026 average property sizes split clearly between Kyoto 12 / Yamanashi 10 / Nagano 11 rooms versus Osaka 107 / Chiba 50 rooms indicates that market participants are already executing this branching strategy.
Third, the 2026 average of 39 rooms should be read not merely as a miniaturization trend but as a macro indicator of the shift to “unmanned compact operation.” Under construction-cost inflation, the realistic options are either narrowing room count to commit to differentiation, or scaling up to thin fixed costs — strategies straddling both rarely succeed structurally. Investment decisions require a sober assessment of the location rarity and ADR potential one can secure, and the resolve to swing decisively to one of the two poles.
⚠ Note on Forward-Dated ADRs: ADRs in this article reflect average selling prices publicly listed on OTAs at the time of the survey and fluctuate as check-in dates approach. Currently elevated prices may drop with last-minute discounting, or rise based on demand. Investment decisions require multi-point observation and cross-checking with market-wide trends.
Related Reading
- Tokyu Stay × Mercure Hiroshima: A Dual-Brand Strategy and New Opening Format for Mid-Tier Cities
- [April 2026 Update] Mid-Scale Properties Drive Sustainable Supply: Atami’s New Hotel Pipeline
- Three 2026 Openings: Competitive-Set Preview — Imperial Hotel Kyoto, Hamamatsu Marriott, Hilton Takayama Resort
- Six Luxury Hotels Opening in Japan in 2026: Investor-View Market Impact Analysis
- [March 2026 Update] Tokyo 23 Wards New Openings: Where Tourism, Business, and Culture Hotels Intersect
- [February 2026 Update] Hiroshima’s New Openings: Lodging Market Center of Gravity Shifts to Station Fronts
- Summer Resort 3-Region Comparison 2026 — Niseko, Okinawa, Karuizawa: ADR, Booking Pace, FX Sensitivity
- [March 2026 Update] Tokyo 23 Wards Business Hotels: A Comprehensive Analysis
- Mandarin Oriental Setouchi Reshapes Regional Luxury — Behind Kagawa’s ADR +17% and Opening Impact Estimates
- Hotel Investment in the Nankai Trough 80% Era — Disaster Risk × ADR × Risk-Adjusted Yield Across 10 Pacific Coast Destinations
- Hyatt Centric Sapporo Opens — Reading Foreign Brands and ADR Trends Across Hokkaido
- Will Junglia Okinawa Shift the Northern Market to “Year-Round”? Tested via 6-Area ADR and Sellout Rates
- Are Japan’s Hotels Undervalued by Global Standards? Tokyo, Osaka & Kyoto ADRs in USD vs NY, Paris, London
References & Sources
■ Market Data
- MetroEngines Research & Consulting — OTA public price data (N=529 properties, Apr–Jun 2026), new opening hotel data (N=582 properties), estimated OCC, and ADR/RevPAR analysis by size
■ Government Statistics & Public Data
- MLIT Statistics on Building Construction Starts — Hotel construction cost per tsubo (¥1.383M in 2022 → ¥1.950M in 2024, +41%)
- Karuizawa Published Land Prices 2025 — Commercial ¥138,700/㎡ (+10.18%), residential ¥62,666/㎡ (+10.86%)
- 2026 Published Land Prices — Tokyo Residential and Commercial Rise for Fifth Consecutive Year (PLAZA HOMES)
■ REIT & Industry Reports
- Invincible Investment Corporation FY December 2024 Earnings Presentation — MHM-operated 91 properties GOP 38.9% (+1.6 pt YoY)
- JLL 2025 Japan Hotel Investment Market — New supply ratio 1.5% vs APAC average 6.6%
- Relo Hotel Solutions: “What Is Hotel GOP?” — Format-based GOP benchmarks (limited-service 50–60%, city 10–30%, resort 20–40%, ryokan 5–15%)
■ News & Commentary
- Sharp Drop in New Hotel Supply and Severe Shortage Driven by Construction Cost Inflation: Structural Challenges Facing the 2025 Hotel Industry (Hotel X Tech)
- [2025 Edition] Hotel Construction Cost per Tsubo and Trends Nationwide (Mirai Bessou Club)
- [Yields up to 10% Possible] What is Compact Hotel Investment? (Minpaku Investment Info Navi)
- Japan Hotel Market Trends, Global Underpricing, and Limited New Supply Driven by Construction Cost Inflation (Travel Voice / JLL)