

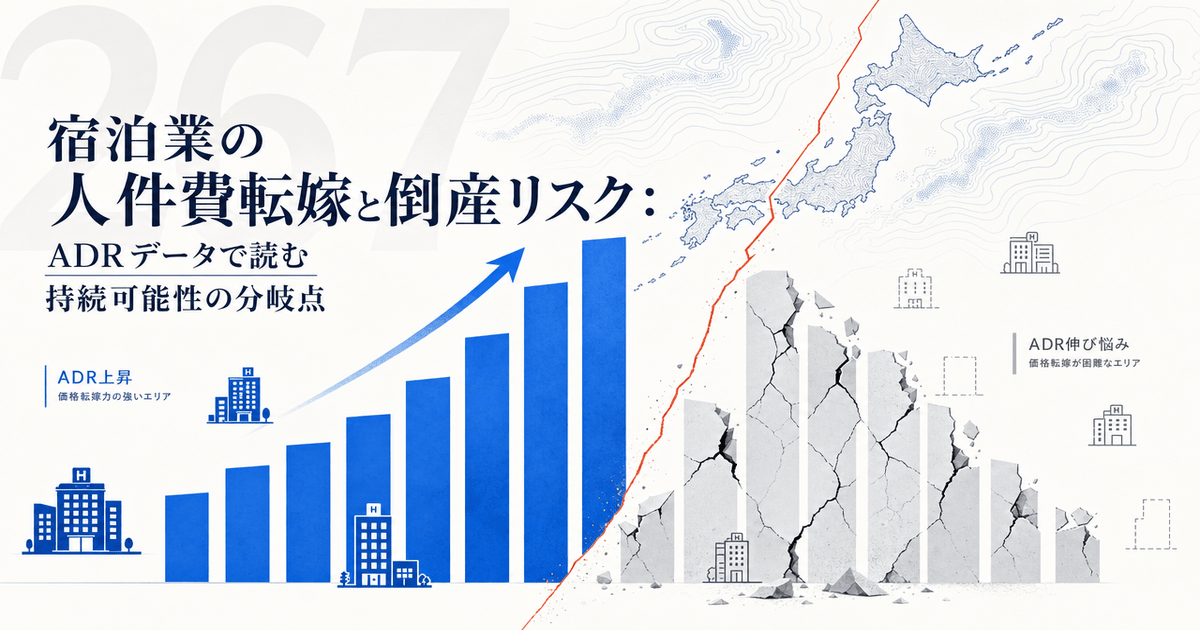

Japan’s hotel industry is now facing a structural contradiction. In 2025, inbound visitors hit a record 42.68 million and lodging demand keeps expanding, yet the labor shortage is deepening. The job-opening-to-applicant ratio is the highest of any sector, and the average monthly wage of ¥269,500 is the lowest of any industry. The 2026 Shunto wage negotiations delivered a 5.26% raise — but a decisive gap is opening up between properties that can pass that labor cost on to room rates and those that cannot. In this article, we combine MetroEngines Research ADR (average daily rate) data with Teikoku Databank’s bankruptcy statistics to quantitatively examine where the limits of price pass-through actually lie.
Metric Definitions Used in This Article
- ADR (Average Daily Rate): Average of advertised rates publicly listed on OTAs and other channels. Differs from actual booked rates. Per-room rate (tax included) for double occupancy, averaged across all plans (room-only through meal-inclusive).
- Data source: MetroEngines Research
Labor Shortage in Lodging: A Structural Crisis in Numbers
According to the Ministry of Health, Labour and Welfare’s “Basic Survey on Wage Structure” (FY2024), the average monthly wage in the accommodation and food service industry is ¥269,500 — the lowest among all 16 industries surveyed. The gap of about ¥60,000 versus the all-industry average (around ¥330,000) is the root cause of the chronic talent outflow.
Turnover is equally serious. The same ministry’s “Survey on Employment Trends” (FY2024) shows the separation rate in accommodation and food services at 25.1% — the highest of any sector. With a hiring rate of 28.4%, the spread is just 3.3 points, perpetuating a “revolving door” pattern in which most new hires leave within a short period. On top of that, around 62% of ryokans and hotels nationwide report receiving no applicants for their job postings — meaning a majority of properties cannot even secure entrants to the recruitment funnel.
Against this labor backdrop, the first round of 2026 Shunto results compiled by Rengo recorded a 5.26% wage increase. Even small-and-mid-size unions (under 300 workers) hit 5.05% — the third consecutive year above 5%. Upward pressure on labor costs is unavoidable in lodging as well, and how each property passes that increase through to room rates has become the watershed determining survival.
| Indicator | Accommodation & Food Service | All-Industry Avg. | Gap |
|---|---|---|---|
| Average monthly wage | ¥269,500 | ~¥330,000 | −~¥60,000 |
| Separation rate (2024) | 25.1% | ~15% | +~10pt |
| Job-opening-to-applicant ratio | 2.53x | 1.18x | +1.35x |
| Unfilled vacancy rate | 67% | 59% | +8pt |
| 2026 Shunto wage hike | 5.26% | 5.26% | — |
Sources: MHLW “Basic Survey on Wage Structure”, “Survey on Employment Trends”, “General Employment Placement Status”; Rengo “2026 Shunto First Response Tabulation”
→ Related reading: Ryokan Succession Crisis: 89 Bankruptcies & 30% Without Heirs in 2025
ADR Trends in 6 Major Cities: A Pass-Through “Temperature Gap”
According to MetroEngines Research data, as of March 2026 ADR in all six major cities remained positive year-on-year, but the rate of increase varies sharply. Kyoto leads at +18.6% YoY, with Tokyo also posting double-digit growth at +11.1%. Fukuoka, however, came in at just +2.7% — below the 5.26% wage hike rate.
Why does this gap exist? In Kyoto and Tokyo, which directly benefit from inbound demand, the strong willingness-to-pay of foreign visitors makes price pass-through possible. In contrast, Fukuoka and Osaka, which rely more on domestic business demand, have a structural pricing inflexibility from corporate contracts and intense competition that makes aggressive rate hikes difficult.
Source: MetroEngines Research, compiled by HotelBank Editorial Team (N=7,990 properties, March 2026)
Worth noting: ADR level and YoY growth rate are not necessarily proportional. Osaka has the lowest ADR among the six cities at ¥24,900, yet posts a relatively strong +9.5% YoY. This likely reflects the unwinding of the 2025 Expo base effect on the comparison baseline, with Osaka’s own organic inbound demand now driving prices in 2026 onward.
14-Month YoY Trend: Polarization Is Accelerating
Looking at the past 14 months of ADR YoY data, there is a clear inflection point from summer 2025. Kyoto surged from +6.4% in September 2025 to +19.1% in December 2025, and has stayed in the +17–19% range into 2026. Tokyo similarly normalized at double-digit growth from autumn 2025 onward.
By contrast, Fukuoka bottomed out at +1.0% in August 2025 and has since stayed in a narrow +2–8% band — and the gap with Kyoto and Tokyo keeps widening. In other words, only Kyoto, Tokyo, and Hokkaido may realistically be absorbing the 2026 Shunto’s 5.26% wage hike through price pass-through alone.
Source: MetroEngines Research, compiled by HotelBank Editorial Team
CPI Lodging Index vs. Wage Growth
The Statistics Bureau’s CPI lodging index (2020 = 100) stood at 167.2 in March 2026 — about 67% above the pre-COVID 2019 level. On a YoY basis, however, it slowed to +5.0%, down from +9.3% in November 2025.
Overlaying the 2026 Shunto’s 5.26% wage hike yields an interesting pattern. During the second half of 2025, when CPI lodging YoY (+5.3% to +9.3%) ran above the wage hike rate, the market overall was managing to “keep up” with labor cost pass-through. But as we move into 2026, with CPI growth settling around +5.0–6.0% while wages remain at +5.26%, the room for further pass-through is gradually narrowing.
Source: Statistics Bureau “CPI” lodging (2020 = 100), Rengo “2026 Shunto”; compiled by HotelBank Editorial Team
Why? Because CPI is a national average, and in reality urban areas with high inbound exposure are pushing rates above CPI, while many regional properties cannot achieve even CPI-level increases. A national average of +5% likely masks an extreme split — “Tokyo and Kyoto +15%, regional areas +0–2%” — and reading the average alone misses the essence.
→ Related reading: National Avg ADR Hits Record ¥32,340 (May 2026): +19% in 3 Years from CPI & Cost Pass-Through
ADR Level × YoY Matrix: A 4-Quadrant Analysis
Here we plot the six major cities on a scatter chart of ADR level (x-axis) versus YoY change (y-axis), and classify them into four quadrants. Setting the x-axis threshold at the median across the six cities (about ¥28,300) and the y-axis threshold at the 5.26% Shunto wage hike, each city’s combination of “pricing power” and “price level” becomes visible at a glance.
Source: MetroEngines Research, compiled by HotelBank Editorial Team (March 2026 data)
| Quadrant | Profile | Cities | Pass-Through Assessment |
|---|---|---|---|
| High ADR × High YoY | Premium-priced and rising | Kyoto, Tokyo | Pass-through headroom |
| High ADR × Low YoY | Premium but slowing | Hokkaido, Fukuoka | Passing through but decelerating |
| Low ADR × High YoY | Lower-priced but rising | Osaka, Okinawa | Catching up |
| Low ADR × Low YoY | Lower-priced and flat | (None among the 6 cities) | Pass-through difficult; high bankruptcy risk |
While none of the six major cities falls into the “Low ADR × Low YoY” quadrant, the picture changes when we look at business hotels specifically. Business-hotel ADR is just ¥13,400 (N=331) in Fukuoka and ¥14,200 (N=488) in Osaka — extremely low per-room rates. For these properties, absorbing a 5%+ labor cost increase requires either a substantial occupancy uplift or a fundamental rethink of the cost structure.
Bankruptcy Statistics Reflect a Geographic Concentration of “Unsustainability”
According to Teikoku Databank, lodging-industry bankruptcies in 2025 totaled 89 cases (+14.1% YoY), with 178 voluntary closures/dissolutions, for a combined 267 hotel operators exiting the market. What stands out is the regional skew: outside the three major metro areas (Greater Tokyo, Keihanshin, Chukyo), “regional” Japan accounted for 75.3% of cases — close to the pre-pandemic 2019 level (77.2%).
The drivers of bankruptcy include the burden of zero-zero loan repayments combined with compounding cost pressures from labor shortages, raw material costs, and utility expenses. Notably, “facility aging” was the direct trigger in 14.6% of bankruptcies over the past five years — an uptrend from 13.0% in 2016–2020 and 8.9% in 2011–2015. The squeeze between rising costs and constrained pass-through is reaching its limit at small regional properties unable to keep up with capital investment.
Source: Teikoku Databank “Lodging Industry Bankruptcies & Closures Trends” (annual editions); compiled by HotelBank Editorial Team
Overlay this regional concentration on the ADR data and a clear correlation emerges. Even within the six major cities, Fukuoka’s +2.7% YoY is below the Shunto wage hike — and at smaller regional properties, ADR growth is plausibly near zero or even negative in many cases. The concentration of bankruptcies in regional Japan is the result of a structural ceiling on price pass-through colliding with a triple squeeze of labor costs, utilities, and repair expenses.
Business Hotel ADR Spread: An Intra-Category Divide
Looking by category, the “limit line” of price pass-through becomes even sharper. In March 2026, business-hotel ADR was highest in Kyoto at ¥20,200 (N=327), followed by Tokyo at ¥19,500 (N=903). Fukuoka, at ¥13,400 (N=331), and Osaka at ¥14,200 (N=488), come in at just 66–70% of Kyoto’s level.
Business hotels are a category with a relatively high labor-cost ratio. Unlike full-service city hotels, they have no F&B revenue to cushion personnel costs, so room-rate growth directly determines absorption capacity. For properties with ADR in the ¥13,000–14,000 range, absorbing a 5%+ wage hike implies a roughly 0.4–0.5 point margin compression on revenue — a non-trivial burden for already thin-margin operators.
| Prefecture | ADR | vs. Kyoto | Sample (N) |
|---|---|---|---|
| Kyoto | ¥20,200 | 100% | N=327 |
| Tokyo | ¥19,500 | 96% | N=903 |
| Okinawa | ¥16,100 | 80% | N=194 |
| Hokkaido | ¥15,300 | 76% | N=405 |
| Osaka | ¥14,200 | 70% | N=488 |
| Fukuoka | ¥13,400 | 66% | N=331 |
Source: MetroEngines Research, compiled by HotelBank Editorial Team
→ Related reading: Business Hotel Price Surge: National ADR Analysis & 10 Cost-Effective Prefectures
Conclusion: Where Does the Sustainability Tipping Point Lie?
The data analysis in this article reveals the following picture.
First, labor-cost pass-through in Japan’s hotel industry is not progressing uniformly nationwide. Kyoto and Tokyo are pushing through ADR increases of +11–19% YoY — two to three times the Shunto wage hike — while Fukuoka, at +2.7%, has not even reached half. This gap is rooted in structural factors such as the presence or absence of inbound demand, property class, and competitive intensity, and is unlikely to close in the short term.
Second, the regional concentration revealed by Teikoku Databank’s bankruptcy data — 75.3% of cases occurring outside the three metropolitan zones — is the flip side of this pricing-power gap. Even among the six major cities Fukuoka’s YoY trails the wage hike, so the operating environment for smaller regional properties is presumably even tougher.
Third, the slowdown of CPI lodging YoY to around +5% in 2026 suggests the market-wide pace of pass-through is decelerating. If CPI lodging clearly falls below the wage hike rate, the squeeze on profitability will intensify further.
The tipping point for sustainability in lodging boils down to a single question: can labor cost increases be passed through to room rates? The gap between properties that can — through inbound demand or premium-value strategies — and those that cannot is likely to widen further. The “polarization of management” Teikoku Databank highlights is clearly corroborated by ADR data as well.
Note on forward-dated ADR: ADR figures in this article are averages of OTA-listed advertised rates at the time of survey and shift as check-in dates approach. Currently elevated rates may decline through last-minute discounting.
Related Reading
- National Avg ADR Hits Record ¥32,340 (May 2026): +19% in 3 Years from CPI & Cost Pass-Through
- Ryokan Succession Crisis: 89 Bankruptcies & 30% Without Heirs in 2025
- Weekday ADR in Tokyo, Nagoya, Osaka & Fukuoka: Business Demand Recovery 2026
- Business Hotel Price Surge: National ADR Analysis & 10 Cost-Effective Prefectures
- Labor Cost Pass-Through ADR Surge: Decoding Japan’s 2026 Hotel Pricing via OCC-ADR Divergence
References: MHLW “FY2024 Basic Survey on Wage Structure”, Teikoku Databank “Lodging Industry Bankruptcies & Closures (2025)”, JILPT “Rengo’s 2026 Shunto First Response Tabulation”, JTA “Overnight Travel Statistics Survey”