

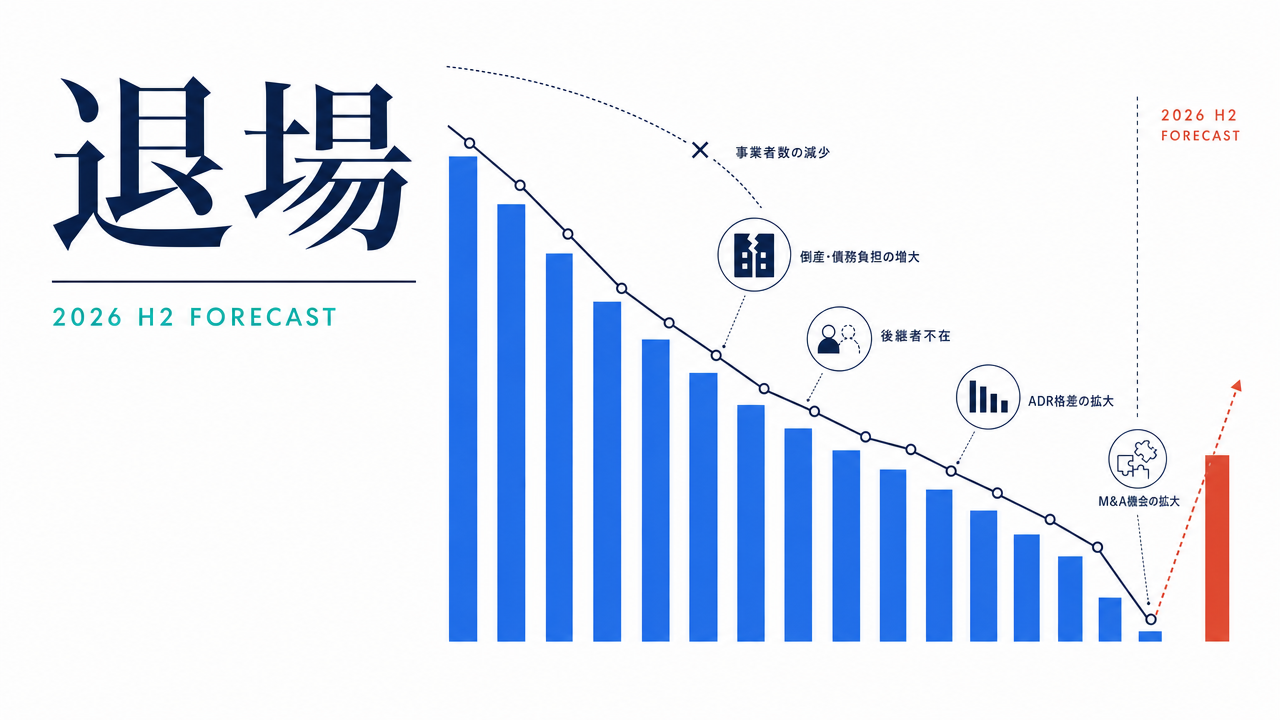
In H1 2026 (January-June), hotel and ryokan bankruptcies in Japan totaled 36 cases with liabilities of ¥18.31 billion — a marginal year-on-year decrease, but a sharp +24.1% increase versus the previous half-year (Teikoku Databank). Furthermore, Tokyo Shoko Research warns that the peak repayment period for COVID-era “Zero-Zero loans” (effectively zero-interest, unsecured government-backed loans) will concentrate in April-September 2026. This article focuses on the “exit side” of the market, using OTA public price data to quantitatively examine the H2 2026 bankruptcy re-acceleration scenario — including regional ADR gaps, structural vulnerabilities of mid-sized ryokan, and M&A opportunities for REITs and major chains.
Metric Definitions Used in This Article
- ADR (Average Daily Rate): The average of publicly displayed selling prices on OTAs and other channels. This differs from actual transaction prices (reconciliation with REIT disclosure data shows displayed ADRs tend to run +25-30% higher than transacted ADRs). Per-room rate for double occupancy (tax included), averaged across all plans (room-only through plans with meals).
- Exit: Includes bankruptcies (legal proceedings with debts of ¥10 million or more) plus voluntary closures and dissolutions — all forms of market exit.
- Data Sources: MetroEngines Research, Teikoku Databank, Tokyo Shoko Research, Japan Tourism Agency “Overnight Travel Statistics Survey”
H1 2026 Shows Marginal Decline, But “+24.1% Versus Previous Half” Signals Re-Acceleration
According to the latest statistics released by Teikoku Databank in August 2026, hotel and ryokan operator bankruptcies in January-June 2026 reached 36 cases with total liabilities of ¥18.31 billion. While this represents a decrease of 2 cases from the same period a year earlier (38), what deserves attention is the +24.1% re-acceleration versus the previous half-year (July-December 2025 = 29 cases). Total liabilities doubled at +116.0% versus the previous half-year, signaling a “chain of mid-sized bankruptcies” in which liability amounts are swelling faster than case counts.
After 73 cases in full-year 2024 and 89 cases in full-year 2025, the trend has shifted back to growth from the post-COVID-peak rebound decline (118 cases in 2020). Furthermore, in 2025, when adding 178 voluntary closures and dissolutions to bankruptcies, a total of 267 lodging operators exited the market. This quiet “resigned shutdown” — accelerating beneath the surface — is two sides of the same coin as the structural problem of a 60.7% successor-absent rate (Teikoku Databank 2025 survey). For an in-depth look at where succession is breaking down for long-established ryokan, our analysis of the structural drivers and survival conditions of Japan’s ryokan succession crisis examines the underlying factors.
Source: Teikoku Databank “Lodging Industry Bankruptcies and Closures Trends” via MetroEngines Research & Consulting
The Final Peak of Zero-Zero Loan Repayments — The Time Bomb of April-September 2026
According to Tokyo Shoko Research, the COVID-era “effectively zero-interest, unsecured (Zero-Zero) loans” were utilized by approximately 301,000 borrowers. About 80% of these had grace periods of two years or less, and the final repayment peak arrives in April-September 2026. As of February 2026, cumulative bankruptcies following Zero-Zero loan use reached 2,280, with the share of service-sector cases — including lodging and tourism-related businesses — expanding.
While the lodging industry has shown surface-level revenue recovery from “inbound tourism rebound” and “nationwide travel support” programs, it faces serious labor shortages, soaring labor and outsourcing costs, and rising utility and food-material prices. In H2 2026, “inability to secure repayment funds” cases are likely to emerge in a chain reaction among operators whose grace periods expire. In fact, in June 2026, the long-established Kumamoto City hot spring ryokan “Chomeikan” (founded in 1914, debts of approximately ¥300 million) began bankruptcy proceedings, marking the start of long-standing operator exits.
Source: Tokyo Shoko Research “Post-Zero-Zero Loan Bankruptcies”, Teikoku Databank via MetroEngines Research & Consulting
“Regional Ryokan That Cannot Raise Prices” — Identifying Prefectures Under High Exit Pressure
The simplest indicator of exit pressure is the “ADR growth rate.” Operators unable to raise ADR amid inflation and rising labor costs cannot bear the weight of fixed costs, and their cash flow deteriorates. Aggregating MetroEngines Research data on ADR trends across all 47 prefectures from April 2025 to April 2026 revealed clear disparities at the regional bloc level.
Source: MetroEngines Research, MetroEngines Research & Consulting (N=18,839 properties, April 2026 aggregate)
While Kinki (+23.5%), Kanto (+12.6%), and Tokai (+11.6%) drive the overall market, Kyushu (+3.1%), Tohoku (+6.7%), Chugoku (+7.3%), and Shikoku (+7.9%) barely exceed the national inflation rate (CPI of approximately 2.9%). At the prefecture level, Tottori (-5.8%), Miyazaki (-2.6%), and Ibaraki (-0.7%) posted negative growth, indicating that price pass-through has not progressed at all.
| Region | Avg. YoY | Prefectures | Exit Pressure |
|---|---|---|---|
| Kyushu | +3.1% | 7 | Highest (Miyazaki, Saga, Kumamoto) |
| Okinawa | +6.2% | 1 | High (resort polarization) |
| Tohoku | +6.7% | 6 | High (Aomori, Yamagata, Akita) |
| Chugoku | +7.3% | 5 | Medium (Tottori negative) |
| Shikoku | +7.9% | 4 | Medium (Ehime, Kochi) |
| Hokuriku | +8.1% | 3 | Medium |
| Hokkaido | +10.2% | 1 | Low (inbound demand) |
| Koshinetsu | +10.8% | 3 | Low |
| Tokai | +11.6% | 4 | Low |
| Kanto | +12.6% | 7 | Low |
| Kinki | +23.5% | 6 | Lowest (Kansai Expo effect) |
Ryokan in Kyushu and Tohoku rely primarily on local customers with low price elasticity, and the benefits of inbound demand are limited. Fixed costs (labor, utilities) rise in line with inflation, while ADRs remain essentially flat — this “revenue squeeze” is the true nature of exit pressure. For the breakpoint of sustainability viewed through the lens of labor cost pass-through and ADR trends, our analysis of labor cost pass-through and bankruptcy risk in the lodging industry verifies the threshold using ADR data.
The Structure: Mid-Sized Ryokan (30-80 Rooms) as the Largest Exit Segment
“Small and mid-sized ryokan” tend to be lumped together, but viewed by room-count scale, the exit segment is clear. Aggregating room-count distributions for operating ryokan in MetroEngines Research data, properties with “fewer than 30 rooms” account for approximately 75-85% in major prefectures nationwide, while “30-80 rooms” make up about 15-20%, and “over 80 rooms” only a few percent.
Micro-ryokan with fewer than 30 rooms have a high share of family-run and sole-proprietor operations; with small fixed costs, they are surprisingly resilient. Meanwhile, mid-sized ryokan in the 30-80-room range are “corporate organizations employing 10-30 staff,” where labor costs, social insurance contributions, and building maintenance weigh heavily as fixed costs. Capital recovery for facility renovations requires decades, and when no successor exists, neither sale nor rebranding is feasible.
Source: MetroEngines Research, MetroEngines Research & Consulting (Operating ryokan, 10 major prefectures, N=3,159 properties)
This segment is simultaneously the main battleground of the M&A and succession market. Major chains targeting this size band as rehabilitation candidates include Kyoritsu Maintenance (Dormy Inn, Kyoritsu Resort), Itoen Hotels, and Ooedo Onsen Monogatari (GENSEN HOLDINGS, operating 73 properties after the TAOYA brand integration) — all focused on the 30-80-room range. Properties under 30 rooms lack economic rationale, while major REIT-affiliated competitors move first on properties over 80 rooms.
REITs and Major Chains: “Prefectures to Target vs. Prefectures to Avoid”
Areas where exits are progressing can, from a different perspective, be viewed as “areas with greater consolidation potential.” Looking at occupancy and ADR from REIT monthly operating data, Japan Hotel REIT (8985) reports OCC of 85.1%, Invincible Investment Corporation (8963) 87.6%, and Nippon Hotel & Residential Investment Corporation (3472) 88.7% — major REIT-operated properties consistently maintain high occupancy. In contrast, mid-sized regional ryokan in target areas are estimated to be struggling in the low 60% range, with the gap in operational capability producing a more than 20-percentage-point occupancy differential.
Source: Each REIT’s monthly operating data via MetroEngines Research & Consulting (as of February-March 2026)
Prefectures to target (high investor opportunity) share three traits: “low ADR growth rates but clear tourism resources,” “delayed entry of out-of-prefecture capital and therefore lower acquisition multiples,” and “improving infrastructure and airport access.” Specifically, Kyushu (especially Saga, Kumamoto, Oita), Tohoku (Aomori, Yamagata, Fukushima), and Shikoku (Ehime, Kochi) stand out. These regions have tourism resources — hot springs, nature, history — but remain untouched by capital-led rehabilitation from the Tokyo metropolitan area.
Conversely, prefectures to avoid feature “structurally shrinking underlying demand,” “low alternative land-use value relative to building deterioration,” and “population decline rates exceeding 10%.” Micro-ryokan in remote mountain interior areas tend to fall into this category, and post-closure properties effectively remain as “non-rehabilitable stock.”
New Openings vs. Exits — The Reality of Supply Turnover
In full-year 2025, 1,603 properties opened, far exceeding the 267 market exits. But looking at the breakdown, new openings led with rental villas (661 properties), business hotels (266), guesthouses (113), cottages (105), and resort hotels (98), while ryokan accounted for only 54 properties. Given that ryokan account for a large share of the exit side, a clear pattern emerges of business-type conversion from “ryokan → rental villas, business hotels, guesthouses.”
Source: MetroEngines Research “New Opening Data”, Teikoku Databank “Lodging Industry Bankruptcies and Closures” via MetroEngines Research & Consulting
This shift reflects changes in tourist accommodation styles (rising individual travel, family travel, and long-stays), but the impact on regional economies cannot be ignored. The closure of a single mid-sized ryokan means the loss of 15-30 jobs and the local food-supply network. The rental villas and guesthouses that open in their place employ only 2-5 people, in some cases reducing local economic ripple effects to less than one-tenth.
Four Implications for Readers — For Investors, Local Governments, and Operators
(1) M&A Opportunities from the Investor Perspective: The window of 60.7% successor-absence x pre-bankruptcy succession concentrates in H2 2026. Succession-style M&A executed before Zero-Zero loan repayment defaults can be pursued as healthy acquisitions without debt restructuring. Filtering by three conditions — mid-sized ryokan (30-80 rooms) x ADR growth area of 3-8% x hot spring resources — promising deals concentrate in Kyushu, Tohoku, and Shikoku.
(2) Movements of REITs and Private Funds: Urban-type REITs such as Mori Trust Hotel REIT, Kasumigaseki Hotel REIT, and Nippon Hotel & Residential will continue concentrating capital in high-ADR areas like Tokyo, Osaka, and Kyoto. Meanwhile, Hoshino Resorts REIT (59 properties) and Invincible Investment Corporation (104 properties) have significant room to expand resort and regional-type portfolios. Private funds, with more relaxed yield hurdles, may take the lead on regional ryokan rehabilitation deals.
(3) Major Chain Rehabilitation Speed Benchmarks: Kyoritsu Maintenance captures business demand through its Dormy Inn format and advances ryokan rehabilitation through its Kyoritsu Resort format. Ooedo Onsen Monogatari completed brand integration with Yukai Resort in 2024 (73 properties) and perfected low-labor-cost buffet-style operations. Itoen Hotels is rebranding mountain-interior hot spring resorts at the fixed price point of “¥7,800 per night with two meals included.” The acquisition speed and operational-conversion period (6-18 months from acquisition to profitability) of these three companies form the realistic benchmark for regional ryokan rehabilitation. We covered a concrete case of a 100-year-old ryokan rebranding in our piece on the boutique hotel “mont” opening in Nozawa Onsen, which conveys the implementation image of the rehabilitation scheme.
(4) Exit Strategy Design for Local Governments and Public Support: Local governments are increasingly developing support measures such as closed-school hotel conversions, Park-PFI (public-proposal-based) frameworks for public land, and hometown tax x accommodation voucher sales. What matters is investing public funds in schemes that “secure successors before closure,” and the current prioritization of supporting property preservation after closure deserves reconsideration. Comprehensive design connecting the Japan Tourism Agency’s Lodging Industry Foundation Strengthening Subsidy with the SME Agency’s Business Succession and Handover Subsidy is required.
Conclusion — H2 2026 Becomes a Market Driven by the “Exit Side”
In H2 2026, the final peak of Zero-Zero loan repayments (April-September) and regional disparities in ADR growth will progress simultaneously, making it highly likely that an “exit chain” centered on mid-sized ryokan will re-accelerate. Annual bankruptcies could exceed 90 cases, and total market exits including voluntary closures may reach the 300-case range.
However, exits represent not the “death of the market” but the “entry point of reorganization.” Mid-sized ryokan in Kyushu, Tohoku, and Shikoku with 30-80 rooms and hot spring resources will become the main battlefield of the M&A market, in tandem with the 60.7% successor-absence succession window. The movements of investors, major chains, and local governments will each shape the lodging market landscape from 2026 into 2027.
About This Article’s Forecast: This article’s bankruptcy re-acceleration forecast is a qualitative scenario based on actual figures through June 2026 and the Zero-Zero loan repayment peak period identified by Tokyo Shoko Research. Actual bankruptcy counts will fluctuate based on external factors (monetary policy, inbound trends, natural disasters, etc.). Investment decisions should not be based solely on this article; please combine it with individual credit reviews and succession diagnostics.
Related Articles
- Ryokan Succession Crisis — 89 Bankruptcies and 30% Successor Absence: Structure and Survival Conditions
- Labor Cost Pass-Through and Bankruptcy Risk in Lodging: The Sustainability Threshold via ADR Data
- Hotel Investment in the Nankai Trough 80% Era — Disaster Risk x ADR x Risk-Adjusted Yield Analysis Across 10 Pacific Coast Destinations
- Nagoya Hotel Investment 2026 — Conrad Opening x Luxury Vacuum x Postponed Linear Shinkansen Shape a New Scenario
- Rebranding a 100-Year-Old Ryokan: Boutique Hotel “mont” Opens in Nozawa Onsen
- Atami Ryokan Deep Dive (April 2026): Market Structure and ADR Trends Across 76 Properties and 2,508 Rooms
References and Sources
– Bankruptcy and Exit Statistics
- Teikoku Databank “Lodging Industry Bankruptcies and Closures Trends (2025)”
- Kanko Keizai Shimbun “Hotel and Ryokan H1 Bankruptcies: 36 Cases, ¥18.3 Billion in Liabilities” (August 2026)
- Tokyo Shoko Research “February Post-Zero-Zero Loan Bankruptcies: 27 Cases, with Concerns of Further Increase Ahead of the Final Repayment Peak” (March 2026)
- Tokyo Shoko Research “January 2026 Post-Zero-Zero Loan Bankruptcies: 28 Cases”
- Teikoku Databank “National Enterprise ‘Successor Absence Rate’ Trend Survey (2025)”
– Case Studies
- Ryoko Shimbun “Hot Spring Ryokan ‘Chomeikan’ (Kumamoto City), Founded in 1914, Begins Bankruptcy Proceedings”
- KAB “Kumamoto Prefecture Corporate Bankruptcies: 72 Cases, ¥17.5 Billion in Total Liabilities — Doubled Year-on-Year”
– M&A and Chain Trends
- Kyoritsu Maintenance Hotel Business
- Ooedo Onsen Monogatari (GENSEN HOLDINGS)
- Nihon M&A Center “M&A and Succession Trends in the Hotel, Ryokan, and Hot Spring Facility Industry (Latest 2025)”
– Price and REIT Data
- MetroEngines Research — OTA Public Price Data (47 prefectures, approx. 27,000 properties, April 2025-April 2026 aggregate)
- Each REIT’s monthly operating data (Invincible Investment Corporation (8963), Japan Hotel REIT Investment Corporation (8985), Hoshino Resorts REIT Investment Corporation (3287), Nippon Hotel & Residential Investment Corporation (3472), Ichigo Hotel REIT Investment Corporation (3463), Kasumigaseki Hotel REIT Investment Corporation (401A), Mori Trust Hotel REIT Investment Corporation (8961))