

Bankruptcies in the hotel and ryokan industry reached 89 cases in calendar year 2025, the second consecutive year of increase. The first half of 2026 saw 36 cases and ¥18.31 billion in liabilities—a marginal decline on the surface—but the real test is yet to come. From April to September 2026, the start of repayments following the grace period for “Zero-Zero Loans” (effectively zero-interest, unsecured COVID emergency loans) will reach its “final peak.” Operators unable to cover repayments from profits amid rising costs are increasingly requesting loan restructuring from financial institutions, and exits among small and mid-sized tourism operators are highly likely to re-accelerate in H2 2026.
Metric Definitions Used in This Article
- ADR (Average Daily Rate): Average of published prices on online booking sites and other channels. Differs from actual contracted prices. Per-room rate for double occupancy (tax included), average across all plan types (room-only through plans with meals).
- Exit Risk Score: A proprietary composite indicator combining four z-scored factors: ADR growth rate (negative correlation), share of buildings 40+ years old, ryokan share, and mid-size (30-80 room) share. Higher values indicate greater exit pressure.
- Building Age Ratio: Share of facilities 40+ years old (built before 1985) among properties with known opening dates in our database.
- Data Sources: MetroEngines Research, Teikoku Databank, Tokyo Shoko Research, Japan Tourism Agency.
H1 2026 at 36 Cases Looks “Mildly Down,” But Zero-Zero Loan Final Peak Hits April-September
According to Kanko Keizai Shimbun and Teikoku Databank compilations, hotel and ryokan operator bankruptcies in H1 2026 (Jan-Jun) totaled 36 cases with ¥18.314 billion in liabilities. Year-over-year, this represents a 2-case decrease, appearing to suggest deceleration. However, the full-year trend shows 65 cases in 2023 → 78 in 2024 → 89 in 2025—two consecutive years of growth exceeding +14% annually—so calling this a slowdown would be premature.
The drivers can be summarized in four points. First, the deepening labor shortage. Second, inflation in labor costs, outsourcing fees, utilities, and food costs. Third, rising sales costs including OTA commissions. Fourth, the full-scale start of Zero-Zero Loan repayments. The fourth factor in particular, according to Tokyo Shoko Research analysis, will reach its “final peak” of repayment starts from April through September 2026, strongly signaling accelerating bankruptcies in the second half.
Source: Teikoku Databank “Bankruptcy and Dissolution Trends in the Lodging Industry” and Tokyo Shoko Research “Post-Zero-Zero-Loan Bankruptcy Trends,” compiled by MetroEngines Research
For full-year 2025, market exits totaled 267 cases combining 89 bankruptcies and 178 voluntary closures/dissolutions. By region, areas outside the three major metropolitan zones accounted for 75.3%, again approaching the pre-pandemic 2019 level of 77.2%. This figure shows how two pressures—geographic concentration of inbound demand and rising labor burdens—are working intensively against the capital cushions of small and mid-sized regional operators.
Identifying “Prefectures That Can’t Raise Prices” — 47-Prefecture ADR Growth Map
We quantitatively verify the structure of regional exit concentration using ADR data. Comparing prefectural ADR for April 2025 versus April 2026 (N=27,300+ properties) compiled by MetroEngines Research reveals extreme disparities in ADR growth. Prefectures that captured inbound demand or expectations from the Expo and Linear Chuo Shinkansen—Kyoto (+14.6%), Nagano (+21.1%), Aichi (+25.0%), Kanagawa (+38.6%)—have made double-digit growth routine.
On the other hand, prefectures centered on regional ryokans—Tottori (-5.8%), Miyazaki (-2.6%), Ibaraki (-0.7%), Aomori (+0.5%), Ehime (+0.9%), Yamagata (+1.2%)—are tracking around +1% YoY or even negative. Growth below the inflation rate (CPI around 2.7%) means these operators cannot even pass through rising labor and utility costs, directly translating into exit pressure through margin compression. The background of these prefectural disparities arising as the national average ADR hits a record ¥32,340 is structurally decomposed in our analysis National Average ADR Hits Record ¥32,340 (May 2026).
Source: MetroEngines Research (April 2025 → April 2026, N=27,301 properties), compiled by MetroEngines Research
Exit Risk Score — Composite of 4 Axes: ADR Stagnation × Aging × Ryokan Share × Mid-Size Share
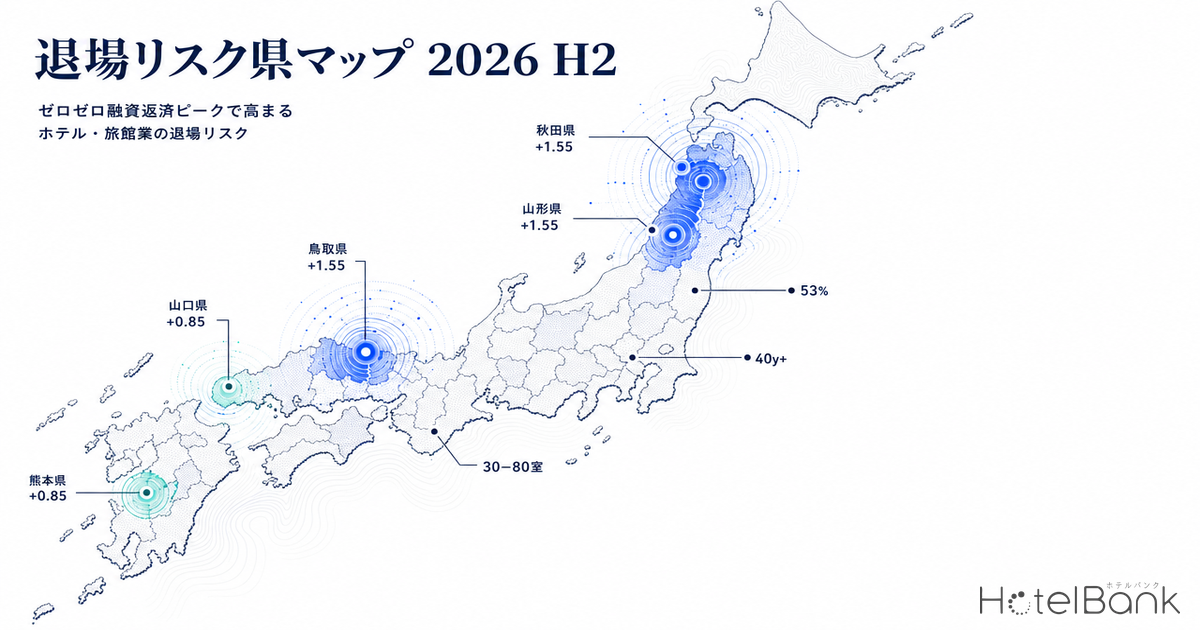
Exit pressure cannot be captured by any single indicator. In this article, we constructed a proprietary “Exit Risk Score” by z-scoring and combining four factors: ADR growth rate (negative correlation), share of buildings 40+ years old, ryokan share, and mid-size (30-80 room) share. Higher values indicate stronger exit pressure.
The result: the highest risk is Tottori (1.55). With ADR declining YoY (-5.8%), buildings 40+ years old at 53.0%, and ryokans accounting for 45.5%, it shows the classic “aging × declining earning power” structure. Next come Yamagata (1.23), Akita (0.93), Yamaguchi (0.67), and Kumamoto (0.49). These are considered the areas most likely to see the first wave of exits during the full-scale Zero-Zero Loan repayment phase in H2 2026.
Source: MetroEngines Research (4-factor z-score composite, N=46 prefectures), compiled by MetroEngines Research. *Nara excluded as an outlier due to new luxury openings.
Exit Structure by Regional Block — Tohoku and Chugoku Stand Out
Grouping prefectures into regional blocks, the 6 prefectures of Tohoku (average score 0.53) and the 5 prefectures of Chugoku (average 0.52) stand out prominently. Both blocks average ADR growth around 7%, below the national average; share of buildings 40+ years old exceeds 30%; and ryokan share is 36-43%. By contrast, Kansai (-0.32) and Kyushu/Okinawa (-0.23) have raised ADR by capturing inbound demand, leaving them under relatively weaker exit pressure.
Notable is the bipolarization in Chubu (average 0.01). While metropolitan and tourism-driven prefectures like Nagano, Aichi, and Kanagawa have low risk, Sea-of-Japan-side and Hokuriku-area prefectures—Fukui (0.42), Mie (0.42), Ishikawa (0.35), Toyama (0.33)—carry risk levels comparable to Chugoku. Even within the same region, large gaps have emerged between tourism-led prefectures and others.
Source: MetroEngines Research (simple average across 8 regional blocks), compiled by MetroEngines Research
The Largest Exiting Segment Is “Mid-Size Ryokans” — 30-80 Rooms, Economy-to-Mid Price Range
By operating format, the front line of exits is mid-size (30-80 room) ryokans and economy hotels. In our database, 4,847 properties across the 47 prefectures fall into the mid-size zone (17.8% of total). This zone cannot enjoy the scale benefits of large-scale operations due to its small size, yet existing capital structures make it too heavy to pivot to high-rate, lean operations (rebranding to 10-20 luxury rooms). It sits in the “valley between two strategies.”
A symbolic case is the hot-spring ryokan “Chomeikan” in Kumamoto City. Founded in 1914 (Taisho 3) as a long-established inn, it underwent a renovation in 2007 using financial institution loans, but the dual blows of the Lehman shock and COVID drove revenue down. Annual revenue for the year ended June 2023 was about ¥50 million; it filed for self-bankruptcy on March 31, 2025, with bankruptcy proceedings beginning on June 10 (liabilities approximately ¥300 million). The Lehman-era renovation investment inflated fixed costs, leaving only heavy debt at a demand level that never fully recovered—highlighting a structural vulnerability common to mid-size ryokans.
Source: MetroEngines Research (mid-size 30-80 rooms, operating properties, N=27,301), compiled by MetroEngines Research
Reader Implication ① — M&A Opportunity Map from an Investor Perspective
Exit-side data is, viewed from the other side, an opportunity map for “buyers.” According to Nihon M&A Center’s latest 2025 trends, the hotel, ryokan, and bathing facility industries are seeing rapid growth in succession needs among small and mid-sized operators against a backdrop of lack of successors, building aging, financing constraints, and declining profitability. At the same time, against the backdrop of inbound recovery and continued yen weakness, investment appetite from domestic and international hotel chains, real estate investors, and funds remains extremely strong.
Worth noting is the potential progression of bipolarization into “prefectures that get picked up” and “prefectures that get left behind.” REITs and private funds are likely to continue concentrating capital in Kyoto, Osaka, Tokyo, Fukuoka, Okinawa, and Hokkaido (Sapporo, Niseko)—where both ADR growth and occupancy can be verified. Meanwhile, the mid-size ryokans of Tohoku and Chugoku with high Exit Risk Scores may head toward “give-up closures” without buyers if major chain rehabilitation cannot keep pace.
Three-tier structure of M&A target prefectures (hypothesis):
①Tier 1 (major chains & REIT competition): Kyoto, Tokyo, Osaka, Fukuoka, Okinawa, Sapporo, Niseko. Sold via competitive bidding with price tags.
②Tier 2 (mid-tier operators & regional funds): Nagano, Kanagawa, Chiba, Shizuoka, Aichi. Transactions are concluded on the premise of rebranding.
③Tier 3 (buyer-absent zones): 6 Tohoku prefectures, 5 Chugoku prefectures, 3 Hokuriku prefectures, parts of Shikoku. Difficulty with succession is likely to drive “give-up closures.”
Reader Implication ② — Major Chains’ Rehabilitation Speed Benchmark
The major players who may rescue the “buyer-absent zone” of Tier 3 are major chains pursuing low-price, large-scale strategies. The leading examples are three group operators: Ooedo Onsen Monogatari Hotels & Resorts (renamed GENSEN HOLDINGS in September 2025 after absorbing Yukai Resort), Itoen Hotels, and Kyoritsu Maintenance (Kyoritsu Resort).
| Operating Company | Main Brands | Acquisition Targets | Operating Style |
|---|---|---|---|
| GENSEN HOLDINGS (formerly Ooedo Onsen Monogatari) |
Ooedo Onsen Monogatari Yukai Resort |
Struggling regional ryokans and public lodges | Rehabilitation through buffet format and low-price strategy |
| Itoen Hotels | Itoen Hotel | Hot-spring resort areas, large ryokans | Flat-rate two-meal-inclusive pricing to attract guests |
| Kyoritsu Maintenance | Dormy Inn Kyoritsu Resort |
Business hotels, hot-spring-equipped facilities | Differentiated by large public baths and late-night noodles, mid-to-upper price range |
The rehabilitation speed of these three groups (annual count of acquired and operationalized properties) effectively serves as the benchmark determining whether Tier 3 exit hotels become abandoned/vacant or get back on a rehabilitation track. With the mid-tier operator layer currently thin, the gap between this “rehabilitation capacity” and “exit count” will become visible as a loss-of-regional-tourism-resources risk. As a parallel option for faster and cheaper branding than new construction, rebranding to foreign brands is also spreading.
Reader Implication ③ — Local Government Rehabilitation Support Menu: Closed Schools, Public Land, and Park-PFI
For buyer-absent zones, rehabilitation support menus from local governments hold the key. The Ministry of Land, Infrastructure, Transport and Tourism’s Park-PFI program (established by the 2017 Urban Park Act revision) is a public-private partnership scheme where private operators install revenue facilities including food service and lodging inside urban parks, using the revenue to maintain paths and plazas. Parks with tourism clusters (Kanazawa Castle ruins, around Himeji Castle, Miyajima, etc.) offer scope for use as hotel/ryokan rehabilitation sites. Specific Park-PFI utilization scenarios and investment payback projections for Tier 3 areas warrant detailed examination as a parallel route.
In addition, under the Cabinet Office’s small-scale PPP/PFI promotion measures, examples of converting closed schools and other public assets into hotels and lodging facilities are accumulating. When regional mid-size ryokans in the exit-preliminary group cannot independently raise rehabilitation capital, a route in which the local government temporarily acquires the asset and entrusts operation to mid-tier operators via Park-PFI or designated manager systems is highly likely to become a realistic solution that eases Tier 3 exits.
Reader Implication ④ — H2 2026 Bankruptcy Re-Acceleration Scenarios
Synthesizing this article’s analysis, two scenarios can be envisioned for hotel and ryokan bankruptcies in H2 2026.
Base case (around 95 annual bankruptcies): Zero-Zero Loan repayments proceed uniformly, and Tier 3 areas continue at a pace of 7-8 bankruptcies per month. The annual figure lands slightly above 2025 (89 cases).
Worse case (over 120 annual bankruptcies): Rising interest rates compound with delayed regional dispersion of inbound visitors, and capital strains emerge not only in Tier 3 but also among Tier 2 mid-tier operators. Exits exceed the acquisition capacity of mid-tier operators, and abandoned/vacant ryokans become conspicuous in regional tourism areas.
In either scenario, the center of exits is highly likely to concentrate on mid-size ryokans (30-80 rooms) in Tohoku, Chugoku, and Hokuriku. How investors, local governments, and major chains can coordinate becomes the watershed for maintaining and rehabilitating regional tourism resources. We will watch for next-period earnings disclosures and the monthly tallies from Teikoku Databank and Tokyo Shoko Research (particularly Q3 2026: July-September).
⚠ Note on this article: The Exit Risk Score is a proprietary indicator built from publicly available price data and supply structure; it does not reflect the financial condition or management judgment of individual operators. The three-tier structure of M&A target prefectures is a hypothesis, and actual transactions vary significantly by individual case. Please consult professionals for investment decisions.
Related Articles
References & Sources
■ Market Data
- MetroEngines Research — Online published price data (N=27,301 properties), prefectural ADR trends, property supply structure data
■ Bankruptcy & Closure Statistics
- Teikoku Databank “Bankruptcy and Dissolution Trends in the Lodging Industry (2025)”
- Kanko Keizai Shimbun “Hotel & Ryokan H1 Bankruptcies 36 Cases, ¥18.3 Billion Liabilities”
- Tokyo Shoko Research “February Post-Zero-Zero-Loan Bankruptcies at 27 Cases; Concern Over Surge as Final Repayment Peak Approaches”
- Tokyo Shoko Research “January 2026 Post-Zero-Zero-Loan Bankruptcies: 28 Cases”
■ Case Studies
- Ryoko Shimbun “Taisho-Era Founded Hot-Spring Ryokan ‘Chomeikan’ (Kumamoto City) Heads Into Bankruptcy Proceedings”
- JC-NET “Why Did That Long-Established Inn Fail? The ‘Invisible Crisis’ Facing a Kumamoto Hot-Spring Ryokan”
■ Successor & Business Succession
- Teikoku Databank “National ‘No-Successor Rate’ Trend Survey (2025)”
- Nihon M&A Center “Hotel, Ryokan, and Bathing Facility Industry M&A and Succession Trends: 2025 Latest”
■ Local Government & PPP