

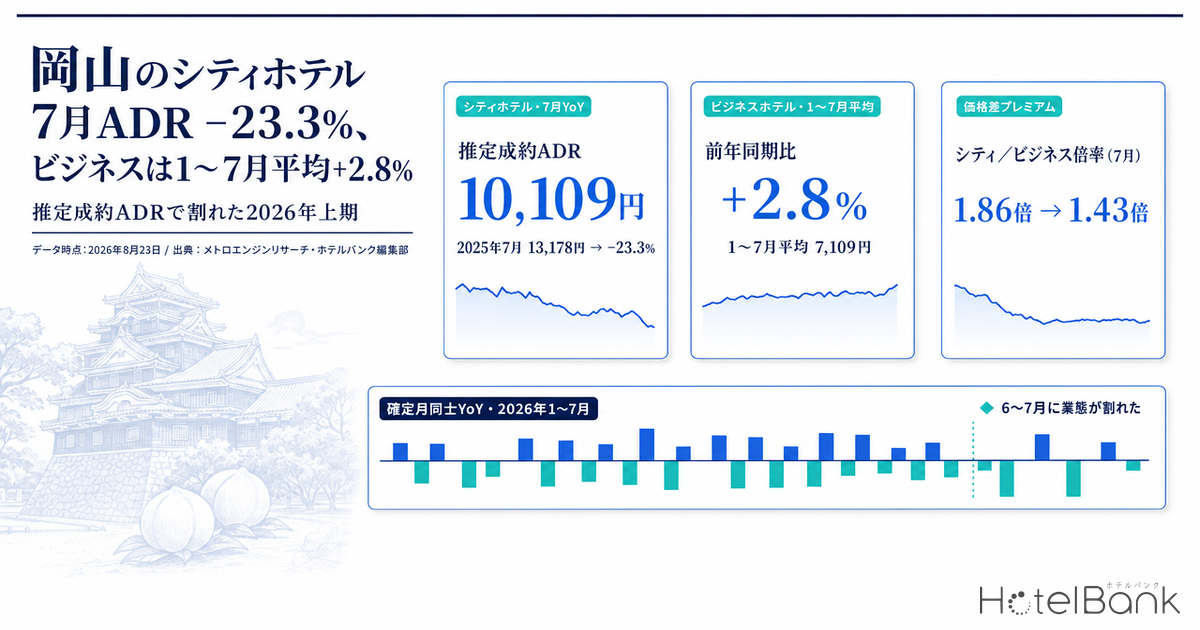
Okayama Prefecture’s lodging market split cleanly by segment in the second half of H1 2026. The settled ADR estimate for city hotels came to ¥10,109 in July 2026 — −23.3% against the ¥13,178 of July 2025, the two being finalized months that can be compared directly. June was also down, at ¥9,661 (−16.6%). Business hotels, by contrast, posted ¥7,069 in July (−0.3%) and averaged ¥7,109 across January–July, up +2.8% year on year — flat to modestly positive. Same prefecture, same months.
What is equally easy to miss is that city hotels had not been breaking down through the earlier part of the half. Their January–May average was −1.2% year on year, with March at +4.9% and May at +2.3% — both in positive territory. The decline is concentrated in the two months of June and July, which average −20.2%. This article breaks down Okayama’s price movements using year-on-year comparisons between finalized months only, then adds the demand side (estimated OCC) and booking pace for the September holiday run, in a form revenue managers running city or business hotels in Okayama can apply to their own property.
Coverage: Okayama Prefecture, city hotels N=17 properties and business hotels N=93 properties (both are the counts underlying the July 2026 settled ADR estimate). The price metric in this article is the settled ADR estimate (the transacted price level inferred from OTA and other sales data, tax-exclusive equivalent); occupancy is an estimate based on OTA-listed inventory. Both definitions appear at the end of the article. Data as of August 23, 2026.
- — City hotels, July 2026: ¥10,109, −23.3% year on year — but the comparison base, July 2025, was an outlier month at +15.0% over 2024. Measured against two years ago, the figure is −11.8%, so a payback effect and a genuine step down in level are mixed together.
- — Business hotels averaged ¥7,109 across January–July, +2.8% year on year (+10.1% versus two years ago). Within the same prefecture and the same months, the two segments moved in opposite directions.
- — The decline is concentrated in June–July (two-month average −20.2%). City hotels averaged −1.2% over January–May, a span that includes positive months — March +4.9% and May +2.3%.
- — Inventory stayed tight even in the months when prices fell — estimated OCC in June–July was 85.0–85.5% for city hotels and 86.9–88.5% for business hotels. A rate decline that occupancy cannot explain points to the pricing side rather than to demand.
- — The five-day September holiday run is a different product day by day — September 19 stood at 91.6% at 45 days out, with a mid-case landing of 98.7%. September 23, by contrast, moved just +1.4pt from 71.4% at 45 days out, and its mid-case landing stops at 88.3%.
City hotels were near flat from January to May; only June–July fell −20.2%
Start with the settled ADR estimate for Okayama city hotels (N=17–18 properties), with 2024, 2025 and 2026 overlaid. For 2026, January through July are finalized months; from August onward the series switches to an estimate based on current sales conditions, so those months are excluded from the comparisons below (the basis differs, so they are not compared directly against finalized values).
Source: MetroEngines Research; compiled by the HotelBank Editorial Team
Overlaying the three years, the 2026 line runs almost alongside 2025 through the first part of the year, and by May it edges above 2025 — ¥12,075 against ¥11,798. It then drops to ¥9,661 in June and stalls at ¥10,109 in July, in the low ¥10,000s. Because 2025 had climbed to ¥13,178 in July, the year-on-year gap peaked precisely in this stretch.
The level of the comparison base itself — July 2025 — deserves a closer look. City hotels stood at ¥11,457 in July 2024. That makes the ¥13,178 of July 2025 a +15.0% jump over the prior year: a month that was unusually high for that year alone. Comparing July 2026’s ¥10,109 against July 2024, two years earlier, gives −11.8%. It is fair to read the headline “down 23% in a year” as containing a substantial payback from the one-off overshoot of 2025. That said, since the level is also below where it stood two years ago, a portion remains that payback alone does not explain.
One more caveat when reading the city-hotel figures. The property count in this aggregation is 18 through January 2026 and 17 from February onward. With a base of 17 properties, a change in the pricing policy of a single hotel can move the overall median by several hundred yen, so it is risky to read month-to-month swings as “a market-wide consensus.” Adding to that, the base lost one property in February, so a shift in the property mix cannot be ruled out as explaining part of the level change. In what follows, that thinness is assumed: no conclusion rests on city hotels alone, and the series is read against business hotels (N=93–98 properties).
| Month | City 2025 | City 2026 | YoY | Business 2025 | Business 2026 | YoY |
|---|---|---|---|---|---|---|
| January | ¥11,382 | ¥10,702 | −6.0% | ¥6,371 | ¥6,992 | +9.7% |
| February | ¥11,457 | ¥10,574 | −7.7% | ¥6,658 | ¥7,134 | +7.1% |
| March | ¥11,234 | ¥11,784 | +4.9% | ¥7,052 | ¥7,292 | +3.4% |
| April | ¥11,302 | ¥11,365 | +0.6% | ¥6,886 | ¥7,037 | +2.2% |
| May | ¥11,798 | ¥12,075 | +2.3% | ¥7,389 | ¥7,561 | +2.3% |
| June | ¥11,582 | ¥9,661 | −16.6% | ¥6,948 | ¥6,680 | −3.9% |
| July | ¥13,178 | ¥10,109 | −23.3% | ¥7,092 | ¥7,069 | −0.3% |
| Jan–Jul average | ¥11,705 | ¥10,896 | −6.9% | ¥6,914 | ¥7,109 | +2.8% |
Okayama Prefecture, settled ADR estimate (tax-exclusive equivalent). City hotels N=17–18 properties, business hotels N=93–98 properties. All comparisons are between finalized months. Source: MetroEngines Research; compiled by the HotelBank Editorial Team
Business hotels averaged +2.8% across January–July — Okayama’s floor has not moved
Business hotels over the same period (N=93–98 properties) trace an entirely different shape. Starting from +9.7% in January and +7.1% in February, the series held its upward tilt while the margin narrowed — +3.4% in March, +2.2% in April, +2.3% in May — then landed roughly level with the prior year at −3.9% in June and −0.3% in July. The January–July average is ¥7,109, +2.8% year on year. With a base of more than 90 properties, this figure is not easily pulled around by the price moves of any single hotel.
Setting it against two years ago sharpens the outline further. Business hotels in July 2026 (¥7,069) are +10.1% over July 2024 (¥6,420), so the two-year uptrend remains intact. City hotels, on the same two-year comparison, are −11.8%. The picture is not one of Okayama’s lodging market weakening as a whole, but of the upper price band alone stepping down from the prior year. Segments diverging in sign is not unique to Okayama; the same shape appears in neighboring prefectures. For a Chugoku-region comparison, Yamaguchi’s settled ADR estimate in H1 2026: business +3.4%, city hotels −6.4% sits within the same finalized-month year-on-year framework.
Source: MetroEngines Research; compiled by the HotelBank Editorial Team
This polarization also shows up in the price gap between the two segments. Expressing the city-hotel settled ADR estimate as a multiple of the business-hotel figure, July 2025 stood at 1.86x while July 2026 narrowed to 1.43x. June likewise compressed, from 1.67x to 1.45x. March through May, meanwhile, ran at 1.59–1.64x in 2025 and 1.60–1.62x in 2026 — essentially unchanged — which shows that the compression of the price gap was also concentrated in June–July. Put another way, the premium of the upper segment thinned over the summer.
The supply side is worth checking as well. Twelve lodging facilities opened in Okayama Prefecture in 2026, of which three fall in the business-hotel category, totaling 856 rooms. The larger projects, however, open in August and October — later than the June–July movement in the settled ADR estimate. The June–July decline therefore cannot be explained as a direct consequence of new supply in 2026. Read together with the occupancy side discussed below, treating it as a move on the pricing side is the more consistent reading.
Occupancy did not fall — June–July estimated OCC and the shape of the week
Was demand itself contracting in June–July, when prices fell? Okayama’s estimated OCC (based on OTA-listed inventory) was 85.0% in June and 85.5% in July 2026 for city hotels, and 86.9% in June and 88.5% in July for business hotels (observed properties: 15–16 for city hotels, 83–88 for business hotels). At least in terms of clearing listed inventory, both segments ran at high levels. This is not a case of inventory sitting unsold in months when rates fell by roughly 20%.
Averaging by day of week makes the difference in demand structure between the two segments clear. The table below averages daily estimated OCC for June and July 2026 by day of week (8–9 days per weekday).
| Day of week | Mon | Tue | Wed | Thu | Fri | Sat | Sun |
|---|---|---|---|---|---|---|---|
| City hotels, estimated OCC | 82.0% | 84.7% | 85.3% | 87.9% | 85.7% | 90.1% | 81.5% |
| Business hotels, estimated OCC | 84.4% | 89.4% | 91.0% | 92.4% | 86.6% | 90.3% | 79.2% |
Okayama Prefecture: daily estimated OCC (based on OTA-listed inventory) for June–July 2026, averaged by day of week. Observed properties: 15–16 city hotels, 83–88 business hotels. Source: MetroEngines Research; compiled by the HotelBank Editorial Team
Business hotels peak on Thursday at 92.4%, with Tuesday, Wednesday and Thursday lined up in the 89–92% range, and bottom on Sunday at 79.2%. The spread between the strongest and weakest weekday is 13.2pt — a straightforward reflection of weekday business travel as the core of demand. City hotels peak on Saturday at 90.1% and bottom on Sunday at 81.5%, a spread of 8.6pt. Business hotels on Thursday (92.4%) sit above city hotels on Saturday (90.1%), meaning that in Okayama inventory tightens more for “business hotels midweek” than for “city hotels on the weekend.” Looking at single days, the strongest July day for city hotels was July 18 at 98.6%, and business hotels peaked on the same July 18 at 98.4%. A structure in which business hotels peak midweek rather than at the weekend has been observed in other prefectures as well; Hokkaido’s business hotels are not “weekend-led” breaks down estimated OCC by day of week in detail.
The five-day run from September 19 was already in the 90s at 45 days out
The entrance to the second half is worth checking too. In 2026, Respect for the Aged Day falls on September 21 and the Autumnal Equinox on September 23, making the intervening September 22 a public holiday as well (National Astronomical Observatory of Japan, “Calendar Essentials for Reiwa 8 (2026): National Holidays”). The result is a five-day run from Saturday September 19 through Wednesday September 23. Booking pace for these holiday dates was compared against ordinary dates using booking curves running from 45 days before the stay date to the latest observation.
Okayama Prefecture, business hotels, estimated OCC (based on OTA-listed inventory). Latest observation as of August 22, 2026. Source: MetroEngines Research; compiled by the HotelBank Editorial Team
For business hotels, September 19 was already at an estimated OCC of 91.6% at 45 days out (stay date September 19, 2026, 45 days before the stay). The comparable ordinary Saturday, September 5, stood at 69.2% at 45 days out, so the two started 22.4pt apart. September 19 kept building from there, reaching 97.0% at the latest observation (28 days before the stay), with the share of properties showing no confirmable listed inventory at 70.5%. Monday September 21 (Respect for the Aged Day) also rose, from 81.4% at 45 days out to 90.4% at the latest observation (30 days out), with the same share at 44.3%.
The back half of the same holiday run has a different shape. Wednesday September 23 (Autumnal Equinox Day) was at 71.4% at 45 days out and 72.8% at the latest observation (32 days out) — a gain of just 1.4pt from 45 days out. The ordinary weekday of Wednesday September 9 went from 68.3% at 45 days out to 76.2% at the latest observation (18 days out), +7.9pt, and the ordinary Saturday of September 5 built from 69.2% to 78.6% (14 days out), +9.4pt. September 23 is pacing more slowly than ordinary dates, not faster. Rather than treating the holiday run as a single bullish block, the first, middle and final days need to be handled as separate demand. For how to translate this way of reading pace into day-to-day operations, Booking curves need only three points — an operating framework at 45 days, 30 days and the final stretch, measured in Okayama sets out the approach.
City hotels (16 properties observed) point the same way: September 19 was at 92.9% at 45 days out and 93.9% at the latest observation (28 days out), and September 21 moved from 89.8% to 93.3%. September 23, by contrast, went from 76.0% to 77.3%, and the ordinary weekday of September 9 from 71.4% to 73.8%. Saturday October 3 stood at 76.6% (business hotels) and 83.9% (city hotels) at 45 days out, and remains at roughly the same level at the latest observation (42 days out).
Landing ranges for the second half — the September holidays and early October in three scenarios
Pace clearly differs from one holiday date to the next. The next step is to convert that into a range for how far each date can still build. The tool here is how readily remaining inventory clears. For periods whose stay dates have already passed, the share of the inventory remaining at a given point that cleared by the day before the stay is calculated day by day, and the range is taken from that distribution.
The definition is: remaining-inventory absorption rate = (estimated OCC on the day before the stay − estimated OCC at the reference point) ÷ (100 − estimated OCC at the reference point). Measured over the 61 stay dates in Okayama Prefecture falling between June 1 and July 31, 2026 (60 valid days; 59 for some city-hotel snapshots), the 30-days-out snapshot for business hotels gives a first quartile of 49.1%, a median of 56.1% and a third quartile of 71.4%; for city hotels the figures are 30.5%, 41.6% and 46.6%. Business hotels have more room to build in the final stretch.
Assigning those quartiles to pessimistic, mid and optimistic cases and applying them to the latest observation for each stay date produces the table below. Because the landing value is calculated as “latest observation + absorption rate × (100 − latest observation),” it cannot exceed 100% by definition.
| Stay date | Segment | Latest observation (snapshot) | Pessimistic | Mid | Optimistic |
|---|---|---|---|---|---|
| Sep 19 (Sat, first day of the run) | Business | 97.0% (28 days out) | 98.5% | 98.7% | 99.1% |
| Sep 21 (Mon, Respect for the Aged Day) | Business | 90.4% (30 days out) | 95.1% | 95.8% | 97.3% |
| Sep 23 (Wed, Autumnal Equinox Day) | Business | 72.8% (32 days out) | 86.3% | 88.3% | 92.4% |
| Oct 3 (Sat, ordinary weekend) | Business | 77.6% (42 days out) | 89.5% | 91.0% | 94.1% |
| Sep 19 (Sat, first day of the run) | City | 93.9% (28 days out) | 95.7% | 96.4% | 96.8% |
| Sep 21 (Mon, Respect for the Aged Day) | City | 93.3% (30 days out) | 95.3% | 96.1% | 96.4% |
| Sep 23 (Wed, Autumnal Equinox Day) | City | 77.3% (32 days out) | 84.4% | 86.5% | 88.0% |
| Oct 3 (Sat, ordinary weekend) | City | 84.1% (42 days out) | 89.3% | 91.3% | 92.4% |
Estimated OCC is based on OTA-listed inventory. Absorption rates come from the measured distribution across June–July 2026 stay dates (60 valid days; 59 for part of the city-hotel series). Latest observation as of August 22, 2026. Source: MetroEngines Research; compiled by the HotelBank Editorial Team
Three things stand out. First, September 19 sits at 98.5% for business hotels and 95.7% for city hotels even in the pessimistic case — a level that can be planned around as effectively sold out. Second, September 23 lands at 88.3% for business hotels and 86.5% for city hotels in the mid case, roughly 10pt below the first day. But the spread between the pessimistic 86.3% and the optimistic 92.4% is 6.1pt, which also makes it the date where action has the most leverage. Third, October 3 has a low latest observation, but that reading comes from an early snapshot 42 days out; in the mid case it recovers to 91.0% for business hotels and 91.3% for city hotels. There is no need to cut rates early on the basis of today’s room count alone.
To apply this to your own property, the fastest route is to look at two axes: inventory at the latest snapshot and the absorption rate you assume. The table below puts the absorption-rate distribution for Okayama business hotels at the 30-days-out snapshot across the columns, and the level of the latest observation down the rows.
| Latest obs. \ Absorption | 1st decile 32% | 1st quartile 49% | Median 56% | 3rd quartile 71% | 9th decile 76% |
|---|---|---|---|---|---|
| Latest obs. 70% | 79.6% | 84.7% | 86.8% | 91.4% | 92.9% |
| Latest obs. 75% | 83.0% | 87.3% | 89.0% | 92.8% | 94.1% |
| Latest obs. 80% | 86.4% | 89.8% | 91.2% | 94.3% | 95.3% |
| Latest obs. 85% | 89.8% | 92.4% | 93.4% | 95.7% | 96.5% |
| Latest obs. 90% | 93.2% | 94.9% | 95.6% | 97.1% | 97.6% |
Absorption rates come from the measured distribution for Okayama business hotels at the 30-days-out snapshot across June–July 2026 stay dates (60 valid days). Estimated OCC is based on OTA-listed inventory. Source: MetroEngines Research; compiled by the HotelBank Editorial Team
Here is how to use it. If your own property is at 75% for September 23 as of 30 days out, market-level absorption lands you at 89.0%, and even a slow year gets you to 83.0%. Conversely, a date sitting below 70% reaches only 86.8% on median absorption and sinks to 79.6% on the pessimistic side. Decide which dates to move selling conditions on using this landing range, not the absolute number of rooms left. Note that the absorption distribution is measured over two summer months, and there is no guarantee the same distribution repeats in September–October, when the demand mix differs. Anchoring on the lower bound of the range is the safer choice.
For revenue managers running city and business hotels in Okayama — implications and an action plan
1. Before reading a year-on-year decline, question the year you are comparing against. The −23.3% for city hotels in July comes against a July 2025 that was itself +15.0% over July 2024 — an outlier month. Even if your own July is negative, setting it beside the level of two years ago may produce a different picture. At market level, July 2026 is −11.8% against July 2024, which means it also sits below where it stood two years ago. Keep the two-year comparison as a permanent third yardstick alongside the single prior year, so that “the part that gave back a spike” and “the part that stepped down in level” can be explained separately to management.
2. Inventory was tight in the months when prices fell. City hotels in June–July saw their settled ADR estimate fall 20.2% on a two-month average, while estimated OCC held high at 85.0% and 85.5%. A price decline that occupancy cannot explain points to the pricing side rather than to a shortfall in demand. For your own June–July, start by putting occupancy and rate on the same screen and counting how many days were “full but below last year’s rate.”
3. The premium of the upper segment thinned over the summer. The city-to-business ratio of the settled ADR estimate narrowed from 1.86x in July 2025 to 1.43x in July 2026. March through May held around 1.6x in both years, so this is a summer-specific compression rather than a full-year structural change. On the city-hotel side, there is room to check whether product differences (food and beverage, room size, late checkout and the like) are still reflected in price now that the distance to the segment below has narrowed. On the business-hotel side, the same move is material for considering headroom above, as the higher price band has moved closer.
4. The shape of the week differs by segment. Business hotels run Thursday 92.4% against Sunday 79.2%, a 13.2pt spread; city hotels run Saturday 90.1% against Sunday 81.5%, an 8.6pt spread. Both segments share Sunday as the weakest day, but their peaks split between Thursday and Saturday. Rather than setting a day-of-week rate calendar by segment convention, confirm from your own data whether Thursday or Saturday is your peak, then rebuild it.
| Horizon | Action | Decision trigger (figures from this article) | Objective |
|---|---|---|---|
| Today–this week | Re-check how remaining rooms for September 19–21 are being sold | Market business hotels are at an estimated OCC of 97.0% for September 19 (stay date September 19, 2026, 28 days before the stay) and 90.4% for September 21 (30 days out). If your own inventory on those dates is running well above that | Avoid leaving business on the table in the first half of the run |
| Today–this week | Take stock of June–July results on the two axes of occupancy and rate | The market held estimated OCC at 85.0–88.5% while the city-hotel settled ADR estimate fell 20.2% on a two-month average. If your property shows the same shape (high occupancy, falling rate) | Identify where pricing can be revisited |
| Within two weeks | Rebuild selling conditions for September 23 and October 3 individually | September 23 moved only +1.4pt, from 71.4% at 45 days out to 72.8% at the latest observation, slower than an ordinary Saturday (+9.4pt) or an ordinary weekday (+7.9pt). October 3 is likewise flat from 45 days out | Reduce vacancy risk on the final holiday day and in early October |
| Within two weeks | Redraw the day-of-week rate ladder from Thursday and Saturday | Business hotels run Thursday 92.4% and Sunday 79.2%; city hotels run Saturday 90.1% and Sunday 81.5%. If your peak weekday differs from the market’s | Stop leaving rate on the table on high-occupancy weekdays |
| Looking to next month | Change the H1 2027 pricing plan to a format that also shows two years back | At market level, city hotels read −23.3% year on year but −11.8% against two years ago, and business hotels −0.3% year on year but +10.1% against two years ago — a different conclusion either way | Set targets that are not whipsawed by single-year payback |
| Looking to next month | Add one metric that tracks the price gap between the upper and lower segments monthly | The city-to-business ratio went from 1.86x in July 2025 to 1.43x in July 2026. If your own position against the market has compressed similarly | Understand the room to rebuild the premium |
Source: MetroEngines Research; compiled by the HotelBank Editorial Team
Summary — three yardsticks for reading Okayama
Yardstick 1: Okayama cannot be read without separating the segments. Across January–July 2026 the settled ADR estimate averaged ¥10,896 for city hotels (−6.9% year on year) and ¥7,109 for business hotels (+2.8%). For this period, a prefecture-level statement that “Okayama went up” or “Okayama went down” simply does not hold.
Yardstick 2: The decline is confined to June–July. City hotels averaged −1.2% over January–May, a span that includes positive months — March +4.9% and May +2.3%. Only June–July is at −20.2%, and its comparison base, July 2025, was an outlier month at +15.0% over July 2024. Make a habit of reading the period and the comparison base together.
Yardstick 3: Read occupancy and the holiday run separately. Estimated OCC in June–July was high, in the 85–88% range, so the fall in price and weakness in occupancy did not occur together. At the entrance to the second half, September 19 stands out at 91.6% from 45 days out, while September 23 has moved just +1.4pt from the same point. Treating each day of the same holiday run as a separate product is the starting assumption for Okayama’s second half.
About the Data
• Definition of estimated OCC: occupancy based on OTA-listed inventory = 100 − 100 × rooms still listed on OTAs ÷ total rooms. It is an estimate based on how inventory offered for sale on OTAs is clearing, and its definition differs from actual room occupancy (it reads higher). This article covers Okayama Prefecture, for the months of June and July 2026 (daily results) and for stay dates in September and October 2026 (pace snapshots).
• Booking curves: based on observations from 45 days before the stay date through the latest observation. Latest observation as of August 22, 2026.
• Definition of the settled ADR estimate: a transacted price level (tax-exclusive equivalent) inferred from OTA and other sales data (lowest-plan level × segment coefficient, ensembled across multiple channels). Past months are finalized values; the current and future months are estimates based on current sales conditions. Median error against published operating results is 6.6%. Year-on-year figures in this article are calculated between finalized values only (January 2024 through July 2026); August 2026 onward is on a different basis and is not used for comparison.
• Breakdown of N: for the settled ADR estimate, city hotels N=18 properties (January 2024–January 2026) / N=17 properties (February–July 2026), business hotels N=93–98 properties. For estimated OCC, observed properties are 15–16 city hotels and 83–88 business hotels. For booking curves, observed properties are 81–87 business hotels (81–85 at 45 days out, 84–87 at the latest observation) and 16 city hotels. Note that the city-hotel base is thin at 17–18 properties, so a change in the pricing policy of a single property can move the overall level.
• Data as of: August 23, 2026. Sales conditions and inventory change daily, so the figures in this article are a snapshot as of the time of retrieval.
References and Sources
■ Data sources
The settled ADR estimate, estimated OCC and booking curves are compiled by aggregating publicly listed OTA price and inventory data collected by our company, by prefecture (Okayama) and by segment (MetroEngines Research). Coverage is N=17–18 city hotels / N=93–98 business hotels for the settled ADR estimate, and 15–16 city hotels / 83–88 business hotels observed for estimated OCC. The September 2026 holiday layout follows the National Astronomical Observatory of Japan, Ephemeris Computation Office, “Calendar Essentials for Reiwa 8 (2026): National Holidays.”
■ Calculation assumptions
Year-on-year changes are calculated between finalized values only (January 2024 through July 2026); August 2026 onward, where the series switches to a listing-based estimate, is not used for comparison. Landing ranges are defined as remaining-inventory absorption rate = (estimated OCC on the day before the stay − estimated OCC at the reference point) ÷ (100 − estimated OCC at the reference point), with the first quartile, median and third quartile of the measured distribution across the 61 stay dates falling between June 1 and July 31, 2026 (60 valid days; 59 for some city-hotel snapshots) assigned to the pessimistic, mid and optimistic cases. The landing value = latest observation + absorption rate × (100 − latest observation), which cannot exceed 100% by definition.
■ Limitations and caveats
The city-hotel base is thin at 17–18 properties, so a change in the pricing policy of a single property can move the overall level by several hundred yen. The base lost one property in February 2026, so a shift in the property mix cannot be excluded as explaining part of the level change. Estimated OCC is based on OTA-listed inventory and its definition differs from actual room occupancy (it reads higher). The absorption distribution is measured over two summer months, and there is no guarantee the same distribution repeats in September–October, when the demand mix differs. The settled ADR estimate carries a median error of 6.6% against published operating results and is not an individual property’s actual result.
■ Market data
• National Astronomical Observatory of Japan, Ephemeris Computation Office, “Calendar Essentials for Reiwa 8 (2026): National Holidays” https://eco.mtk.nao.ac.jp/koyomi/yoko/2026/rekiyou261.html (Respect for the Aged Day September 21, Autumnal Equinox Day September 23, September 22 a public holiday)
Related Reading
- Okayama Booking Curves: 3 Checkpoints, Aug 8 Late-Surges +11.8pt
- Yamaguchi Settled ADR H1 2026: Business +3.4%, City Hotels −6.4%
- Hiroshima 2026: 1,003 New Rooms, City Settled ADR Turns -4.1% in July
- Hyogo Hotel ADR H1 2026: City -12.4% in June, Business -0.4%
- Kanagawa ADR Splits: City Hotels +20.9%, Business −1.7% in June 2026
- Hokkaido Business Hotels Aren’t Weekend-Led: Thu 95.4% Ties Sat 95.4%
- Osaka Settled ADR June 2026: City -26.3%, Business -32.8% Post-Expo
- Hokkaido Silver Week: Sep 20 Peaks, Ryokan 96.4%, Only Business Dips