

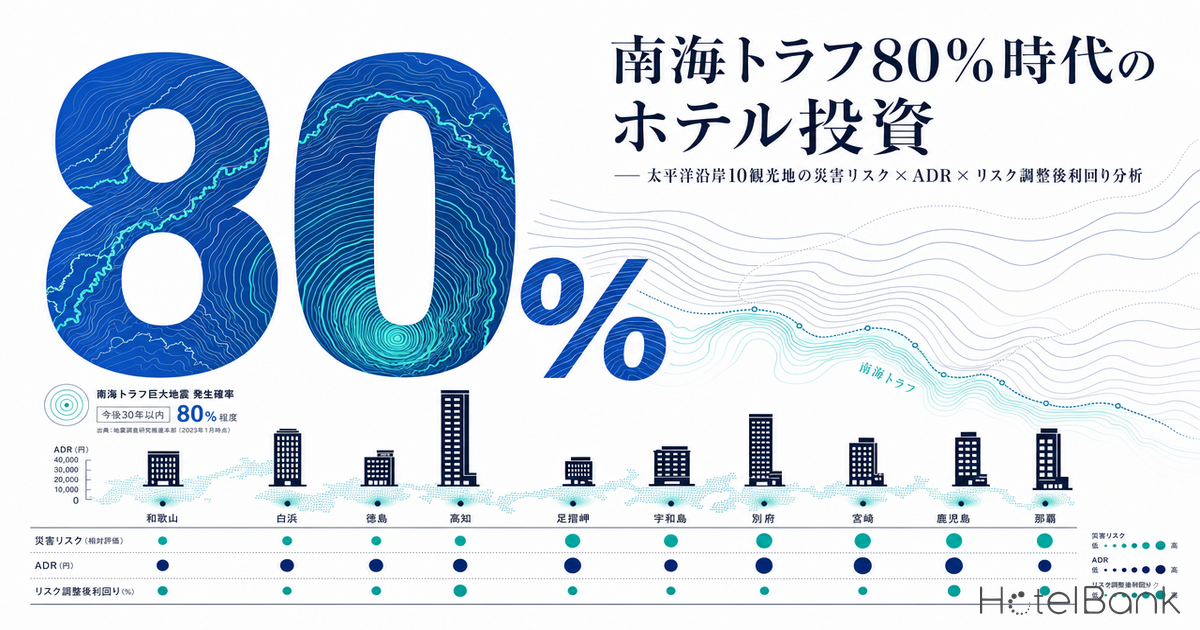
In September 2025, the Japanese government’s Earthquake Research Committee raised the 30-year probability of a Nankai Trough megaquake to “approximately 60-90% or higher.” The Tokyo Inner-City earthquake is also assessed at “70% within 30 years,” and the Pacific coast areas spanning the Tokyo metropolitan, Kinki, Shikoku, and Tokai regions have entered a phase where a major event “could happen at any time.” The Noto Peninsula earthquake forced all 20 ryokan in Wakura Onsen to fully suspend operations, and even two years post-disaster, fewer than half have resumed business. This article takes a forward-looking view of unrealized risk, integrating disaster hazards, OTA-published ADR, and risk-adjusted GOP yield across 10 Pacific coast tourist destinations (Atami, Ito, Shimoda, Lake Hamana, Shiono-misaki, Toba, Shima, Kochi, Takamatsu, Tokushima). For investment consideration, we derive insights from objective data on “which destinations” and “with what disaster-resilience specifications” hotels should be built.
Metric Definitions Used in This Article
- ADR (Average Daily Rate): Average of sale prices published on OTAs. April-May 2026, per-room rate (tax included) for 2 guests/1 room, all-plan average (room only through plans with meals). Differs from actual transaction prices.
- OCC (Estimated Occupancy): Ratio of sold rooms to total room count by prefecture (estimated from OTA sales inventory, early May 2026, weekday basis).
- Disaster Risk Counts: Feature counts of tsunami, storm surge, flood, and landslide hazards within a 3×3 tile (z=13, approximately 2km square) centered on each tourist destination, retrieved from MLIT’s Real Estate Information Library API.
- Composite Risk Score: Weighted aggregate of tsunami (weight 0.5) + storm surge (0.15) + flood (0.20) + landslide (0.15). Relative value within the 10 destinations, max 100.
- Risk-Adjusted GOP Yield: Calculated as gross yield (ADR x estimated OCC x 365 x GOP 30% / construction cost JPY 18M per room) minus risk drag (composite risk score x 0.03ppt; equivalent to earthquake insurance premium + depreciation reserve). Simplified model; actual investment decisions require individual feasibility studies. OCC uses prefectural level (early May 2026, weekday basis).
- Data Sources: MetroEngines Research & Consulting (OTA-published price aggregation), MLIT Real Estate Information Library (disaster hazards)
Key Conclusion — Investment Ranking by Risk-Adjusted GOP Yield
Evaluating the 10 destinations on the dual axes of disaster risk and ADR level, Atami (risk-adjusted GOP yield 26.28%) and Shima/Kashikojima (23.10%) ranked at the top. What both share is topography where tsunami inundation zones lie outside the central commercial area (Shima sits on the inner Ago Bay; Atami’s high-rise hotels cluster on the mountainside) and the existence of luxury demand at ADR levels in the JPY 50,000 range. For background on the structural shifts in the Atami market (analysis of 76 ryokan with 2,508 rooms, F1 segment shift, ADR trends), see Atami City Ryokan Deep Dive (April 2026). Conversely, Takamatsu (risk-adjusted 7.45%) and Tokushima (5.68%) ranked at the bottom. While occupancy itself is a healthy 75-77% — comparable to the national average — ADR remains stuck in the JPY 16,000-21,000 range, exposing a structure where returns fail to compensate for the high disaster risk (composite scores of 85.1 and 62.1). In areas projected to take a direct hit from the Nankai Trough event, investment decisions must factor in the risk drag (earthquake insurance premium + depreciation reserve equivalent).
Nankai Trough and Tokyo Inner-City — Significance of the Government’s Probability Revision
On September 26, 2025, the government’s Earthquake Research Committee revised the 30-year occurrence probability for the Nankai Trough earthquake from the previous “approximately 80%” to two ranges: “approximately 60-90% or higher” and “20-50%.” The recalculation, the first methodological revision in 12 years, incorporates uncertainty in uplift data from Murotsu Port. However, for disaster preparedness practice, the higher figure of “60-90% or above” was officially mandated for use. Damage projections forecast up to 320,000 fatalities and economic losses exceeding JPY 220 trillion.
For the Tokyo Inner-City earthquake, the Cabinet Office released a new damage projection in December 2025. An M7-class event has a 70% probability within 30 years, with a worst-case scenario of 18,000 fatalities and JPY 82 trillion in economic losses. Notable is that 650,000 to 880,000 stranded persons — including foreign tourists — are projected, making BCP for evacuation routes, multilingual guidance, and stranded-guest response a direct operational risk for the hotel industry.
These two megaquakes pose a common structural risk to Pacific coast tourist destinations: under the premise that “they will inevitably come someday,” the question is whether current construction costs, ADR, and yields adequately price in future insurance premiums and operational suspension risk. The Noto Peninsula earthquake illustrates how serious this becomes once the premise materializes. In Wakura Onsen, all 20 ryokan near the epicenter were forced to suspend operations, and two years on (end of 2025), only 9 have resumed. Aenokaze (Kagaya Group) plans to reopen in the first half of fiscal 2027, while some properties have opted for demolition and rebuilding. According to Teikoku Databank, Noto Peninsula earthquake-related bankruptcies reached 15 nationwide in 2024, and business closures/dissolutions in the four municipalities of Oku-Noto reached double the five-year pre-disaster average. Recovery trajectories two years post-disaster diverge significantly by area; actual ADR and reservation trends are analyzed in detail in Noto Peninsula 1 Year 4 Months: Wakura Onsen and Wajima Recovery Phase and Summer 2026 Booking Trends.
Disaster Hazards in 10 Destinations — Relative Risk via MLIT Data
From MLIT’s Real Estate Information Library API, we retrieved feature counts of disaster hazards (tsunami inundation zones, storm surge inundation, flood inundation, landslide warning zones) within a 3×3 tile (z=13, approximately 2km square) centered on each of the 10 Pacific coast destinations. This serves as a proxy indicator for officially designated hazard zone density. Tsunami counts were highest in Takamatsu (58) and Kochi/Katsurahama (50), exposing the structural vulnerability of Shikoku’s Pacific-coast cities. By contrast, Atami (2), Shima/Kashikojima (0), Shimoda (0), Shiono-misaki (0), and Toba (1) have remarkably few tsunami hazards, attributable to topography (ria-coast inner bays, narrow shorelines backed by steep mountains).
Excluding tsunami hazards, Tokushima (86 landslide, 78 storm surge, 55 flood) and Takamatsu (68 landslide, 53 storm surge) still face high compound disaster risk. This stems from major rivers like the Yoshino and Naka, the steep Shikoku mountain range, and the topography sandwiched between the Seto Inland Sea and the Pacific. Conversely, Shiono-misaki and Kushimoto have steep mountains pushing right up to the coast, making their built-up areas narrow with few hazard-affected facilities (tsunami 0, storm surge 0, flood 0). However, this should not be read as “safe”; rather, it means lower relative density on hazard maps. Actual damage projections must be cross-referenced with JMA and individual local government earthquake damage estimates.
ADR Level vs Disaster Risk — Positioning Analysis
Plotting ADR (April-May 2026, 2 guests per room, N=506 properties) against composite risk score for the 10 destinations on a scatter plot reveals a clear four-quadrant structure. Quadrant I “Low Risk x High ADR” hosts Atami, Shima/Kashikojima, and Toba, all achieving ADR above JPY 45,000. These represent investment “sweet spots.” Quadrant III “High Risk x Low ADR” contains Takamatsu and Tokushima, exposing the structural weakness of disaster risk lacking commensurate ADR premium. Estimated occupancy is a healthy 75-77%, but the low ADR significantly drags down risk-adjusted investment appeal.
Quadrant I Low Risk x High ADR
Atami, Shima/Kashikojima, Toba. Tsunami hazards extremely scarce; ADR exceeds JPY 45,000. Inner ria-coast bays and mountainside clustering provide topographic “escape routes.” The most attractive zone for investment.
Quadrant II Mid Risk x Mid ADR
Ito, Shimoda, Lake Hamana. Risk is moderate but ADR varies widely. New entrants have room to differentiate via disaster-resilience specs (seismic grade, upper-floor evacuation).
Quadrant III High Risk x Low ADR
Takamatsu, Tokushima, Kochi. Tsunami and compound hazards prominent, but ADR sits at JPY 16,000-22,000. Risk-adjusted GOP yield falls into negative territory. New large-scale investment requires careful judgment.
Risk-Adjusted GOP Yield Estimates in an Era of Soaring Construction Costs
We calculated gross yields and risk-adjusted GOP yields for the 10 destinations (assumptions: construction cost JPY 18M per room, GOP rate 30%, annual occupancy = OCC (estimated, prefectural level, early May 2026, weekday basis) x 365 days). The construction cost assumption is grounded in MLIT’s “Construction Starts Statistics,” which show 2024 hotel construction costs at an all-structure average of JPY 1.95M per tsubo, a sharp +41% spike vs 2022. The 30% GOP rate is a conservative downward adjustment from the 38.9% actual performance (December 2024 period) of 91 MHM-operated properties disclosed by Invincible Investment Corporation, applied to a first-year newly opened property scenario.
| Destination | Prefecture | N | ADR | OCC (Est.) | RevPAR | Composite Risk | Gross Yield | Risk-Adjusted |
|---|---|---|---|---|---|---|---|---|
| Atami | Shizuoka | 129 | ¥58,910 | 74.9% | ¥44,100 | 18.7 | 26.84% | +26.28% |
| Shima/Kashikojima | Mie | 24 | ¥52,008 | 74.4% | ¥38,700 | 14.7 | 23.54% | +23.10% |
| Toba | Mie | 36 | ¥46,780 | 74.4% | ¥34,800 | 12.1 | 21.17% | +20.81% |
| Ito | Shizuoka | 62 | ¥43,033 | 74.9% | ¥32,200 | 21.4 | 19.61% | +18.97% |
| Shimoda | Shizuoka | 85 | ¥28,769 | 74.9% | ¥21,500 | 13.9 | 13.11% | +12.69% |
| Shiono-misaki/Kushimoto | Wakayama | 13 | ¥21,958 | 73.0% | ¥16,000 | 1.6 | 9.75% | +9.70% |
| Kochi/Katsurahama | Kochi | 2 | ¥22,216 | 78.2% | ¥17,400 | 58.2 | 10.57% | +8.82% |
| Lake Hamana (Kanzanji) | Shizuoka | 3 | ¥22,086 | 74.9% | ¥16,500 | 58.3 | 10.06% | +8.31% |
| Takamatsu | Kagawa | 99 | ¥21,238 | 77.4% | ¥16,400 | 85.1 | 10.00% | +7.45% |
| Tokushima | Tokushima | 55 | ¥16,529 | 75.0% | ¥12,400 | 62.1 | 7.54% | +5.68% |
Estimated OCC uses prefectural-level OTA inventory-based estimates (early May 2026, weekday basis). Since each tourist destination is only a portion of its prefecture, actual area-level occupancy may diverge — readers should keep this caveat in mind. While risk-adjusted GOP yield came out positive across all 10 destinations, what stands out is the disparity in the size of the risk drag (risk score x 0.03ppt). Takamatsu’s risk drag of 2.55ppt is the largest, compressing gross yield from 10.00% down to 7.45%. By contrast, Shiono-misaki/Kushimoto registers only 0.05ppt. This gap directly translates into long-term holding costs from earthquake insurance premiums and depreciation reserves. Bearing in mind the recovery phase that long-established Wakura Onsen ryokan have walked — “full closure → 45% reopen rate at 2 years → new buildings emerging through 2027” — the opportunity costs of extended closure and rebuilding costs constitute latent losses this simplified model cannot capture.
Pacific Coast 10 Destinations Risk Map
We visualize the risk levels of the 10 destinations geospatially. Marker size reflects property count; color indicates composite risk score (blue: low, orange: medium, red: high).
Three Differentiation Axes for BCP and Disaster-Resilience Specifications — Implications for Investment Strategy
Given the Noto Peninsula earthquake and the government’s latest probability revision, hotel investment along the Pacific coast should be built on two axes: “site selection” plus “differentiation through disaster-resilience specifications.” Mitsui Fudosan’s published commercial-facility BCP includes 9,000 KVA emergency generators providing 72-hour power supply, 48-hour drainage tank capacity, and a 24-hour crisis management center. While these specs target apartments and offices, when long-term operational suspension risk is factored in, they serve as a valid reference model for standalone hotels as well.
1. Site Risk Screening
Prioritize Quadrant I destinations with low tsunami hazard density. Inner Ago Bay in Shima, mountainside clustering in Atami, inner Toba Bay — sites where topography ensures sufficient tsunami arrival time are themselves a hedge for long-term investment.
2. Built-in Disaster-Resilience Specs
Standardize seismic grade S, post-1981 new seismic standards (or higher), 72-hour autonomous power, on-site groundwater supply, and 48-hour-plus drainage tanks. Construction cost rises 5-10%, but long-term closure risk drops dramatically. As an investment frontier with low site risk, Park-PFI Hotel Development in Urban Parks offers a fresh option opened up by the Urban Parks Act revision.
3. BCP Insurance and Operating Contracts
Secure BCP earthquake compensation insurance (5-year contracts, up to 12-month revenue recovery period) and embed disaster-period employee retention clauses in management contracts. Wakura Onsen has seen ongoing trial-and-error use of employment adjustment subsidies; differences in contract design influence recovery speed.
Structural Challenges of Shikoku’s Pacific Coast (Takamatsu, Tokushima, Kochi)
The three Shikoku destinations that ranked at the bottom of risk-adjusted GOP yield in this analysis — Takamatsu, Tokushima, and Kochi — all sit in the projected direct-hit zone of the Nankai Trough event. JMA and MLIT damage estimates project tsunami heights of up to 34m along the Kochi coast, up to 22m along the Tokushima coast, and up to 4m along the Kagawa coast (Seto Inland Sea side). Yet ADR levels remain stuck at JPY 16,000-22,000, low compared even with the national averages (Tokyo JPY 36,800, Osaka JPY 26,000). Estimated occupancy is by no means weak at 75-78%, but low ADR caps RevPAR at JPY 12,400-17,400, structurally compressing investment returns once risk drag is deducted.
Still, even on a risk-adjusted basis, these destinations deliver positive yields (5.68-8.82%) — a noteworthy point. Rather, what this analysis suggests is that new development along Shikoku’s Pacific coast retains room to further lift investment appeal by pricing a disaster-resilience premium into ADR. For example, an upward shift to the luxury segment branded around “all rooms on upper floors, seismic grade S, 72-hour reserve water,” or higher-value-added business demand such as “BCP-ready MICE venues attached,” offers a path for translating risk premium into pricing. New supply in the current mid-to-economy band can secure profitability, but considering long-term closures should seismic risk materialize, an upward shift targeting higher risk-adjusted returns is the rational move.
Investment Decision Summary
| Verdict | Destinations | Key Rationale | Recommended Action |
|---|---|---|---|
| ★★★ Recommended | Atami, Shima/Kashikojima, Toba | Topography with extremely low tsunami hazard density + established luxury demand at ADR JPY 45,000+ | Consider new development/acquisition in luxury through upper-mid bands |
| ★★ Conditional | Ito, Shimoda, Lake Hamana | Moderate risk but wide existing ADR spread, room for repositioning | Acquisition of existing properties + seismic/BCP rebrand for differentiation |
| ★ Cautious | Shiono-misaki/Kushimoto, Kochi | Small market size with low ADR, absolute risk moderate | Only small-scale specialty plays integrated with regional tourism strategy |
| ★ Cautious | Takamatsu, Tokushima | Direct-hit Nankai Trough zone + high compound hazard density + risk drag substantially compresses gross yield | Enter via high-ADR concept with disaster-resilience premium, or BCP rebrand of existing properties |
Sensitivity Analysis — Construction Cost and GOP Rate Assumption Shifts
This analysis used construction cost JPY 18M per room and GOP 30%, but reality is in a sharp uptrend. If construction cost shifts to JPY 22M per room (equivalent to JPY 2.4M per tsubo) and GOP to 25%, risk-adjusted GOP yield drops by roughly 8-10ppt across all destinations. Even so, Quadrant I — Atami, Shima/Kashikojima — can hold the 14-18% range; but Quadrant III — Takamatsu, Tokushima — gets compressed to 3-4%. This means under construction-cost inflation, the importance of site risk screening rises exponentially.
Conclusion — The Era of “Risk-Priced” Hotels
Under the new reality of an elevated Nankai Trough probability (up to 90%) and a 70% Tokyo Inner-City probability, Pacific coast hotel investment must be built on the dual axes of “relative site risk screening” and “differentiation through disaster-resilience specifications.” The core message of this analysis distills into three points.
- The top of the risk-adjusted GOP yield ranking is Atami, Shima/Kashikojima, and Toba. Topography with low tsunami hazard density (inner bays, mountainside clustering) itself functions as a long-term investment hedge.
- Shikoku’s Pacific coast (Takamatsu, Tokushima, Kochi) sits at the bottom with risk-adjusted GOP yield in the 5-9% range. Occupancy is sufficient at 75-78%, but ADR is low and risk drag bites hard. Disaster-resilience specs + an upward brand shift offer room for profitability improvement.
- Under construction-cost inflation, site selection grows exponentially more important. Even under sensitivity shifts to JPY 22M per room and 25% GOP, Quadrant I areas hold above 17%, while Quadrant III areas drop to 3-5%, leaving thin returns relative to risk.
What the Noto Peninsula earthquake demonstrated was the fragility of the tourism industry once a megaquake stops being something that “will come someday” and “actually arrives.” Wakura Onsen ryokan reopen rate of 45% (after 2 years), 15 related bankruptcies nationwide, business closures in Oku-Noto at double the previous pace — these are raw, on-the-ground risks that insurance premiums and sensitivity analyses fail to capture. For investment decisions, the risk-adjusted GOP yield estimates in this article serve only as first-pass screening. Individual property feasibility studies, cross-referencing with local earthquake damage projections, and verification of operating partner BCP standards remain essential.
Limitations of This Analysis: The risk-adjusted GOP yield in this article is a first-pass screening indicator built on simplified assumptions for construction cost, GOP rate, and OCC. Actual investment decisions require: (1) individual property seismic diagnosis and ground surveys, (2) cross-referencing with local government earthquake damage projections, (3) individual quotes for earthquake insurance and BCP insurance, (4) verification of candidate operator BCP standards, and (5) confirmation of lender financing conditions (mandated seismic grade, earthquake insurance, etc.). Since OTA-published prices diverge from actual transaction prices, readers should interpret the figures as relative comparisons across destinations rather than as absolute values.
Related Articles
- Noto Peninsula 1 Year 4 Months: Wakura Onsen and Wajima Recovery Phase and Summer 2026 Booking Trends
- [April 2026 Update] Atami City Ryokan Deep Dive: 76 Properties, 2,508 Rooms — Market Structure and ADR Trends
- Park-PFI Hotel Development in Urban Parks: Investment Opportunity Analysis
- Osaka Expo’s Impact on Hotel ADR: Verified via REIT and OTA Data
- Hospitality Labor Cost Pass-Through and Bankruptcy Risk: Sustainability Tipping Point in ADR Data
Disaster Hazard Maps for 10 Destinations — Visualizing Overlap with Hotel Distribution
We overlaid the official tile data from MLIT’s Hazard Map Portal on the maps. The legend map below confirms the colors and meaning of each layer.
In areas where hazard zones overlap with hotels:
References and Sources
– Market Data
- MetroEngines Research & Consulting — OTA-published price data (10 destinations, N=506 properties, April-May 2026), OCC (estimated occupancy, prefectural level, early May 2026, weekday basis)
– Government Statistics and Public Data
- MLIT Real Estate Information Library — Disaster Hazard APIs (tsunami XKT003, storm surge XKT004, flood XKT005, landslide XKT006)
- e-Stat “Construction Starts Statistics” (Statistics ID: 0003114490) — Hotel construction, all-structure average JPY 1.95M per tsubo (2024)
- Earthquake Research Promotion Headquarters “Long-term Evaluation of Nankai Trough Earthquake Activity” (revised September 2025)
- Cabinet Office “Damage Projections and Countermeasures for the Tokyo Inner-City Earthquake” (December 2025)
- JTA “Wakura Onsen Regional Tourism Recovery Support Plan Integrated with Coastal Defense Restoration” (March 2025)
– Industry Reports and Guidelines
- Japan Travel and Tourism Association “BCP Creation Guide for Lodging Operators”
- Cabinet Office “Business Continuity Guidelines” (March 2023)
- JTA “Management Guidelines for High-Value-Added Lodging Industry Ver.1.3”
- Shiodome City Center (Mitsui Fudosan) Published BCP — 9,000 KVA emergency generator providing 72-hour power, 48-hour drainage tank
– News and Research Reports
- Science Portal “Nankai Trough Megaquake 30-Year Probability Raised to ‘Approximately 80%'”
- Teikoku Databank “15 Noto Peninsula Earthquake-Related Bankruptcies Nationwide” (January 2025)
- Nikkei “Noto Wakura Onsen Ryokan: Less Than Half Resumed Two Years After Disaster, New Buildings Coming in 2027”
- Wakura Onsen Kagaya “Reopening Schedule for Suspended Kagaya Group”
- Conditions for Hotels and Ryokan Subject to Mandatory Seismic Diagnosis
- Sompo Japan “BCP Earthquake Compensation Insurance”