

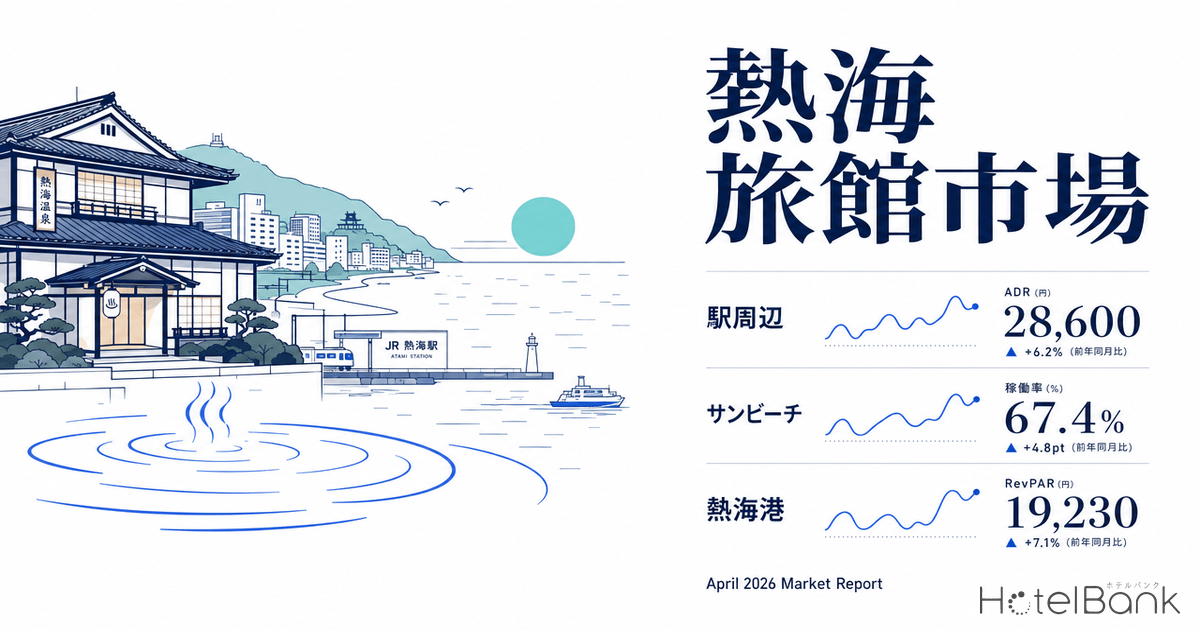

Atami has flourished as one of Japan’s premier hot spring resort destinations since the Meiji era, often referred to as “Tokyo’s hidden parlor.” After a prolonged downturn following the burst of the bubble economy, tourist numbers began rising again from the late 2010s, driven by younger demographics and Female-1 (F1) segment travelers in the SNS era. Following recovery from the COVID-19 pandemic, overnight visitors recovered to the 3.06 million range in fiscal 2024, nearly matching the fiscal 2018 level (3.09 million). This article examines the 76 ryokan properties and 2,508 rooms across Atami tracked by MetroEngines Research (メトロエンジンリサーチ), analyzing facility distribution, room scale, occupancy metrics, and ADR trends from multiple angles.
Metric Definitions Used in This Article
- ADR (Average Daily Rate): Average of listed selling prices published on OTAs and similar platforms. This differs from actual transaction prices (tends to run +25-30% higher than realized ADR). Per-room rate for double occupancy (tax included), averaged across all plan types (room-only through meal-inclusive plans).
- Sold-out rate: Percentage of plans that had closed reservation acceptance on OTAs at the time of survey. This differs from the property-wide room occupancy rate.
- Scope of analysis: 76 properties and 2,508 rooms classified under the “ryokan” category in Atami (as of April 2026). Among MetroEngines Research-tracked properties, only those with confirmed OTA activity are included.
- Data sources: MetroEngines Research, Atami City “Next Atami City Tourism Master Plan Drafting Materials (August 2025),” Japan Tourism Agency “Overnight Travel Statistics Survey”
Atami Ryokan Market Overview
Within the scope tracked by MetroEngines Research, Atami’s accommodation supply totals 125 properties and approximately 4,800 rooms. The ryokan category accounts for the largest share at 76 properties and 2,508 rooms — roughly 61% of property count and about 53% of total rooms. Average rooms per property stands at 33.0 for ryokan versus 71.5 for resort hotels, highlighting the relatively small scale of ryokan operations. This reflects Atami’s historical development centered on family-run mid-sized hot spring inns.
| Category | Properties | Total Rooms | Avg. Rooms/Property |
|---|---|---|---|
| Ryokan | 76 | 2,508 | 33.0 |
| Resort Hotel | 23 | 1,645 | 71.5 |
| Business Hotel | 2 | 185 | 92.5 |
| City Hotel | 1 | 70 | 70.0 |
| Deluxe Hotel | 4 | 58 | 14.5 |
| Pension/Minshuku/Other | 19 | 259 | 13.6 |
Source: Compiled by HotelBank Editorial Team from MetroEngines Research data
City Distribution Map: Concentration around Atami Station and Izusan
Mapping the geographic distribution of Atami’s 76 ryokan reveals three distinct clusters. The largest cluster spans the urban area between Atami Station and the coast, including the Itokawa and Ginza-cho areas, with 38 properties (50% of the total) and 1,536 rooms concentrated there. Next is the Izusan hot spring area with 17 properties (22%) and 531 rooms, followed by the southern Ajiro-Izutaga area with 16 properties (21%) and 382 rooms. Circle sizes on the map represent room count scale: large ryokan (100+ rooms) cluster within walking distance of the station, mid-sized properties dot Izusan, and small upscale ryokan are scattered throughout the south.
Source: Compiled by HotelBank Editorial Team from MetroEngines Research data
| Area | Ryokan Count | Rooms | Avg. Review Score |
|---|---|---|---|
| Atami Station Area / Downtown | 38 | 1,536 | 3.82 |
| Izusan / Hatsushima / North | 17 | 531 | 3.22 |
| South / Ajiro / Izutaga | 16 | 382 | 4.06 |
| Atami Port / East | 5 | 59 | 3.31 |
Source: Compiled by HotelBank Editorial Team from MetroEngines Research data
Notably, the southern Ajiro-Izutaga area posts the highest average review score at 4.06. This area hosts luxury-tier ryokan opened in the 2010s and beyond, such as SOKI ATAMI and Fufu Atami Bettei Konoma-no-Tsuki (ふふ熱海 別邸 木の間の月), with newer facilities and higher stay value reflected in the scores. By contrast, the largest cluster around the station scores an average 3.82, while Izusan trails at 3.22. Izusan contains many older large-scale ryokan, where the gap between facility age and renovation investment manifests as a score disparity.
Long-Term Property Count Trend: From Showa-44 Peak to Supply Reduction, Now in a Stable Phase
According to Atami City’s “Next Atami City Tourism Master Plan Drafting Materials (August 2025),” accommodation properties on a hot spring tax special collection basis peaked around 800 establishments during the 1965-1985 period, then declined steadily through the Heisei era as company dormitories and recreational lodgings closed. Recent figures show this decline bottoming out, and combined hotel/ryokan supply has entered a stable phase. Within MetroEngines Research’s tracking of OTA-active ryokan, property counts have hovered in the 76-78 range over the past two years.
Source: Compiled by HotelBank Editorial Team from MetroEngines Research and Atami City “Next Atami City Tourism Master Plan Drafting Materials”
OTA-confirmed property counts gradually contracted from 78 in April 2024 to 68 in September 2025, but recovered to 72-73 entering 2026. This was driven by new openings (two ryokan in fiscal 2024 and one in fiscal 2025 began OTA listings) and reactivation from temporary closures. The long-term contraction trend in property count is bottoming out, and the market can be assessed as transitioning from a “quantity adjustment” phase to a “quality competition” phase.
Distribution by Room Scale and Founding Year
Classifying the 76 ryokan by founding decade, the most common founding period is the 1950s — the postwar reconstruction and early high-growth era — with 16 properties (962 rooms), followed by 18 properties from 1970-1980s (614 rooms) and 19 properties from 1990-2000s (309 rooms). Recent openings (2010 onward) are limited at 6 properties (166 rooms). However, average room count per property reveals that newer 2010s+ openings average 27.7 rooms — a notable shift toward mid-sized properties. This indicates that while legacy large-scale ryokan are shrinking, new openings concentrate in mid-sized luxury resort formats.
Source: Compiled by HotelBank Editorial Team from MetroEngines Research data
By room count, the 962 rooms from 1950s-era openings is the largest, meaning that large ryokan built during the era of group tourism — such as Ooedo Onsen Monogatari, Kamenoi Hotel, and Atami New Fujiya Hotel — remain in active operation. By contrast, the six recent openings total only 166 rooms in volume, but most are classified as luxury grade and play an outsized role in lifting the overall ADR baseline.
Room Count Trend: Slight Decline in Total Rooms, Stable Average Property Size
OTA-confirmed total rooms in Atami’s ryokan market dipped from approximately 2,580 rooms in April 2024 to roughly 2,470 in the second half of 2025, then settled at 2,508 rooms by April 2026 — moving in tandem with property-count fluctuations. During this period, average rooms per property remained in the 33-35 range, with no observable structural shift toward larger or smaller scale.
Source: Compiled by HotelBank Editorial Team from MetroEngines Research data
The chart illustrates a stability defined by “gradual aggregate decline without structural shift.” Atami’s ryokan market diverges from the broader hotel industry trend toward consolidation and chain operation, with mid-sized family-run ryokan continuing to anchor the market structure.
Occupancy Indicators: Recent Sharp Rise in Sold-Out Rate
Tracking the monthly sold-out rate of OTA-listed plans, monthly averages remained below 5% from April 2024 through February 2026. This reflects Atami ryokan operators’ historically limited reliance on OTA channels, with direct websites and travel agencies as their primary distribution channels. However, the sold-out rate jumped sharply to 18.2% in March 2026 and 18.1% in April.
Source: Compiled by HotelBank Editorial Team from MetroEngines Research data
This surge appears driven by stronger demand around the spring 2026 cherry blossom season, spring break, and Golden Week. According to the Japan Tourism Agency’s “Overnight Travel Statistics Survey,” the national room occupancy rate for ryokan was 36.8% in 2024 — the lowest among all accommodation categories — but premier hot spring destinations like Atami experience high concentration of demand during peak periods, with periodic spikes in OTA sold-out plans. Note that this sold-out rate strictly represents “the share of OTA-published plans that have closed reservations” and differs from property-wide room occupancy.
ADR Trend: Year-Over-Year Overlay Reveals Seasonality and Price Increases
Visualizing the past 25 months of ADR via year-over-year overlay clarifies the price structure of Atami’s ryokan market. The first feature is the “August spike”: August 2024 reached ¥66,800 and August 2025 reached ¥67,900 — the year’s highest levels. This reflects the convergence of summer holiday and Obon family demand with the Atami Marine Fireworks Festival (summer edition), driving high-season pricing centered on luxury ryokan. The second feature is the “March year-end peak”: March 2026 came in at ¥64,400, up +7.6% from the prior year (¥59,900). The third feature is the “+11.5% YoY in April”: April 2025’s ¥53,200 jumped to ¥59,300 in April 2026 — a substantial gain.
Source: Compiled by HotelBank Editorial Team from MetroEngines Research data
Comparing 2025 and 2026 monthly figures to the prior year, January 2026 was +2.1%, February +1.0%, March +7.6%, and April +11.5% — accelerating from the fiscal year-end into spring. This reflects a structure where post-COVID recovery in overnight visitors lifts demand, while staffing shortages create structural occupancy ceilings on the supply side, generating tightening conditions and successful price pass-through. While Japan Tourism Agency data shows national ryokan ADR remains at the bottom of all accommodation categories, premier hot spring destinations like Atami transact at an average of ¥59,300 — well above the national ryokan average.
ADR Distribution by Grade: A Luxury-Concentrated Structure
The defining feature of Atami’s ryokan market is the dominance of luxury-grade properties, with 37 ryokan (49% of the total) classified as luxury — an overwhelming majority. This symbolizes the broader shift to a “stay-value” model across Atami’s ryokan sector. ADR also forms a clear hierarchical structure: Luxury at ¥72,500, High Grade ¥46,700, Upper ¥37,500, Economy ¥23,500, and Budget ¥19,800.
Source: Compiled by HotelBank Editorial Team from MetroEngines Research data
Notably, the Economy and Budget tiers exhibit very high sold-out rates of 38.0% and 45.5% respectively. Lower-priced plans tend to clear immediately, indicating strong demand from price-elastic customer segments. Conversely, the luxury grade’s sold-out rate of 14.2% is relatively low, but this reflects the high number of published plans and broader inventory in the high-price range — not a demand shortfall. Rather, this can be read as a sign of healthy operations: stay-value-oriented high-ADR ryokan operating with stable pricing.
Comparison with Major Tourism Destinations in Shizuoka Prefecture
Comparing ryokan ADR across Shizuoka’s major tourism areas, Atami ranks as the second-highest-priced area after Izu City (which includes Shuzenji and Amagi-Yugashima). As of April 2026, Izu City was at ¥60,500, Atami City at ¥59,300, Higashi-Izu Town at ¥55,900, and Ito City at ¥51,700, with the major hot spring destinations of the Izu Peninsula occupying the top tier. Sold-out rates, however, show Atami at 18.1% versus Ito City at 27.2% and Izu City at 18.2% — indicating Atami is not necessarily the most supply-constrained.
Source: Compiled by HotelBank Editorial Team from MetroEngines Research data
Atami stands as the “flagship of the Izu Peninsula tourism zone.” Shinkansen access advantages enable steady capture of day-trip and one-night demand from the Tokyo metropolitan area, creating a market with balanced pricing and demand. While Izu City commands higher rates due to its large luxury properties, Atami maintains overwhelming dominance in overall area visitor volume.
→ Summer 2026 Five Major Resort Areas: Comparative Analysis of ADR, Sold-Out Rate, and YoY
Background of Demand Structure: Overnight Visitor and Inbound Trends
Atami’s annual overnight visitor count peaked at 3,094,456 in fiscal 2018 (Heisei 30), then collapsed during COVID to 1.53 million in fiscal 2021 (Reiwa 3). After phased recovery, fiscal 2024 (Reiwa 6) reached 3,069,122 — 99.2% of the pre-pandemic level. Monthly patterns confirm Atami’s distinctive twin peaks in summer (August: 323,212) and winter (December: 320,759).
| Fiscal Year | Annual Overnight Visitors | vs. FY2018 | Notes |
|---|---|---|---|
| FY2018 (H30) | 3,094,456 | 100% | Pre-COVID peak |
| FY2021 (R3) | ~1,530,000 | 49.4% | COVID trough |
| FY2022 (R4) | ~2,290,000 | 74.0% | Early recovery |
| FY2023 (R5) | ~2,820,000 | 91.1% | SNS-driven youth popularity |
| FY2024 (R6) | 3,069,122 | 99.2% | First return to 3M+ in five years |
Source: Compiled by HotelBank Editorial Team from Atami City “Next Atami City Tourism Master Plan Drafting Materials (August 2025)”
One striking shift before and after COVID is the rise in the day-trip visitor share. Pre-COVID, the overnight-to-day-trip ratio was 2:1, but it now stands at roughly 1:1. SNS-era younger demographics and the F1 segment have firmly established “day-trip Atami” as a pattern, making the promotion of overnight return visits a core priority of the city’s tourism strategy. The inbound share for Shizuoka Prefecture as a whole remains below the national average, but the general incorporated foundation “Atami Tourism Bureau (DMO),” established in July 2024, is now intensifying inbound visitor acquisition efforts — a growth area to watch going forward.
Revenue Management Perspective: Revenue Opportunities for Stay-Value Ryokan
Atami’s ryokan market structurally exhibits “luxury concentration, high ADR, and low-to-moderate sold-out rates.” Three revenue opportunities emerge from this profile. First, the 38-46% sold-out rates in the Economy and Budget tiers signal strong demand at the lower price band, suggesting room for luxury ryokan to expand customer touchpoints by enhancing entry-level plans. Second, with YoY ADR acceleration to +7.6% in March and +11.5% in April, advancing peak-season tiered pricing earlier could unlock additional revenue. Third, the Izusan area’s relatively low average review score of 3.22 hints at upside potential through renovation investment to boost stay value and reset pricing — lifting the entire area’s ADR baseline.
For Atami as a whole, multiple positive factors converge: a decade of overnight visitor recovery, SNS-era youth demographic support, continued luxury new openings, and Shinkansen access from the Tokyo metropolitan area — all driving the maturation of the ryokan market. Going forward, inbound visitor acquisition and weekday demand smoothing will be the keys to further ADR growth.
⚠ Note on Future-Date ADR: ADR figures in this article reflect the average of selling prices published on OTAs at the time of survey, and they fluctuate as check-in dates approach. Currently elevated prices may decline through last-minute markdowns, and conversely may rise further as demand intensifies — both directions are possible.
Summary
This article analyzed the 76 ryokan and 2,508 rooms in Atami tracked by MetroEngines Research from multiple perspectives. Property distribution shows a three-cluster structure (station area, Izusan, south); property count has bottomed out after long-term decline; room scale exhibits stability centered on mid-sized ryokan; occupancy indicators show a sharp rise in sold-out rate from spring 2026; ADR is accelerating with +11.5% YoY in April; and grade distribution displays luxury concentration. Multiple indicators collectively point to “the maturation of a stay-value-oriented ryokan market.” Atami recovered to 3 million+ overnight visitors in 2024 for the first time in five years, nearly matching pre-COVID levels. Looking ahead, inbound visitor acquisition and weekday demand smoothing are expected to provide further growth opportunities along both the price and occupancy axes.
Recommended Reading
- ADR Analysis of Hotels around Hydrangea Tourist Spots — The Hidden High-Rate Window of the Rainy Season
- National Average ADR Hits Record High at ¥32,340 (May 2026): Structural Breakdown of “+19% in Three Years” from Inflation × Labor Cost Pass-Through
- Labor Cost Pass-Through and Bankruptcy Risk in Lodging: Reading the Sustainability Inflection Point through ADR Data
- Will the Opening of Junglia Okinawa Shift the Northern Market to Year-Round? — Verifying via ADR and Sold-Out Rate Across 6 Areas
- The Succession Crisis at Established Ryokan — Structure of 89 Bankruptcies and 30% Successor Shortage, and Conditions for Survival
- Summer 2026 Five Major Resort Areas: Comparative Analysis of ADR, Sold-Out Rate, and YoY
- Hyatt Centric Sapporo Opens — Reading the Spread of Foreign Brands and ADR Trends in Hokkaido