

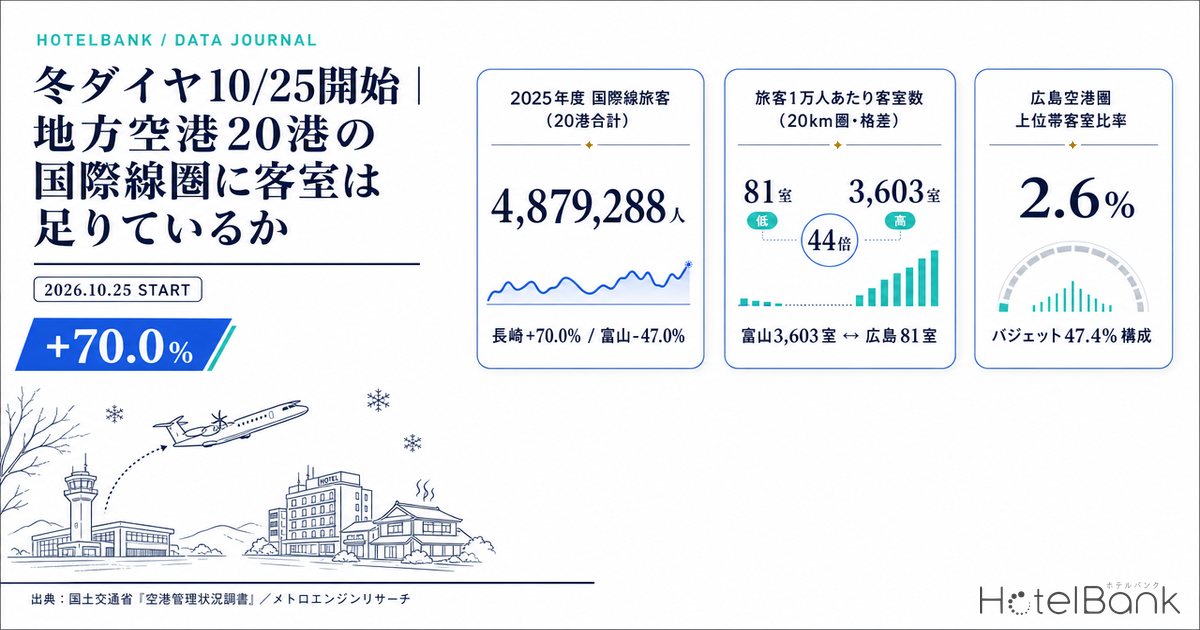
Japan’s 2026 winter flight schedule begins on Sunday, October 25 and runs through Saturday, March 27, 2027. As the mix of inbound source markets shifts, international routes at regional airports are taking on unprecedented weight as the gateways that determine where in Japan visitors actually land. But once they land, are there rooms waiting for them? This article measures the room stock within 10km and 20km of 20 regional airports — excluding Japan’s major gateways — and maps the depth of that accommodation base against the scale of international passenger traffic.
Metric Definitions Used in This Article
- ADR (average daily rate): An estimated transacted rate (tax-exclusive equivalent) calculated by applying segment-specific adjustment coefficients to the lowest publicly listed plan level each property posts on OTAs and similar channels (double occupancy, per-room rate, tax included). Cross-checked against property-level actuals disclosed by listed hotel REITs (91 properties, most recent three months), the median error is approximately 7%. These are estimates and differ from each property’s actual transacted prices and accounting figures. ADR for an airport zone is the median across the properties in that zone (the level of a typical property within it).
- Airport zone: Accommodation properties located within a circle of 10km / 20km radius centered on the airport’s coordinates. Property and room counts are tabulated within the coverage tracked by MetroEngines Research.
- 10km concentration ratio: The share of rooms within the 20km radius that fall inside the 10km radius. It indicates the distance relationship between the airport and the accommodation cluster.
- Upper-tier room share: The share of rooms within the 20km radius accounted for by the luxury and upper-midscale segments.
- Data sources: MetroEngines Research; published tabulations based on the Ministry of Land, Infrastructure, Transport and Tourism (MLIT) “Airport Management Status Report”
- — 4,879,288 passengers — FY2025 international traffic across the 20 regional airports outside the major gateways. Double-digit growth is widespread: Nagasaki +70.0%, Aomori +50.0%, Kagoshima +40.0%.
- — Split between adjacent and outlying types — The 10km concentration ratio runs 96.8% at Hakodate and 95.4% at Miyazaki versus 1.2% at Okayama and 6.0% at Takamatsu. For the outlying type, secondary transport is the precondition for converting demand into room nights.
- — Hiroshima 81 rooms, Kagoshima 169 rooms — Rooms within 20km per 10,000 international passengers. Both are thin against the 20-airport average of 417 rooms, and 44 times below the deepest zone, Toyama at 3,603 rooms.
- — Upper-tier room share of 14.2% — The 20-airport average. Against Komatsu at 41.5% and Hakodate at 25.4%, Hiroshima 2.6%, Ibaraki 3.0% and Shizuoka 6.1% have almost no inventory capable of commanding a premium rate.
- — 12,410 rooms over the past three years — Openings within the 20km zones between 2024 and 2026 total 399 properties (6.1% of existing stock). Yet Hiroshima added only 80 rooms and Shizuoka 29 — supply is not moving in precisely the airport zones where demand is growing.
The Population Covered Here — 20 Airports, Major Gateways Excluded
HotelBank has published several analyses on the theme of distance between airports and hotels. Hotels within 3km of airports — 148 properties and 14,827 rooms examined ultra-proximate locations serving “next-morning departure” demand, while a companion piece on the investment headroom of airport-adjacent hotels covered five major gateways: Kansai, Fukuoka, Naha, New Chitose and Chubu. In both cases, the analytical center of gravity was the giant gateways handling more than 10 million passengers a year.
This article stands at the opposite pole. Excluding the major gateways — New Chitose, Narita, Haneda, Kansai, Chubu, Fukuoka and Naha — we narrowed the population to 20 regional airports that operate scheduled international services or their equivalent. Specifically: Hakodate, Asahikawa, Aomori, Sendai, Ibaraki, Niigata, Toyama, Komatsu, Shizuoka, Okayama, Hiroshima, Yonago, Takamatsu, Matsuyama, Kitakyushu, Saga, Nagasaki, Kumamoto, Miyazaki and Kagoshima. FY2025 international passenger traffic across these 20 airports totaled 4,879,288. Within a 10km radius there are 1,534 properties and 68,215 rooms; within 20km, 4,741 properties and 203,356 rooms.
On the numbers alone, that works out to 417 rooms within 20km per 10,000 passengers. But that average is close to meaningless, because the dispersion between airports spans orders of magnitude.
In FY2025, International Traffic at Regional Airports Hit Record Levels
Start with the demand side. According to Japan National Tourism Organization (JNTO) estimates, inbound visitors in June 2026 numbered 3,148,600, down 6.8% year on year, with the January-June cumulative total at 21,084,800, down 2.0%. The headline total trails the prior year, but the composition is far from uniform. Fifteen markets set all-time June records: South Korea 787,100 (+7.8% YoY), Taiwan 670,400 (+14.6%), Hong Kong 214,300 (+28.5%) and the United States 354,500 (+2.7%) — short-haul Asia and long-haul Western markets growing simultaneously. Beneath the deceleration in the total, the market mix is being reshuffled.
Direct flights into regional airports are what absorbs that reshuffling. Short-haul markets such as South Korea, Taiwan and Hong Kong have a high propensity to land directly at regional airports rather than transit through the major gateways. Ranking the 20 airports by FY2025 international traffic growth, double-digit gains line up: Nagasaki +70.0%, Aomori +50.0%, Kagoshima +40.0%, Kumamoto +34.0% and Hiroshima +32.0%. In absolute volume, Sendai leads the 20 with 661,378 passengers, followed by Kumamoto at 640,871, Takamatsu at 521,559 and Hiroshima at 480,341.
Source: Compiled by the HotelBank Editorial Team from published tabulations based on the MLIT “Airport Management Status Report” and MetroEngines Research
Some airports contracted. Toyama fell 47.0% year on year to 34,515, Niigata declined 6.0% to 89,567 and Kitakyushu slipped 2.0% to 130,142. Because regional airports operate few international routes, the suspension or reduction of a single route swings the whole total. The winter schedule is the moment when carriers reshuffle their route portfolios, and that amplitude of swing is the single largest variable facing hotels in regional airport zones.
Airport-Zone Room Stock Splits Into “Adjacent” and “Outlying” Types
Now the supply side. We drew circles of 10km and 20km radius around each airport and tallied the rooms of accommodation properties inside them. What emerges is a clear split of regional airports into two types.
The first is the city-adjacent type. At Hakodate, 12,160 of the 12,556 rooms within 20km — 96.8% — sit inside the 10km circle. Miyazaki 95.4%, Matsuyama 92.9%, Niigata 80.4%, Toyama 65.2%, Komatsu 50.9% and Kagoshima 48.8% belong to this group. Because the airport sits immediately beside the urban core, the 10km circle swallows the downtown district and its hotel cluster whole. You can land and check in almost immediately.
The second is the outlying type. Okayama’s 10km concentration ratio is a mere 1.2%: despite 14,798 rooms within 20km, only 175 fall inside 10km. Takamatsu 6.0%, Asahikawa 6.5%, Aomori and Yonago 7.1%, Sendai 8.3%, Kitakyushu 9.8%, Ibaraki 10.0%, Saga 11.5%, Nagasaki 11.7%, Hiroshima 15.3% and Kumamoto 17.4% share the same shape. The airport sits in mountainous terrain or offshore, while the accommodation cluster lies 20-40km away in the prefectural capital.
Source: MetroEngines Research; compiled by the HotelBank Editorial Team (N=20 airports)
This split is not a question of better or worse. But the implications differ sharply. In the adjacent type, an overnight stay after arrival happens naturally; in the outlying type, secondary transport from airport to city becomes the precondition for demand to materialize as room nights. At regional airports where international arrivals cluster late at night or early in the morning, the presence or absence of that secondary transport decides whether a stay is possible at all.
Rooms per 10,000 Passengers — Hiroshima’s 81 and Kagoshima’s 169
To measure the depth of the accommodation base on a common yardstick, we calculated airport-zone rooms per 10,000 international passengers. Across all 20 airports the average within 20km is 417 rooms, but individual values range from 3,603 (Toyama) down to 81 (Hiroshima) — a 44-fold spread.
Source: Compiled by the HotelBank Editorial Team from published tabulations based on the MLIT “Airport Management Status Report” and MetroEngines Research
The thinnest is Hiroshima Airport. Its 480,341 international passengers in FY2025 rank fourth among the 20, yet rooms within 20km number just 3,879. Hiroshima Airport sits in the hills of Mihara City, roughly 50km from central Hiroshima — a 20km circle does not reach it. At 81 rooms per 10,000 passengers, it is less than one-fifth of the 20-airport average of 417.
Next thinnest is Kagoshima Airport at 169 rooms. The airport is in Kirishima City, and 48.8% of the 4,484 rooms within 20km fall inside the 10km circle. Having the Kirishima Onsen resort area — a substantial accommodation cluster — inside the zone is a strength, but the absolute volume remains limited against 265,586 international passengers. Third-ranked Takamatsu Airport at 223 rooms includes central Takamatsu’s 11,641 rooms within 20km and is still relatively thin against a passenger base of 521,559.
At the deep end sit Toyama at 3,603 rooms, Nagasaki at 1,740, Asahikawa at 1,236, Niigata at 1,169 and Miyazaki at 1,141. International traffic at these airports remains in the 50,000-90,000 range, yet their zones encompass the room stock of prefectural capitals and hot-spring resort areas. Read another way, they carry ample headroom relative to the upside in international traffic.
| Airport | Intl passengers FY2025 | YoY | Within 10km properties/rooms | Within 20km properties/rooms | 10km concentration | Rooms per 10,000 pax (20km) | Upper-tier room share |
|---|---|---|---|---|---|---|---|
| Hiroshima Hiroshima | 480,341 | +32% | 25 properties 592 rooms | 120 properties 3,879 rooms | 15.3% | 81 rooms | 2.6% |
| Kagoshima Kagoshima | 265,586 | +40% | 93 properties 2,188 rooms | 197 properties 4,484 rooms | 48.8% | 169 rooms | 24.0% |
| Takamatsu Kagawa | 521,559 | +8% | 33 properties 704 rooms | 369 properties 11,641 rooms | 6.0% | 223 rooms | 19.2% |
| Shizuoka Shizuoka | 258,827 | +26% | 71 properties 2,104 rooms | 212 properties 6,995 rooms | 30.1% | 270 rooms | 6.1% |
| Ibaraki Ibaraki | 82,527 | +25% | 17 properties 228 rooms | 121 properties 2,288 rooms | 10.0% | 277 rooms | 3.0% |
| Matsuyama Ehime | 398,147 | +23% | 198 properties 10,280 rooms | 237 properties 11,063 rooms | 92.9% | 278 rooms | 22.8% |
| Kumamoto Kumamoto | 640,871 | +34% | 77 properties 3,303 rooms | 452 properties 19,008 rooms | 17.4% | 297 rooms | 11.9% |
| Komatsu Ishikawa | 248,047 | +17% | 91 properties 3,771 rooms | 204 properties 7,407 rooms | 50.9% | 299 rooms | 41.5% |
| Saga Saga | 158,709 | +22% | 21 properties 578 rooms | 161 properties 5,026 rooms | 11.5% | 317 rooms | 10.4% |
| Sendai Miyagi | 661,378 | +27% | 40 properties 1,947 rooms | 309 properties 23,518 rooms | 8.3% | 356 rooms | 15.4% |
| Okayama Okayama | 275,253 | +14% | 14 properties 175 rooms | 279 properties 14,798 rooms | 1.2% | 538 rooms | 8.3% |
| Hakodate Hokkaido | 200,295 | +28% | 261 properties 12,160 rooms | 284 properties 12,556 rooms | 96.8% | 627 rooms | 25.4% |
| Aomori Aomori | 88,805 | +50% | 17 properties 420 rooms | 131 properties 5,949 rooms | 7.1% | 670 rooms | 8.8% |
| Yonago Tottori | 136,274 | — | 42 properties 728 rooms | 259 properties 10,272 rooms | 7.1% | 754 rooms | 14.1% |
| Kitakyushu Fukuoka | 130,142 | -2% | 22 properties 1,280 rooms | 234 properties 13,122 rooms | 9.8% | 1,008 rooms | 10.2% |
| Miyazaki Miyazaki | 86,247 | +28% | 154 properties 9,389 rooms | 181 properties 9,842 rooms | 95.4% | 1,141 rooms | 13.5% |
| Niigata Niigata | 89,567 | -6% | 111 properties 8,419 rooms | 176 properties 10,469 rooms | 80.4% | 1,169 rooms | 13.4% |
| Asahikawa Hokkaido | 52,820 | +10% | 80 properties 425 rooms | 270 properties 6,530 rooms | 6.5% | 1,236 rooms | 9.2% |
| Nagasaki Nagasaki | 69,378 | +70% | 42 properties 1,417 rooms | 296 properties 12,074 rooms | 11.7% | 1,740 rooms | 8.2% |
| Toyama Toyama | 34,515 | -47% | 125 properties 8,107 rooms | 249 properties 12,435 rooms | 65.2% | 3,603 rooms | 7.1% |
Source: Compiled by the HotelBank Editorial Team from published tabulations based on the MLIT “Airport Management Status Report” and MetroEngines Research
Mapping the Accommodation Base Across the 20 Airports
The map below plots the 20 airports and their 10km circles. Circle color indicates rooms per 10,000 international passengers within 20km — the deeper the red, the thinner the accommodation base. Marker size corresponds to FY2025 international passenger volume.
Source: Compiled by the HotelBank Editorial Team from published tabulations based on the MLIT “Airport Management Status Report” and MetroEngines Research
Deep colors line up from the Seto Inland Sea through southern Kyushu, while the Sea of Japan coast and Hokkaido are pale. The picture confirms visually that room stock is relatively tight precisely in western Japan, where international traffic is growing fastest.
Price-Tier Composition — Upper-Tier Rooms Average 14.2% Across the 20 Airports
Not just the “quantity” of rooms but their “quality mix” defines the character of the accommodation base. Tallying rooms within 20km by grade segment, the combined luxury and upper-midscale share across all 20 airports was 14.2%.
Source: MetroEngines Research; compiled by the HotelBank Editorial Team (N=20 airports)
The thickest upper tier belongs to the Komatsu Airport zone at 41.5%. That reflects the ryokan clusters of the Kaga Onsen area — Katayamazu and Yamashiro — inside the zone, with luxury alone accounting for 24.8% of the 7,407 rooms within 20km. Hakodate follows at 25.4%, Kagoshima at 24.0% (Kirishima Onsen), Matsuyama at 22.8% (Dogo Onsen) and Takamatsu at 19.2%. All share the same structure: a major hot-spring or sightseeing destination inside the airport zone.
By contrast, the thin end runs Hiroshima 2.6%, Ibaraki 3.0%, Shizuoka 6.1%, Toyama 7.1% and Nagasaki 8.2%. In the Hiroshima Airport zone in particular, 47.4% of the 3,879 rooms within 20km are budget, upper-midscale is 2.3% and luxury just 0.3%. Against 480,000 international passengers, that is a composition with almost no inventory capable of commanding a premium rate. With FIT travel from Taiwan and Hong Kong growing, it is one of the areas where headroom for upper-tier supply is most clearly unfilled.
The Shizuoka Airport zone is similar: 57.0% of the 6,995 rooms within 20km are budget and luxury is 0.7%. Against 258,827 international passengers (+26.0% YoY), no price-tier hierarchy has formed. As shown in our analysis of supply absorption capacity in regional core cities, a gap in supply only becomes an opportunity once demand exists. Growth in international traffic is beginning to satisfy that demand-side condition.
Rate Levels — Last Winter’s Actuals and Listings at the Start of the Winter Schedule
One constraint applies when discussing rates over the winter schedule period. Our monthly data coverage extends only through November 2026; no monthly rate data exists for December 2026 onward. We therefore cannot describe the full winter schedule window (October 25, 2026 – March 27, 2027) in rate terms. What follows places the confirmed actuals for last winter (December 2025 – March 2026) alongside listing-based estimates for October-November 2026, the opening months of the winter schedule.
| Airport zone (10km radius, 20+ rooms) | Last winter, actual Dec 2025 – Mar 2026 | October 2026 (listing-based est.) | November 2026 (listing-based est.) | Properties in sample |
|---|---|---|---|---|
| Asahikawa | ¥15,700 | ¥16,700 | ¥13,700 | N=2 |
| Komatsu | ¥9,300 | ¥12,200 | ¥11,900 | N=30 |
| Miyazaki | ¥9,200 | ¥11,500 | ¥11,600 | N=44 |
| Hiroshima | ¥9,200 | ¥12,300 | ¥15,000 | N=4 |
| Matsuyama | ¥8,800 | ¥11,400 | ¥11,300 | N=48 |
| Yonago | ¥8,800 | ¥13,200 | ¥16,200 | N=2 |
| Sendai | ¥7,800 | ¥12,000 | ¥11,900 | N=9 |
| Kumamoto | ¥7,600 | ¥10,500 | ¥10,100 | N=17 |
| Takamatsu | ¥7,400 | ¥10,000 | ¥10,100 | N=6 |
| Saga | ¥7,200 | ¥9,800 | ¥9,500 | N=6 |
| Aomori | ¥7,100 | ¥14,100 | ¥11,900 | N=1 |
| Hakodate | ¥7,100 | ¥10,200 | ¥8,500 | N=47 |
| Kagoshima | ¥6,600 | ¥9,100 | ¥9,500 | N=15 |
| Toyama | ¥6,500 | ¥11,800 | ¥10,900 | N=40 |
| Kitakyushu | ¥6,400 | ¥8,700 | ¥8,100 | N=8 |
| Shizuoka | ¥6,300 | ¥8,800 | ¥8,800 | N=16 |
| Nagasaki | ¥6,200 | ¥9,600 | ¥9,700 | N=12 |
| Niigata | ¥5,800 | ¥9,000 | ¥8,400 | N=44 |
| Ibaraki | ¥5,000 | ¥5,100 | ¥5,200 | N=1 |
Source: MetroEngines Research; compiled by the HotelBank Editorial Team
The highest actual level last winter was the Asahikawa Airport zone at ¥15,700 — one of the few cases where winter ski and sightseeing demand is clearly at work. Next came Komatsu at ¥9,300, Miyazaki at ¥9,200, Hiroshima at ¥9,200 and Yonago at ¥8,800. At the other end, Niigata at ¥5,800, Nagasaki at ¥6,200, Kitakyushu at ¥6,400 and Kagoshima at ¥6,600 all came in below ¥7,000.
Tracking the monthly movement makes the differences in winter demand structure explicit.
Source: MetroEngines Research; compiled by the HotelBank Editorial Team
The Miyazaki Airport zone climbed to ¥12,700 in February 2026, standing out while the other five zones sat in a ¥5,700-¥8,700 band. February draws such as professional baseball spring training camps lift rates there, showing that a demand axis independent of international flights already exists. The Matsuyama Airport zone also forms a seasonal peak, reaching ¥10,600 in January 2026. Conversely, the three Sea of Japan-side zones — Hakodate, Niigata and Toyama — moved within a ¥5,400-¥7,900 range from December through March, with rates sagging in winter.
That difference bears directly on how to exploit international traffic during the winter schedule. The more rates sag in winter, the more winter international passengers can function as genuinely incremental demand filling empty rooms. Conversely, in areas like Miyazaki that already have their own winter peak, the question becomes how to manage the overlap between international demand and existing demand.
Supply Pipeline — 12,410 Rooms Within 20km Over the Past Three Years
The accommodation base is not fixed. Within the 20km zones of the 20 airports, 399 properties with 12,410 rooms were confirmed to have opened between 2024 and 2026 — equivalent to 6.1% of the existing stock of 203,356 rooms.
Opening records in this table are tabulated on an OTA-listing-confirmed basis. Only about 19% of properties are listed on OTAs before opening, and more than half are listed only after opening, so property and room counts for recent periods (particularly 2026) may increase as further listings are confirmed. Read alongside the building-permit-based construction pipeline (MLIT “Construction Statistics Survey”).
| Airport zone (20km radius) | Properties opened 2024-2026 | Rooms | Share of existing stock |
|---|---|---|---|
| Kumamoto | 57 properties | 2,230 rooms | 11.7% |
| Nagasaki | 32 properties | 1,265 rooms | 10.5% |
| Takamatsu | 44 properties | 1,000 rooms | 8.6% |
| Sendai | 14 properties | 896 rooms | 3.8% |
| Matsuyama | 21 properties | 831 rooms | 7.5% |
| Miyazaki | 23 properties | 745 rooms | 7.6% |
| Hakodate | 31 properties | 730 rooms | 5.8% |
| Toyama | 17 properties | 711 rooms | 5.7% |
| Okayama | 17 properties | 706 rooms | 4.8% |
| Yonago | 25 properties | 511 rooms | 5.0% |
Source: MetroEngines Research (OTA-listing-confirmed basis, N=399 properties); compiled by the HotelBank Editorial Team
The heaviest is the Kumamoto Airport zone at 57 properties and 2,230 rooms, adding 11.7% on top of an existing 19,008. That supply is backed by demand growth tied to TSMC’s arrival; combined with 640,871 international passengers (+34.0% YoY), it is the one zone among the 20 where both demand and supply are moving. Nagasaki follows with 1,265 rooms, Takamatsu 1,000, Sendai 896 and Matsuyama 831.
Meanwhile the Hiroshima Airport zone, flagged above as thin, saw just 3 properties and 80 rooms open over the past three years — only 2.1% of its existing 3,879 rooms. The Shizuoka Airport zone recorded 11 properties and 29 rooms, effectively no new supply at all. That supply is not moving in two airport zones where international traffic is growing 26.0-32.0% year on year is, flipped around, precisely why the entry opportunity remains open.
For the forward pipeline, we reviewed planning data based on MLIT construction statistics. Across the 19 prefectures covered, building-permit-stage plans total just four projects: 277 rooms in Shizuoka, 490 rooms in Okayama, 380 rooms in Hiroshima and 41 rooms in Fukuoka. This captures only projects with permit applications filed as of the survey date, and applications are typically submitted one to two years before opening. Counts and room totals should rise as further applications are filed, so these figures should be read as the floor of the currently confirmed pipeline.
Conclusion — What the Winter Schedule Really Asks Is About Distance
International passengers at the 20 regional airports reached 4,879,288 in FY2025, with record growth at Nagasaki (+70.0%), Aomori (+50.0%) and Kagoshima (+40.0%). Even as total inbound arrivals trail the prior year, short-haul markets such as South Korea, Taiwan and Hong Kong keep growing, and direct flights into regional airports are the channel absorbing them.
Room stock in airport zones, however, is anything but evenly distributed. It splits between an adjacent type where the accommodation cluster fits inside the 10km circle (Hakodate 96.8%, Miyazaki 95.4%, Matsuyama 92.9%) and an outlying type where the cluster sits beyond 20km (Okayama 1.2%, Takamatsu 6.0%, Asahikawa 6.5%). For the latter, the design of secondary transport is the precondition for demand to become room nights.
Measured in rooms per 10,000 passengers, Hiroshima at 81, Kagoshima at 169 and Takamatsu at 223 line up on the thin side. The Hiroshima Airport zone in particular pairs the fourth-largest passenger base among the 20 airports (480,000) with 3,879 rooms within 20km, an upper-tier share of 2.6% and just 80 rooms opened over the past three years — the widest and clearest gap between demand and supply. The Shizuoka Airport zone takes the same shape.
The winter schedule begins on October 25. Individual route launches and frequency increases must await announcements from each carrier and airport operator, but FY2025 results already point to the direction of travel: regional airports will play an expanding role as the receiving base for inbound demand. What is being asked is less about the total volume of rooms than about the distance between airport and room — and the price-tier design that fills that distance.
⚠ Note on rates for future dates: The October and November 2026 ADR figures in this article are estimates derived from selling prices publicly listed on OTAs and similar channels as of the survey date, and they will move as check-in dates approach. Because they rest on a different calculation basis from the confirmed actuals for last winter (December 2025 – March 2026), the two cannot be directly compared to argue increase or decrease. In addition, our monthly data coverage extends only through November 2026, so rates from December 2026 onward (the second half of the winter schedule) fall outside the scope of this article.
Related Reading
- Hotels Within 3km of 4 Airports: 148 Properties, 14,827 Rooms — LCC & FIT Inbound Structure
- LCC Networks Read Japan’s New Inbound Trio: Malaysia/Vietnam/Indonesia
- Hiroshima Hotel Supply Split — Hatchobori vs Station 2027-2029 Pipeline Analysis
References and Sources
■ Data sources
Property counts, room counts, grade composition and estimated transacted ADR for airport zones are tabulated by MetroEngines Research (10km radius: N=1,534 properties / 68,215 rooms; 20km radius: N=4,741 properties / 203,356 rooms). International passenger figures are FY2025 published tabulations based on the MLIT “Airport Management Status Report” (preliminary figures as of May 2026; Yonago Airport alone is on a boarded-passenger basis). Opening records are on an OTA-listing-confirmed basis (N=399 properties); the planning pipeline uses building-permit data from the MLIT “Construction Statistics Survey.” Inbound visitor figures are Japan National Tourism Organization (JNTO) estimates.
■ Assumptions and definitions
The scope is 20 regional airports with scheduled international services or their equivalent, excluding New Chitose, Narita, Haneda, Kansai, Chubu, Fukuoka and Naha. An airport zone is the area within a 10km / 20km radius circle centered on each airport’s coordinates. Rooms per 10,000 passengers is “rooms within the 20km radius / (FY2025 international passengers / 10,000).” The 10km concentration ratio is the share of 20km-radius rooms accounted for by rooms within 10km. The upper-tier room share is the share of 20km-radius rooms in the luxury and upper-midscale segments. The rate table covers properties with 20 or more rooms within a 10km radius and uses the median within each zone.
■ Limitations and caveats
(1) Room stock is limited to properties confirmed as listed on OTAs; unlisted properties are not included. (2) Monthly rate data coverage extends only through November 2026, so rates from December 2026 onward (the second half of the winter schedule) fall outside the scope of this article. (3) ADR for October and November 2026 is estimated on a listing-price basis and cannot be directly compared with confirmed actuals for last winter because the calculation basis differs. (4) Defining zones as circles by radius does not reflect actual secondary-transport travel times. Particularly for outlying-type airport zones, the room count inside a zone does not by itself represent a reachable accommodation base. (5) Individual winter-schedule route launches and frequency increases depend on announcements by each carrier and airport operator; unannounced items are not included.
■ Market data
- MetroEngines Research — airport-zone property and room counts (10km / 20km radius, N=1,534 / 4,741 properties), estimated transacted ADR, room composition by grade
- MetroEngines Research (OTA-listing-confirmed basis) — 2024-2026 opening records (N=399 properties)
■ Government statistics and public data
- Japan National Tourism Organization (JNTO), “Inbound Visitor Arrivals (June 2026 estimate)”
- MLIT, “Airport Management Status Report”
- MLIT, “Air Transport Statistics (preliminary)”
- MLIT, “Construction Statistics Survey” (building-permit data for planned hotels)
- City of Kobe, “Japan Airport Passenger Rankings (FY2025 edition), including domestic and international breakdowns” (tabulated from the Airport Management Status Report; preliminary figures as of May 2026)
■ Airport and municipal disclosures / news coverage
- Hiroshima International Airport Co., “Hiroshima Airport FY2024 operating results (preliminary)” (April 30, 2025)
- Sendai International Airport Co., “Sendai Airport passenger and cargo volume results (preliminary)”
- KSB Setonaikai Broadcasting, “Okayama Airport users in FY2024 reach 1,379,000, up about 90,000 year on year on strong international traffic” (article link no longer available)
- Nikkei, “Takamatsu Airport users hit a record 2.11 million; international traffic up 90%”
- Sanin Chuo Shimpo, “Yonago Airport posts record international usage on strong Seoul service and new Taipei route, FY2025” (Yonago Airport alone uses the boarded-passenger basis figure of 136,274)
- Japan Airlines, “JAL/JTA finalize FY2026 international route and frequency plan”
- Peach Aviation, “Winter 2026 schedule: early sales for selected routes, phase 2” (June 25, 2026)
* International passenger figures are for FY2025 (preliminary as of May 2026). Yonago Airport alone uses a different source, on a boarded-passenger basis. Property and room counts for airport zones are tabulated within the coverage tracked by MetroEngines Research and do not include properties not listed on OTAs.