

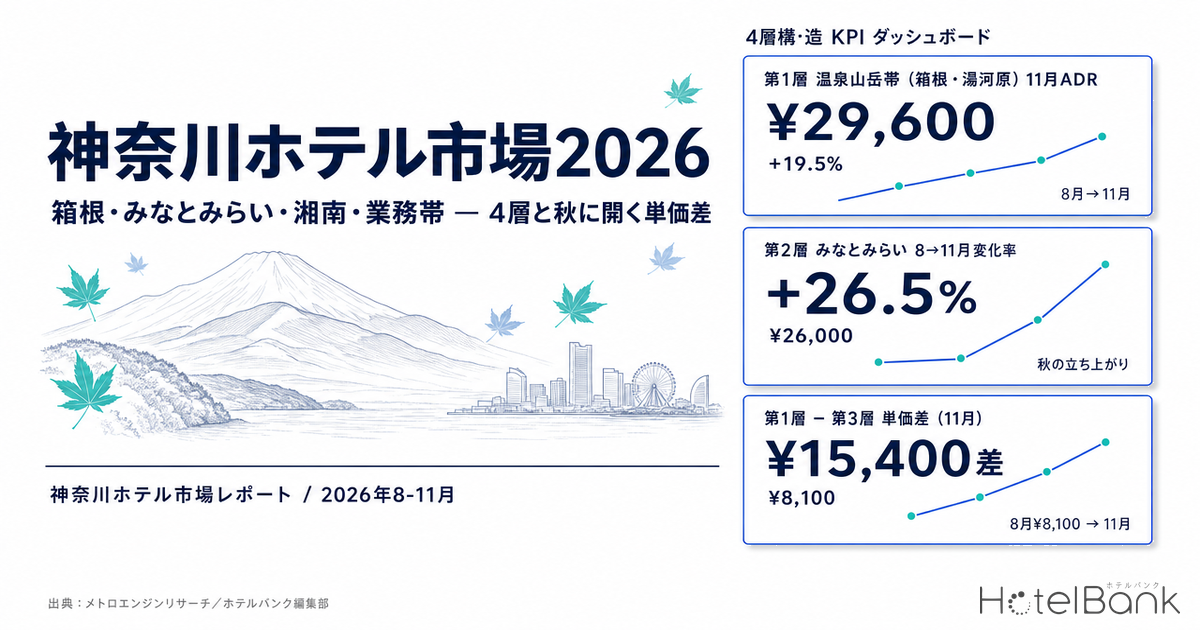
Kanagawa’s accommodation market is difficult to read when it is averaged as a single prefecture. Hot-spring ryokan in Hakone, high-rise city hotels in Minatomirai, seaside inns in Kamakura and Shonan, and business hotels in central Yokohama and Kawasaki — four markets coexist here whose demand sources, price levels, and seasonal shapes are completely different. This article breaks ADR down to the municipal level and examines how each tier moves from August to November 2026.
Metric Definitions Used in This Article
- ADR (average daily rate) = an estimated settled rate (tax-exclusive equivalent), calculated by applying property-type correction coefficients to the lowest publicly listed plan level each property posts on OTAs and similar channels (double occupancy, per-room rate, tax-inclusive). Cross-checked against property-level results disclosed by listed hotel REITs (91 properties, most recent three months), the median error is approximately 7%. These are estimates and differ from each property’s actual settled prices or accounting figures. Area-level ADR is the median of the properties covered (the level of a typical property in that area).
- OCC (occupancy rate) = the share of rooms sold against total room supply within an area (an estimate based on OTA sales inventory; consistency checks against monthly REIT disclosures confirm accuracy generally within a few percentage points). Used only as an aggregate at the prefectural and municipal level; occupancy for individual properties is not calculated.
- Listed price, where referenced, is the per-room rate at double occupancy (tax-inclusive, averaged across all plans). Because the basis differs from ADR, the two should not be compared directly.
- Data source: MetroEngines Research (aggregated as of early August 2026)
- — Prefecture-wide estimated settled ADR looks like a gentle climb, from ¥15,500 in September 2026 to ¥16,300 in November — but inside that average, four tiers are moving in opposite directions
- — Tier 1, the onsen/mountain belt (Hakone, Yugawara), runs from ¥24,700 in August to ¥29,600 (+19.5%) in November. The autumn foliage season sets the annual peak
- — Only Tier 3, the coastal leisure belt (Kamakura, Shonan, Miura Peninsula), is a summer-holdover market at −14.6%. Its gap to Tier 1 roughly doubles, from ¥8,100 in August to ¥15,400 in November
- — Tier 2, Minatomirai, gains 26.5% and Tier 4, the business belt, 21.5%. The business belt is an anti-phase market that troughs in August, and its Saturday-to-weekday ratio spreads from 1.57x to 2.28x by ward
- — Estimated July 2026 occupancy by property type was 87.7% for business hotels and 88.2% for city hotels, against 74.3% for resort hotels. Of the 14 properties listed REITs hold in the prefecture, 11 are concentrated in the business belt
The prefecture average erases Kanagawa’s structure
Start with the prefecture-wide figures. Estimated settled ADR for Kanagawa as a whole is ¥15,500 in September 2026, ¥16,100 in October, and ¥16,300 in November. Year on year, that is +15.4% in September, +18.1% in October, and +4.8% in November — all above the prior year (N=479–548 properties). Taken at face value, this is simply “a market rising gently into autumn,” and nothing more.
That prefecture average, however, is the result of pouring Hakone’s ¥31,800 and Fujisawa’s ¥10,300 into the same vessel. Average together markets that differ more than threefold in price level and are outright opposite in seasonal shape, and naturally all that survives is the safe line of “a gentle climb.” Any meaningful discussion of Kanagawa has to descend to the municipal level.
Source: MetroEngines Research; compiled by the HotelBank Editorial Team (N=442–600 properties per month)
Four tiers emerge from the data
Pulling monthly estimated settled ADR series for all 49 municipalities in the prefecture and grouping them by both price level and seasonal shape produces four tiers. The names were not chosen first and the numbers fitted afterwards: the direction of change from August to November split cleanly along these lines.
| Tier | Representative areas | Aug ADR | Nov ADR | Aug→Nov | Properties |
|---|---|---|---|---|---|
| Tier 1 Onsen/mountain belt | Hakone, Yugawara | ¥24,700 | ¥29,600 | +19.5% | 199–238 |
| Tier 2 Minatomirai | Nishi-ku, Yokohama | ¥20,600 | ¥26,000 | +26.5% | 16 |
| Tier 3 Coastal leisure belt | Kamakura, Fujisawa, Chigasaki, Hiratsuka, Yokosuka, Manazuru, Odawara | ¥16,600 | ¥14,200 | −14.6% | 75–89 |
| Tier 4 Business belt | Naka-ku, Kanagawa-ku, Kohoku-ku, Tsurumi-ku (Yokohama); Kawasaki-ku, Saiwai-ku (Kawasaki) | ¥10,600 | ¥12,900 | +21.5% | 100–108 |
Tier ADR is the estimated settled ADR of the constituent municipalities, weighted by property count. Source: MetroEngines Research; compiled by the HotelBank Editorial Team
Look closely at the gap between Tier 1 and Tier 3. In August they stand at ¥24,700 and ¥16,600 — a difference of ¥8,100. By November they are ¥29,600 and ¥14,200, and the gap widens to ¥15,400, close to double. This happens inside a single prefecture, between places barely 20 km apart in a straight line from Odawara to Hakone, over three autumn months. It is exactly the structure the prefecture average wipes out.
Source: MetroEngines Research; compiled by the HotelBank Editorial Team
Foliage type and summer-holdover type: the autumn ADR curve splits into two shapes
Line up the August-to-November rate of change by municipality and the field divides cleanly into positive and negative. Hakone (+20.2%) represents the positive side and Fujisawa (−20.6%) the negative, a spread of more than 40 percentage points.
The foliage type is the onsen/mountain belt of Hakone and Yugawara. Hakone climbs in steps — ¥26,500 in August, ¥26,100 in September, ¥29,800 in October, ¥31,800 in November. November is its highest month of the year, the classic pattern in which the autumn foliage season sets the ADR peak. Being within two hours of the Tokyo metropolitan area via Odawara pulls overnight demand onto foliage weekends when a day trip is impractical.
Yugawara moves somewhat differently. It steps up once in September, from ¥18,900 in August to ¥21,600, then holds a plateau at ¥21,300 in October and ¥21,700 in November. Where Hakone “lifts off in October and November,” Yugawara “rises a beat earlier in September and holds through the autumn.” Its annual high is not November but January (¥26,700), with New Year demand forming the largest peak. Even within the same category of onsen destination, the ADR curve is designed differently — and Yugawara may still have room to extend its October–November gains.
The summer-holdover type, by contrast, is the coastal leisure belt of Kamakura, Shonan, and the Miura Peninsula. Fujisawa’s annual high is ¥12,900 in August; it then falls to ¥10,800 in September, ¥10,300 in October, and ¥10,300 in November. Chigasaki (−12.9%), Yokosuka (−14.5%), and Manazuru (−23.0%) share the shape. Summer demand built around swimming and fireworks lifts rates, and autumn returns them to a normal level.
Kamakura sits between the two. Its ¥23,800 August peak is summer-holdover behaviour, but after bottoming at ¥20,200 in September it recovers to ¥20,300 in October and ¥21,200 in November. Kamakura holds autumn assets beyond the coast — temples, shrines, and foliage — and these appear to underpin the market from September onward. It is the one area in the coastal leisure belt able to pull its rates back up in autumn.
Source: MetroEngines Research; compiled by the HotelBank Editorial Team
The business belt: an anti-phase market that troughs in August and recovers in autumn
The business belt of central Yokohama and Kawasaki carries the opposite seasonality to the resort areas. Tier 4’s weighted-average ADR runs ¥10,600 in August, ¥12,100 in September, ¥13,100 in October, and ¥12,900 in November — a summer trough with an autumn recovery. August thins out corporate travel, and leisure demand does not flow toward inland business districts, making it the weakest month of the year.
Individually, Naka-ku in Yokohama moves from ¥10,300 in August to ¥13,400 in October, up 30.7% (N=48–51 properties). Kawasaki-ku goes from ¥10,400 in August to ¥12,300 in October, up 18.0% (N=25–28 properties). Kohoku-ku runs from ¥11,500 in August to ¥13,900 in November, up 20.8% (N=14 properties). In each case, autumn weekday demand pushes rates back up.
Tier 2, Minatomirai (Nishi-ku), shares the same anti-phase pattern but sits an order of magnitude higher. It moves from ¥20,600 in August to ¥26,000 in November, up 26.5%, and extends to ¥27,100 in December. A convention centre, exhibition halls, and an arena are clustered here, so the autumn-to-winter MICE season overlaps with event demand. Within the same city of Yokohama, Nishi-ku and Naka-ku are more than twice apart on ADR as of November.
Day-of-week patterns: the more business-oriented the ward, the bigger the Saturday jump
Nothing captures the character of the business belt more directly than pricing by day of week. For stays in June and July 2026, listed prices (all-plan average, tax-inclusive) at properties in each ward of Yokohama and Kawasaki were aggregated by day of week.
| Ward | Properties | Mon–Thu avg | Fri | Sat | Sat / weekday |
|---|---|---|---|---|---|
| Nishi-ku, Yokohama | 21 | ¥44,100 | ¥51,600 | ¥72,700 | 1.65x |
| Naka-ku, Yokohama | 85 | ¥23,900 | ¥29,600 | ¥46,000 | 1.93x |
| Kanagawa-ku, Yokohama | 9 | ¥27,600 | ¥31,600 | ¥49,300 | 1.79x |
| Kohoku-ku, Yokohama | 22 | ¥21,500 | ¥22,100 | ¥38,200 | 1.78x |
| Tsurumi-ku, Yokohama | 7 | ¥12,800 | ¥14,300 | ¥29,200 | 2.28x |
| Kawasaki-ku, Kawasaki | 37 | ¥19,100 | ¥21,000 | ¥29,900 | 1.57x |
| Saiwai-ku, Kawasaki | 3 | ¥27,900 | ¥31,800 | ¥44,500 | 1.59x |
| Nakahara-ku, Kawasaki | 9 | ¥20,500 | ¥22,000 | ¥32,400 | 1.58x |
Listed prices for check-ins 1 June – 31 July 2026 (double occupancy, per room, tax-inclusive, all-plan average), aggregated by day of week. Source: MetroEngines Research; compiled by the HotelBank Editorial Team
What is interesting is how the Saturday-to-weekday ratio mirrors the character of each area. Against 2.28x in Tsurumi-ku and 1.93x in Naka-ku, Kawasaki-ku stops at 1.57x and Saiwai-ku at 1.59x. The more the Yokohama side layers weekend leisure demand on top, the larger the weekend uplift; the purer the business district, the gentler the weekend rise. This is not a weakness — read it as a map of where weekend pricing still has upside.
Estimated occupancy by property type: capsule 98%, resort 74%
Occupancy offers a second read on supply and demand. The following aggregates estimated OCC by property type for July 2026 stays in Kanagawa. For the prefecture as a whole (N=607 properties, 47,397 rooms), estimated OCC was 85.6%.
July 2026 stays. An estimate based on OTA sales inventory; it differs from a property’s true overall occupancy. Source: MetroEngines Research; compiled by the HotelBank Editorial Team
Business hotels reach 87.7% (N=201 properties, 26,385 rooms) and city hotels 88.2% (N=42 properties, 8,161 rooms), against 80.8% for ryokan (N=172 properties, 4,622 rooms) and 74.3% for resort hotels (N=41 properties, 5,125 rooms) — a spread of nearly 14 points between property types. Capsule hotels are extreme at 97.7% (N=3 properties, 441 rooms).
That gap is not a simple ranking of better and worse, however. Ryokan and resort hotels carry average prices of ¥42,000–¥47,000, a completely different band from the ¥14,500 of business hotels. At high price points it is rational not to pin occupancy at 100%, and the difference reflects distinct philosophies about where to strike the balance between rate and occupancy.
Estimated OCC by day of week, July 2026 stays. Source: MetroEngines Research; compiled by the HotelBank Editorial Team
Broken out by day of week, the demand structure of each property type becomes sharper still. Business hotels swing only 11.9 points, from 81.8% on Monday to 93.7% on Saturday, while resort hotels move 28.0 points, from 59.7% on Monday to 87.7% on Saturday. Ryokan cover 14.4 points, from 77.6% on Monday to 92.0% on Saturday. In other words, business-belt hotels fill evenly across the week while resorts and ryokan concentrate into the weekend. Both demand structures coexist inside one prefecture.
Municipal ADR map
Plotting November estimated settled ADR on a map makes the structure visible: two high-rate poles in the western onsen/mountain belt and Yokohama Minatomirai, with the business belt and the coastal leisure belt sandwiched between them. Circle size corresponds to the level of estimated settled ADR.
Estimated settled ADR for November 2026 stays (municipalities with six or more properties covered). Source: MetroEngines Research; compiled by the HotelBank Editorial Team
Supply: large Yokohama openings and small Hakone additions run in parallel in 2026
Within the scope MetroEngines Research tracks, 27 accommodation properties opened in Kanagawa in 2026 (confirmed by OTA listing). Five of those exceed 100 rooms, and all five are concentrated in Yokohama or around Haneda.
| Opening | Property | Rooms | Category |
|---|---|---|---|
| 2026-07 | The HOTEL Well-hub Haneda | 186 | — |
| 2026-04 | THE DAY HOTEL ShinYokohama | 191 | — |
| 2026-04 | OMO7 Yokohama by Hoshino Resorts (OMO7横浜 by 星野リゾート) | 276 | City hotel |
| 2026-04 | Hilton Garden Inn Yokohama Minatomirai | 228 | City hotel |
| 2026-02 | Fufu Jogashima Kaifu no Shirabe (ふふ 城ヶ島 海風のしらべ) | 34 | — |
| 2026-01 | OMO5 Yokohama Bashamichi by Hoshino Resorts (OMO5横浜馬車道 by 星野リゾート) | 175 | Resort hotel |
| 2026-01 to 07 | Vacation rentals and small lodgings in Hakone and Shonan (16 properties combined) | approx. 40 | Vacation rentals, etc. |
Source: MetroEngines Research & Consulting (confirmed by OTA listing, N=27 properties)
One caveat: this list is not a complete census. OTA listings appear several months ahead of opening, so counts for the most recent months will rise as further listings are added. The apparently thin opening count from the second half of 2026 onward reflects observation lead time, not shrinking supply.
What stands out in the count is that 16 of the 27 are vacation rentals and small lodgings of one to eight rooms in the Hakone and Shonan areas. In Tier 1, the onsen/mountain belt, inventory is accumulating steadily in small lots rather than through large hotels. On the Yokohama side, by contrast, 200-room-class openings are concentrated into a short window. The character of new supply swings in opposite directions inside the same prefecture.
Forward construction plans were also checked. On the basis of the Ministry of Land, Infrastructure, Transport and Tourism’s Statistical Survey on Building Construction, five building plans including accommodation facilities, totalling 1,087 rooms, can be identified in Kanagawa.
| Scheduled completion | Location | Rooms | Principal use |
|---|---|---|---|
| 2027-05 | Kitanakadori 6-chome, Naka-ku, Yokohama | 272 | Apartments, hotel, parking |
| 2026-12 | Kowakudani, Hakone | 126 | Hotel |
| 2026-04 | Gora, Hakone | 71 | Hotel |
| 2026-04 | Minatocho 1-chome, Naka-ku, Yokohama | 280 | Offices, university, hotel, retail, arena, etc. |
| 2026-03 | Minatomirai 6-chome, Nishi-ku, Yokohama | 338 | Hotel, pool, spa, aquarium, restaurants, etc. |
Note: building-confirmation basis as of the survey date. Counts and room totals are expected to rise as further applications are filed, so treat this as a lower bound on the confirmed pipeline at this point in time. Source: compiled by MetroEngines Research & Consulting from the Ministry of Land, Infrastructure, Transport and Tourism’s Statistical Survey on Building Construction
Large mixed-use schemes line up: 338 rooms in Nishi-ku, Yokohama, and 280 and 272 rooms in Naka-ku. Inventory on that scale will land on a Tier 2 Minatomirai market where November ADR has already reached ¥26,000. With MICE and arena demand and new supply thickening at the same time, Nishi-ku rates will be decided by a tug-of-war between demand growth and supply growth. On the relationship between the Minatomirai development pipeline and its price tiers, Yokohama Minatomirai Luxury Hotel Pipeline Investment Analysis examines the individual projects in detail.
Addendum: Kanagawa seen through listed hotel REITs
For reference, the holdings of listed hotel REITs offer another view of where Kanagawa sits. Extracting Kanagawa properties from an ownership master (as of August 2026, 302 domestic properties) shows five REITs holding 14 properties in total.
| REIT | Properties in prefecture | Main locations |
|---|---|---|
| Invincible Investment Corporation (インヴィンシブル投資法人) | 7 | Yokohama (Kannai, Sakuragicho), Kawasaki, Atsugi |
| Japan Hotel REIT Investment Corporation (ジャパン・ホテル・リート投資法人) | 3 | Yokosuka, Yokohama Kannai, Hakone Gora |
| Ichigo Hotel REIT Investment Corporation (いちごホテルリート投資法人) | 2 | Yokohama |
| Nippon Hotel & Residential Investment Corporation (日本ホテル&レジデンシャル投資法人) | 1 | Atsugi |
| Mori Trust REIT Investment Corporation (森トラストリート投資法人) | 1 | Odawara |
Source: ownership master compiled from each REIT’s disclosure materials (as of August 2026, 302 domestic properties); prepared by the HotelBank Editorial Team
Eleven of the 14 properties sit in the Tier 4 business belt (Yokohama, Kawasaki, Atsugi). Only one — Hakone Gora — belongs to the Tier 1 onsen/mountain belt, and the Tier 3 coastal leisure belt accounts for just two, in Yokosuka and Odawara. Listed REIT capital has barely entered Hakone and Yugawara, where rates are highest, and is instead concentrated in the business belt, where rates are lower but rooms fill evenly across the week. That is a straightforward expression of investor preference for cash-flow stability — and, read the other way, it suggests the onsen/mountain belt still has room for institutional capital to enter. A related analysis works backwards from ADR and occupancy to a maximum acquisition price for onsen ryokan, including Yugawara, at a 12% yield.
Proximity to the Tokyo metropolitan area sets the shape of each ADR curve
What ultimately explains the differences among the four tiers is distance from the Tokyo metropolitan area and the means of getting there.
Hakone and Yugawara are 90 minutes to two hours from Tokyo by limited express or Shinkansen. A day trip is physically possible, yet once onsen and dining are the purpose, staying overnight becomes the rational choice — a delicate distance. That “almost-but-not-quite a day trip” position concentrates overnight demand into weekends and holidays, and when the strong seasonal reason of autumn foliage is added, November becomes the ADR peak. Tier 1 turns into a foliage-type market not only because of the appeal of its tourism assets but because this distance condition is at work.
Kamakura, Fujisawa, and Chigasaki are the opposite: within an hour of Tokyo and entirely feasible as a day trip. Precisely for that reason, overnight demand arises mainly when there is a reason a day trip cannot accommodate — which in practice means the summer of swimming and fireworks. Tier 3 becomes a summer-holdover market, and struggles to recover rates in autumn, as the flip side of that closeness. Kamakura alone can pull back in autumn because it has temples, shrines, and foliage — reasons to stay into the evening.
The Yokohama and Kawasaki business belt runs on a different logic from tourism distance altogether. Its demand source is business activity in central Tokyo and the Keihin industrial zone; it thins during the summer holiday period and returns in the autumn business season. Rooms fill evenly across the week, but the swing in rates is small. Minatomirai alone layers MICE and event demand on top of business demand, which is how it holds the same anti-phase pattern an order of magnitude higher.
When thinking about rate strategy in Kanagawa, the prefecture average is not a basis for judgement. The starting point is identifying which tier your property sits in and which way that tier’s autumn curve points. For Tier 1, how much of the October–November uplift can be captured; for Tier 3, what to sell in autumn; for Tier 4, how to mine the weekend upside — the question is entirely different for each tier.
Converted into rooms, how much inventory does each tier’s occupancy gap represent?
The estimated OCC figures so far are ratios, and take no account of the scale of each tier. Rearranging the definition given at the top of this article — estimated OCC = rooms sold as a share of total rooms in the area — gives the unit conversion estimated rooms sold = rooms covered × estimated OCC. The table below is not a demand forecast: it simply restates, in rooms, the room counts and estimated OCC figures already presented above. No new observations or estimates have been added.
| Property type | Rooms covered | Monday | Monthly average | Saturday | Mon→Sat increment |
|---|---|---|---|---|---|
| Business hotels | 26,385 rooms | 81.8% / 21,583 rooms | 87.7% / 23,140 rooms | 93.7% / 24,723 rooms | +3,140 rooms |
| Ryokan | 4,622 rooms | 77.6% / 3,587 rooms | 80.8% / 3,735 rooms | 92.0% / 4,252 rooms | +665 rooms |
| Resort hotels | 5,125 rooms | 59.7% / 3,060 rooms | 74.3% / 3,808 rooms | 87.7% / 4,495 rooms | +1,435 rooms |
Room counts and estimated OCC are all figures presented above. Source: MetroEngines Research; compiled by the HotelBank Editorial Team
In ratio terms, resort hotels swing the most at 28.0 points, 2.4 times the 11.9 points of business hotels. Converted into rooms, however, the Monday-to-Saturday increment is 3,140 rooms for business hotels against 1,435 for resorts — 2.2 times more in absolute volume for business hotels. The Tier 4 business belt is a market that fills evenly across the week, but with a stock of 26,385 rooms it still moves more rooms over the weekend than anywhere else in the prefecture. Read that way, the place where revisiting weekend pricing compounds into the largest yen amount is not the wide-swinging resort segment but the large-scale business belt.
| Rooms covered \ Estimated OCC | 74.3% | 80.8% | 85.6% | 87.7% | 88.2% |
|---|---|---|---|---|---|
| Capsule hotels (441 rooms) | 328 rooms | 356 rooms | 377 rooms | 387 rooms | 389 rooms |
| Ryokan (4,622 rooms) | 3,434 rooms | 3,735 rooms | 3,956 rooms | 4,053 rooms | 4,077 rooms |
| Resort hotels (5,125 rooms) | 3,808 rooms | 4,141 rooms | 4,387 rooms | 4,495 rooms | 4,520 rooms |
| City hotels (8,161 rooms) | 6,064 rooms | 6,594 rooms | 6,986 rooms | 7,157 rooms | 7,198 rooms |
| Business hotels (26,385 rooms) | 19,604 rooms | 21,319 rooms | 22,586 rooms | 23,140 rooms | 23,272 rooms |
The vertical axis uses the rooms covered by property type as presented above; the horizontal axis uses the estimated OCC figures presented above (resort 74.3%, ryokan 80.8%, prefecture-wide 85.6%, business 87.7%, city 88.2%, all for July 2026 stays). Shaded cells mark each property type’s observed combination. This is a unit conversion based on the definition, not a forecast. Source: MetroEngines Research; compiled by the HotelBank Editorial Team
The grid reads simply: how many rooms move when occupancy shifts by one point is proportional to the room count. For the 26,385 rooms of business hotels, one point is about 264 rooms; for the 4,622 rooms of ryokan, about 46. Even for the identical action of “raising occupancy,” the absolute inventory that moves differs by more than sixfold across tiers. The conclusion of this article — that the question differs by tier — holds in rooms as well as in ratios.
Conclusion
Broken down to the municipal level, Kanagawa’s accommodation market divides into four tiers on both price level and seasonal shape. Tier 1, the onsen/mountain belt (Hakone, Yugawara), rises 19.5% from ¥24,700 in August to ¥29,600 in November; Tier 2, Minatomirai, gains 26.5% from ¥20,600 to ¥26,000; and Tier 4, the business belt, gains 21.5% from ¥10,600 to ¥12,900. Only Tier 3, the coastal leisure belt, moves the other way, falling 14.6% from ¥16,600 to ¥14,200.
As a result, the gap between Tier 1 and Tier 3 widens from ¥8,100 in August to ¥15,400 in November, close to double. Prefecture-wide estimated settled ADR looks like nothing more than a gentle climb from ¥15,500 in September to ¥16,300 in November, yet inside it the tiers are moving in opposite directions. When considering autumn pricing, starting from the curve of the tier your property belongs to — rather than the prefecture average — translates directly into revenue opportunity.
⚠ Note on ADR for future dates: ADR figures for August 2026 onward in this article are estimates calculated from sales prices published on OTAs and similar channels as of the survey date, and will shift as the check-in date approaches. Please note that levels move as plans are added and prices adjusted. Estimates for September to December are based on current listed levels and are not confirmed results.
Related reading
- Kagawa’s 16 Municipalities: 9.4x ADR Gap and Four Autumn Price Tiers
- Shimane Hotel Market: Kamiarizuki’s 4-Tier ADR Split, +59.3% Peak
- Yamaguchi DC 2026: Hagi ADR +39.6% vs Yamaguchi City +3.1%
- New Hotel ADR Ramp-Up: 91 Japan Openings Split Into 4 Pricing Types
- Policy Rate 1.00%: Break-Even ADR Across Japan’s 8 Hotel Markets
- Gunma Hotel Market 2026: Four ADR Tiers and a ¥5,700 Upper-Mid Gap
- Yokohama Minatomirai Luxury Hotel Pipeline Investment Analysis: Price Tiers & Mixed-Use Upside
References and Sources
■ Data sources
Monthly estimated settled ADR series for the 49 municipalities of Kanagawa (January 2024 – December 2026; area-level figures are the median of the properties covered); estimated occupancy by property type with day-of-week breakdowns (June and July 2026 stays); listed prices by day of week for eight wards of Yokohama and Kawasaki (check-ins 1 June – 31 July 2026); new-opening data (confirmed by OTA listing); building-plan data; and an ownership master for listed hotel REITs (as of August 2026, 302 domestic properties). All aggregated by MetroEngines Research & Consulting.
■ Calculation assumptions
Tier ADR is the estimated settled ADR of the constituent municipalities, weighted by property count. The August-to-November rate of change is the ratio of estimated settled ADR for August and November 2026. The conversion table in “Converted into rooms, how much inventory does each tier’s occupancy gap represent?” is built solely from estimated rooms sold = rooms covered × estimated OCC, a rearrangement of the metric definition used in this article (estimated OCC = rooms sold as a share of total rooms). Both axes stay within the observed values presented in the text, and no demand forecast or new estimate is included.
■ Limitations and caveats
Both ADR and OCC are estimates based on publicly listed OTA inventory and differ from each property’s actual settled prices and accounting occupancy. Figures for August 2026 onward are estimates based on listed levels as of the survey date and will shift as the check-in date approaches. Estimated OCC drifts slightly upward later as observations accumulate, so the values here are a snapshot as of preparation. Listed prices and ADR use different bases and cannot be compared directly. New openings are confirmed by OTA listing rather than a complete census, and the most recent months are understated because of observation lead time. Building plans are a lower bound on a building-confirmation basis.
■ Market data
- MetroEngines Research — monthly estimated settled ADR series by municipality (January 2024 – December 2026), estimated occupancy by property type (June and July 2026 stays), listed-price aggregation by day of week
- MetroEngines Research & Consulting — new-opening data (confirmed by OTA listing; 49 properties in 2025, 27 in 2026)
■ Government statistics and public data
- Ministry of Land, Infrastructure, Transport and Tourism, Statistical Survey on Building Construction (building plans including accommodation facilities; 5 in Kanagawa)
- Japan Tourism Agency, Overnight Travel Statistics Survey
- Japan National Tourism Organization (JNTO), Statistics on Foreign Visitors to Japan
■ REIT
- Ownership master compiled from the disclosure materials of each listed hotel REIT (as of August 2026, 302 domestic properties)
■ Reference sites