

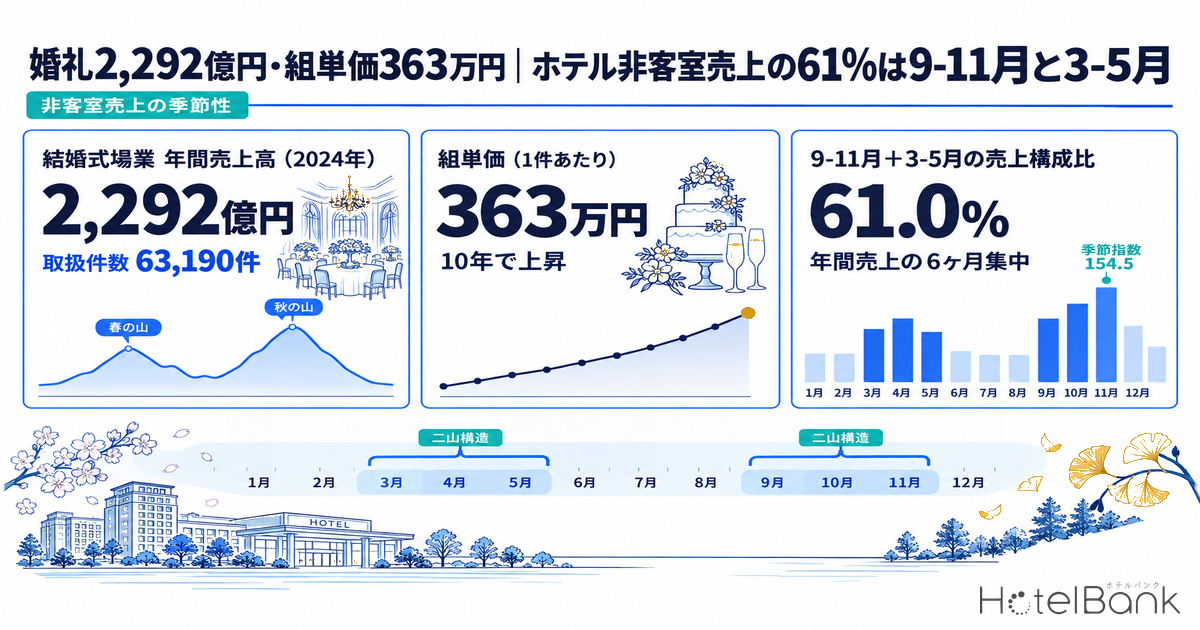
When hotel profitability is discussed, the conversation lands almost entirely on guest rooms. Occupancy, ADR, RevPAR — every metric disclosed monthly is a room metric. Yet in full-service hotels, non-room departments such as weddings, banquets and restaurants generate as much revenue as rooms do, and sometimes more. This article layers the monthly series for the wedding venue industry from the METI Current Survey of Selected Service Industries (特定サービス産業動態統計調査) over IR disclosures from listed hotel operators and our own property-distribution data, to size non-room revenue and map its seasonality in numbers.
Metric Definitions Used in This Article
- ADR (average daily rate): an estimated transacted rate (tax-exclusive equivalent), derived by applying a property-type correction coefficient to the lowest published plan level each property lists on booking sites (two guests per room, per-room rate, tax-inclusive). Cross-checked against property-level results disclosed by listed hotel REITs (91 properties, most recent three months), the median error is approximately 7%. These are estimates and differ from each property’s actual transacted prices and accounting figures. Area-level ADR is the median across the properties covered (the level of a typical property in that area).
- Revenue per wedding: wedding venue industry revenue divided by the number of weddings handled, i.e. the value per event. Calculated from the original METI statistical tables; consumption tax treatment follows the source statistics.
- Seasonal index: each year’s monthly values indexed to that year’s monthly average (= 100), then averaged across multiple years. It strips out year-to-year differences in level so that only the shape of the month-by-month pattern is compared.
- Data sources: METI Current Survey of Selected Service Industries, company IR disclosures, MetroEngines Research
- — ¥229.3bn and 63,190 weddings: 2024 revenue and volume for the wedding venue industry (specialist operators). Revenue per wedding was approximately ¥3.63M — a 28.7% fall in volume and a 32.8% rise in unit revenue versus 2015
- — 60.9%: the share of 2024 annual revenue landing in September–November (34.0%) and March–May (27.0%). The peak month was November in 2023 and 2024, and October in 2022
- — 64.8% / 82.4%: non-room share of revenue. Hotel New Grand across its three disclosed divisions (December 2025–May 2026), and the Fujita Kanko Luxury & Banquet segment (fiscal year to December 2025)
- — +44.8pt: the October gap between the wedding revenue index of 145.0 and the city hotel estimated transacted ADR index of 100.2. August runs the other way — ADR index 109.0 against weddings at 64.9
- — 1,153 city hotels and 1,728 resort hotels (as of August 2026). Among the 12 prefectures in our table, Osaka has the highest city hotel share of all properties in the prefecture at 7.9%
The monthly rhythm of a ¥229.3bn industry — 61% of annual revenue in six months
Start with the market calendar. According to the wedding venue industry series (enterprise survey) in the METI Current Survey of Selected Service Industries, 2024 revenue was ¥229.3bn on 63,190 weddings handled. As of December 2024 the survey covered 398 enterprises (on an establishment basis) employing 19,608 people.
One caveat is worth setting out first. The statistical category “wedding venue industry” covers enterprises whose principal business is operating wedding venues; wedding departments run alongside hotels or restaurants are not included (the survey unit changed from establishment to enterprise with the January 2015 round). In other words, this series is not hotel wedding revenue itself — it is the same demand calendar that hotel banquet floors face, observed from the specialist operator side. Hotel-side figures are picked up from IR disclosures later in this article.
Broken out by month, the shape is unmistakable. In 2024 the peak month was November at ¥29.79bn and the trough was January at ¥11.11bn. Taking the seasonal index as a three-year average across 2022–2024, November reads 154.5 against January at 50.2 — a 3.1x spread.
Source: METI Current Survey of Selected Service Industries (wedding venue industry, enterprise survey); compiled by the HotelBank Editorial Team
A clear twin-peak structure emerges. The first peak runs September to November: those three months alone accounted for ¥77.87bn in 2024, or 34.0% of the year. The second peak is March to May at ¥61.82bn, or 27.0%. Together, six months carry 60.9% of annual revenue. The remaining six — January, February, June, July, August and December — divide the other 39.1% between them.
Overlay three years of lines and the peaks barely move. November was the largest month in both 2023 and 2024, October in 2022, and January was the smallest month in all three years. Levels differ year to year, but the shape holds. For planning the utilisation of a fixed asset like a banquet floor, that stability is a workable property.
| Month | Revenue (¥M) | Weddings (events) | Per wedding (¥10k) | Seasonal index (2022-24 average) |
|---|---|---|---|---|
| January 2024 | 11,111 | 2,791 | 398.1 | 50.2 |
| February | 18,798 | 5,067 | 371.0 | 74.7 |
| March | 22,141 | 6,498 | 340.7 | 107.7 |
| April | 17,744 | 5,385 | 329.5 | 100.7 |
| May | 21,934 | 6,052 | 362.4 | 124.2 |
| June | 17,537 | 4,754 | 368.9 | 88.0 |
| July | 13,451 | 3,806 | 353.4 | 79.8 |
| August | 11,290 | 3,038 | 371.6 | 64.9 |
| September | 22,137 | 5,836 | 379.3 | 117.6 |
| October | 25,941 | 7,191 | 360.7 | 145.0 |
| November | 29,794 | 8,274 | 360.1 | 154.5 |
| December | 17,375 | 4,498 | 386.3 | 92.8 |
| 2024 total | 229,253 | 63,190 | 362.8 | — |
Source: METI Current Survey of Selected Service Industries (wedding venue industry, enterprise survey, N=398 establishments as of December 2024); compiled by the HotelBank Editorial Team
63,190 weddings at ¥3.63M each — how a decade moved
Next, the split between volume and price over the long run. Across the ten years from 2015 to 2024, weddings handled fell from 88,590 to 63,190 while revenue per wedding rose from roughly ¥2.73M to roughly ¥3.63M. Volume dropped 28.7%, unit revenue climbed 32.8%, and total revenue moved only 5.2% — from ¥242.0bn to ¥229.3bn.
Source: METI Current Survey of Selected Service Industries (wedding venue industry, enterprise survey); compiled by the HotelBank Editorial Team
The series swings hard through the pandemic year of 2020 (¥111.6bn on 36,783 weddings), but from 2022 onward volume and unit price have moved in opposite directions. Comparing 2019 with 2024: volume fell 26.8% from 86,304 to 63,190, revenue per wedding rose 23.4% from roughly ¥2.94M to roughly ¥3.63M, and total revenue moved 9.7%, from ¥253.8bn to ¥229.3bn.
A rising price per event has a direct implication for how banquet floor space is used. The money that lands from taking a single booking is more than 30% larger than it was a decade ago, which tilts the model toward earning on unit price rather than on turns per floor. The monthly detail points the same way: in 2024, December ran at roughly ¥3.86M and January at roughly ¥3.98M per wedding — the thinner the month by volume, the higher the price per event.
On the vintage and publication status of these statistics: the METI Current Survey of Selected Service Industries ended with the December 2024 round across all 20 industries it covered, including the wedding venue industry. The long-run time series used here (monthly, actual values) was last updated on 31 March 2025 and runs through December 2024, which is the most recent monthly data available from that survey. Its successor, the Survey on Service Industries run by the MIC Statistics Bureau, has been conducted since the January 2025 round, but publishes at the industry sub-group level (categories such as “other living-related services”), with no standalone monthly series for the wedding venue industry (checked through the preliminary June 2026 figures). The “most recent 12 months” in this article therefore refers to January–December 2024.
What hotel IR disclosures show — banquets outrunning rooms
So how large is non-room revenue on the hotel side? Few listed hotel operators disclose actual amounts by division, but assembling what is available draws the outline.
At Hotel New Grand (ホテル、ニューグランド, 9720), divisional revenue for the first half of the fiscal year to November 2026 (1 December 2025 to 31 May 2026) was ¥1.115bn for rooms (up 9.5% year on year), ¥0.818bn for restaurants (up 10.4%) and ¥1.236bn for banquets (up 6.3%). Against the ¥3.169bn total of those three disclosed divisions, banquets account for 39.0% — ahead of rooms at 35.2%. The hotel business segment as a whole came to ¥3.524bn (up 7.9%). The company does not break its banquet division down between weddings and general banquets.
Fujita Kanko (藤田観光, 9722) reported consolidated revenue of ¥82.00bn and operating profit of ¥13.80bn for the fiscal year to December 2025 (1 January to 31 December 2025). The company publishes a revenue breakdown: rooms ¥58.12bn (prior year ¥53.84bn), weddings ¥7.71bn (¥7.10bn), banquets ¥3.63bn (¥3.07bn), food and beverage ¥3.38bn (¥3.30bn), and day-use and leisure ¥1.87bn (¥1.70bn) — every line above the prior year. Weddings, banquets and food and beverage together came to ¥14.72bn, or 18.0% of consolidated revenue.
By segment, the Luxury & Banquet business — which includes Hotel Chinzanso Tokyo (ホテル椿山荘東京) — reported ¥20.12bn of revenue from external customers, split into rooms ¥3.53bn (17.6%), weddings ¥7.71bn (38.3%), banquets ¥3.63bn (18.0%), food and beverage ¥3.38bn (16.8%) and other ¥1.87bn (9.3%). Non-room accounts for 82.4%. On the wedding division the company attributes the increase in events held to strengthening both the hardware and the service side, including banquet room renovations and improved proposal capability.
Source: company IR disclosures (Hotel New Grand, H1 results for the fiscal year to November 2026; Fujita Kanko, results for the fiscal year to December 2025); compiled by the HotelBank Editorial Team
Imperial Hotel (帝国ホテル, 9708) does not disclose divisional amounts in its earnings release, but hotel business revenue for the fiscal year to March 2026 was ¥55.87bn (up 6.7% year on year) and consolidated revenue ¥56.27bn (up 7.0%). On banquets the company notes that although total attendance at general banquets fell, higher unit prices improved profitability per event and lifted revenue; on weddings, that revenue rose as the company worked to win volume centred on small-scale ceremonies. The explanation is growth through unit price and event mix rather than event count.
| Disclosing entity | Period | Rooms | Non-room | Disclosed divisions |
|---|---|---|---|---|
| Hotel New Grand (three disclosed divisions) |
Dec 2025 – May 2026 |
35.2% ¥1.115bn |
64.8% ¥2.054bn |
Rooms / restaurants / banquets |
| Fujita Kanko (Luxury & Banquet segment) |
Jan 2025 – Dec 2025 |
17.6% ¥3.533bn |
82.4% ¥16.591bn |
Rooms / weddings / banquets / F&B / other |
| Fujita Kanko (consolidated) |
Jan 2025 – Dec 2025 |
70.9% ¥58.121bn |
29.1% ¥23.883bn |
As above (including limited-service properties) |
| Imperial Hotel (hotel business) |
Apr 2025 – Mar 2026 |
Divisional amounts not disclosed in the earnings release Hotel business revenue ¥55.865bn (up 6.7% year on year) |
Qualitative commentary only | |
Source: company IR disclosures; compiled by the HotelBank Editorial Team. Shares are calculated on the sum of disclosed divisions for Hotel New Grand and the Fujita Kanko Luxury & Banquet segment, and on consolidated revenue (¥82.004bn) for Fujita Kanko consolidated
What these three figures say together is that the depth of non-room revenue is determined not by whether a business is a hotel, but by what floor space it holds. Fujita Kanko on a consolidated basis, carrying a large number of limited-service properties, is room-led with rooms at 70.9%; the Luxury & Banquet segment alone, built around large banquet floors, reaches 82.4% non-room. Within a single company, changing the mix of floor space changes the character of the earnings this dramatically.
REIT monthly reporting does not show non-room — a note
The hotel performance data investors touch most frequently is the monthly operating report from listed hotel REITs. What those disclose, however, is centred on the three room metrics; banquet and wedding revenue is not included. For reference, the most recent published figures: Invincible Investment Corporation (インヴィンシブル投資法人) reported July 2026 results for 101 domestic hotels at 86.3% occupancy, ADR ¥15,100, RevPAR ¥13,039 and revenue of ¥10.027bn (year on year: occupancy +1.9pt, ADR -1.0%, RevPAR +1.2%). Japan Hotel REIT Investment Corporation (ジャパン・ホテル・リート投資法人) reported July 2026 results for its 29 hotels under variable-rent and similar schemes at 83.1% occupancy, ADR ¥21,806, RevPAR ¥18,119 and revenue of ¥7.023bn (occupancy +4.0pt, ADR +0.1%, RevPAR +5.1%).
The point to watch is how the aggregation scope is stated. “101 domestic hotels” and “29 hotels under variable-rent and similar schemes” are headline populations defined differently by each investment corporation. Even where a report says “entire portfolio”, a footnote may exclude properties closed for renovation. Reading absolute ADR or RevPAR levels side by side across investment corporations therefore does not really hold up, and this article keeps REIT figures to a supporting role — a check on where the room side currently stands. Sizing non-room revenue means going back to the divisional disclosures of operating companies covered in the previous section.
Room and non-room seasonality diverge by 44pt in September–October
If non-room revenue is to be assessed as upside beyond the rooms business, what matters most in practice is whether the two calendars overlap or diverge. So we placed the wedding seasonal index from the preceding sections alongside the seasonal index of our own estimated transacted ADR for city hotels, on the same measuring stick.
The room-side index covers city hotel estimated transacted ADR across the 12 prefectures with the largest city hotel counts (Tokyo, Osaka, Kanagawa, Aichi, Fukuoka, Kyoto, Hokkaido, Hyogo, Chiba, Saitama, Miyagi and Hiroshima) over the 36 months from September 2023 to August 2026, with each prefecture indexed to its own period average of 100 and then averaged (N=36 observations per month).
Source: weddings = METI Current Survey of Selected Service Industries (2022-2024 average); rooms = MetroEngines Research (city hotel estimated transacted ADR, 12 prefectures, September 2023 – August 2026, N=36 observations per month); compiled by the HotelBank Editorial Team
The two lines neither sit on top of each other nor run cleanly in opposite phase. The character shows up in four situations.
| Month | Room ADR index | Wedding revenue index | Gap | How to read it |
|---|---|---|---|---|
| October | 100.2 | 145.0 | +44.8pt | Rooms at a normal month while non-room hits its second-largest peak |
| September | 95.5 | 117.6 | +22.1pt | Non-room fills a month where rooms sit below the annual average |
| November | 106.0 | 154.5 | +48.5pt | Both peak at once. Peak simultaneous load on staffing and kitchens |
| August | 109.0 | 64.9 | −44.1pt | Rooms at their annual high, non-room second-lowest of the year |
| January | 93.0 | 50.2 | −42.8pt | Both in their annual trough band. Fixed costs weigh most heavily |
| May | 104.0 | 124.2 | +20.2pt | The spring peak. Holiday-week room demand runs alongside weddings |
Source: METI Current Survey of Selected Service Industries; MetroEngines Research; compiled by the HotelBank Editorial Team
Three points follow. First, September and October hold room rates around the annual average while non-room enters its yearly peak. For a full-service property, these two months are when non-room contributes relatively the most. Second, August is the exact reverse: rooms climb to their annual high (index 109.0) while non-room sits at 64.9. Summer earnings lean heavily on rooms. Third, November sees both peak together. It is the thickest month in revenue terms, but because banquet and room operations ramp up simultaneously, it is also the month where staffing and kitchen capacity constraints surface most sharply.
Translated into an investment and asset management view, a property holding non-room floor space carries one extra revenue wave that the room-only monthly curve cannot explain. Estimating the monthly distribution of cash flow from room RevPAR alone tends to skew low in September and October and high in August. On how to use room-side RevPAR versus total-revenue measures such as TRevPAR and GOPPAR that include non-room, see What Is RevPAR? ADR x Occupancy, and Why GOP Splits 1.81x in 2026.
Where full-service supply is concentrated — 1,153 city and 1,728 resort hotels
Finally, our own data shows where across Japan the properties that could hold this kind of non-room floor space actually sit. Of roughly 168,000 domestic properties tracked by MetroEngines Research, we take as our population the approximately 27,000 properties and 1.26 million rooms whose operation can be confirmed on booking sites. As of August 2026, 1,153 properties nationwide were classified as city hotels and 1,728 as resort hotels.
| Prefecture | City properties |
City est. ADR |
Resort properties |
Resort est. ADR |
All properties in prefecture |
City share |
|---|---|---|---|---|---|---|
| Tokyo | 120 | ¥21,265(N=109) | 22 | ¥18,885(21) | 2,406 | 5.0% |
| Osaka | 98 | ¥13,078(N=97) | 7 | ¥19,697(7) | 1,242 | 7.9% |
| Hokkaido | 76 | ¥17,801(N=75) | 154 | ¥19,240(147) | 2,185 | 3.5% |
| Kyoto | 65 | ¥19,662(N=59) | 17 | ¥18,260(14) | 2,257 | 2.9% |
| Chiba | 53 | ¥10,699(N=53) | 76 | ¥20,646(72) | 1,140 | 4.6% |
| Hyogo | 49 | ¥13,366(N=47) | 51 | ¥24,538(51) | 1,218 | 4.0% |
| Kanagawa | 43 | ¥14,683(N=42) | 57 | ¥28,639(51) | 1,130 | 3.8% |
| Fukuoka | 42 | ¥18,479(N=41) | 16 | ¥22,355(14) | 949 | 4.4% |
| Aichi | 32 | ¥12,030(N=31) | 11 | ¥15,967(11) | 756 | 4.2% |
| Shizuoka | 31 | ¥13,522(N=31) | 154 | ¥22,524(150) | 1,905 | 1.6% |
| Nagano | 18 | ¥13,891(N=16) | 139 | ¥21,662(124) | 2,120 | 0.8% |
| Okinawa | 15 | ¥20,654(N=15) | 303 | ¥22,291(282) | 2,229 | 0.7% |
Source: MetroEngines Research (as of August 2026; figures in parentheses are the number of properties used to compute estimated transacted ADR); compiled by the HotelBank Editorial Team
In absolute city hotel counts, Tokyo leads with 120, followed by Osaka at 98, Hokkaido at 76 and Kyoto at 65. Measured as a share of all properties in the prefecture, however, Osaka is highest among the 12 prefectures in the table at 7.9%, followed by Tokyo at 5.0%, Chiba at 4.6%, Fukuoka at 4.4% and Aichi at 4.2%. Even among urban markets, city hotel density varies by nearly a factor of two between prefectures.
On estimated transacted ADR as of August 2026, the leaders among the 12 prefectures in the table are, for city hotels, Tokyo at ¥21,300, Okinawa at ¥20,700, Kyoto at ¥19,700 and Fukuoka at ¥18,500; and for resort hotels, Kanagawa at ¥28,600, Hyogo at ¥24,500, Shizuoka at ¥22,500 and Fukuoka at ¥22,400. Note that these are room rates only — non-room revenue, banquet floors included, is not reflected in them. Two properties at the same ADR level can post very different annual revenue per property depending on whether they operate banquet space and hold weddings.
The prefectures thick with resort hotels (Okinawa 303, Hokkaido 154, Shizuoka 154, Nagano 139) and those thick with city hotels (Tokyo, Osaka, Hokkaido, Kyoto) overlap only partially. Because wedding and banquet demand is fundamentally tied to resident population and corporate density, the former face a different demand pool in the form of destination weddings, while the latter face local weddings and corporate banquets. Hokkaido, thick in both, sits in a somewhat unusual position.
Conclusion — non-room revenue is a second seasonal curve
To draw the figures together. On a specialist-operator basis, the wedding venue industry generated ¥229.3bn on 63,190 weddings in 2024, at roughly ¥3.63M per wedding. It has a twin-peak structure in which 34.0% of annual revenue lands in September–November and 27.0% in March–May, for 60.9% across six months. Over ten years volume fell 28.7% and revenue per wedding rose 32.8%, tilting the model toward earning per event.
On the hotel side, judging from operators that disclose actual amounts by division, the non-room share swings widely with the mix of floor space. Non-room at 64.8% across three disclosed divisions (Hotel New Grand), 82.4% in a segment built around banquet floors (Fujita Kanko Luxury & Banquet), and rooms carrying 70.9% at the consolidated level including limited-service properties (the same company) all sit side by side in the same set of filings.
And the seasonality does not fully overlap with that of rooms. In September and October room rates hold around the annual average while non-room enters its yearly peak, with the index gap opening to 44.8pt in October (48.5pt in November, when both peak together). August reverses the relationship: rooms at their annual high of 109.0 against non-room at 64.9. Build the monthly distribution of annual cash flow from room RevPAR alone and those two situations are where it goes wrong.
The question of how to reallocate floor space — whether banquet halls should be converted into guest rooms — is covered in our earlier piece Banquet Floors to Guestrooms: 20 Markets Clear the ¥9,600 ADR Line. This article deals with the step before that: establishing how large non-room revenue is and what shape its calendar takes. Before judging the case for conversion, knowing the revenue calendar the floor space currently generates is the premise on which the assessment rests.
Related Reading
- Banquet Floors to Guestrooms: 20 Markets Clear the ¥9,600 ADR Line
- Hotel Economics 2026: ¥1.86-3.51M Revenue per Room, 4 Operating Models
- Kanagawa 2026 ADR: City Hotels +14.7% vs Business +2.3%, Growth Stalls
- What Is a City Hotel? Business Hotel Differences and ¥27,208 Rates
- What Is RevPAR? ADR x Occupancy, and Why GOP Splits 1.81x in 2026
- Japan’s ¥2.83tn Hotel Room Revenue Pool: Top 5 Prefectures 48.0%
- City Hotels: 45.9% of Guest Nights Are Foreign — Ryokan +3.7%
References and Sources
■ Government statistics
- METI Current Survey of Selected Service Industries, long-run time series table 16, wedding venue industry (enterprise survey) (monthly actuals, table ID 0004027639; annual actuals, 0004027636; last updated 31 March 2025; final month covered December 2024)
- METI Current Survey of Selected Service Industries — survey overview and notice of discontinuation (all 20 industries discontinued after the December 2024 round)
- Government Statistics Online Survey Portal, notice on the discontinuation of the METI Current Survey of Selected Service Industries
- MIC Statistics Bureau, Survey on Service Industries — overview (conducted from the January 2025 round, published at the industry sub-group level)
■ Listed company IR disclosures
- Hotel New Grand (9720), H1 results for the fiscal year to November 2026 (published July 2026)
- Fujita Kanko (9722), results and presentation materials for the fiscal year to December 2025 (published 12 February 2026)
- Imperial Hotel (9708), results and presentation materials for the fiscal year to March 2026 (published 14 May 2026)
- Invincible Investment Corporation (8963), monthly operating report for July 2026 (101 domestic hotels)
- Japan Hotel REIT Investment Corporation (8985), monthly operating report for July 2026 (29 hotels under variable-rent and similar schemes)
■ Market data
- MetroEngines Research — distribution of city and resort hotels and estimated transacted ADR (as of August 2026, and the monthly series from September 2023 to August 2026)