

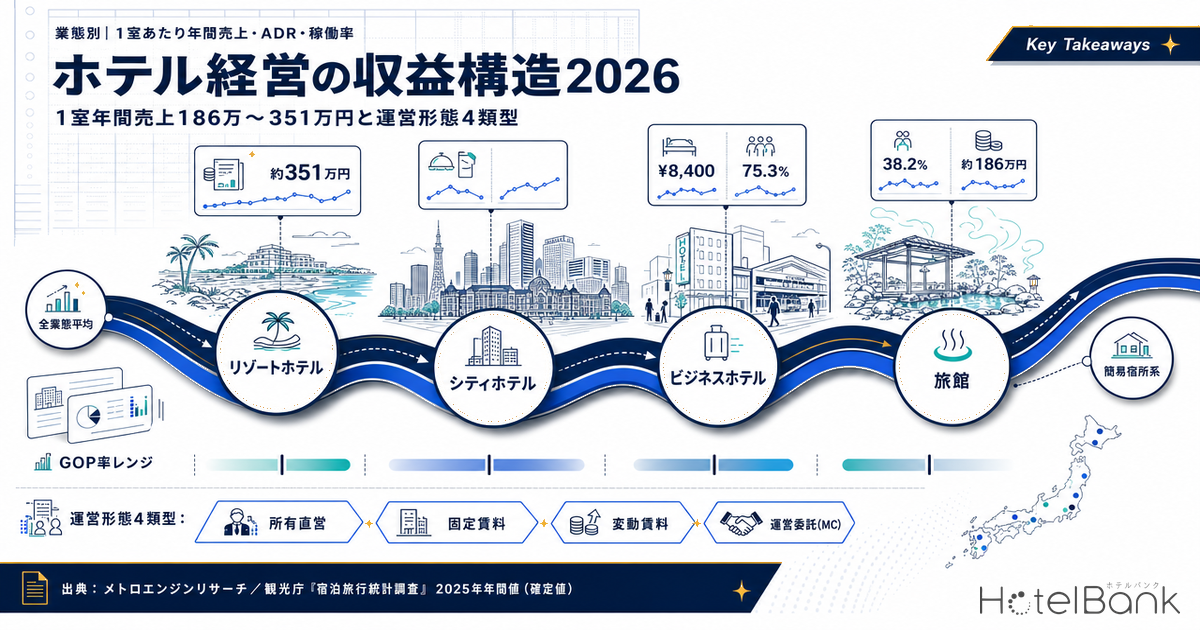
Strip a hotel business down far enough and its revenue is a single multiplication: number of rooms × occupancy rate × ADR (average daily rate) × 365 days. On the cost side, three items dominate: labour, utilities, and either rent or depreciation. Which factor of that multiplication you go after is what a property type really is; who absorbs the cost is what an operating model really is. This article pairs MetroEngines Research’s estimated settled ADR with the Japan Tourism Agency’s final 2025 annual figures from the “Overnight Travel Statistics Survey” to put numbers on two questions, by property type: how much annual revenue does one room generate, and how much of it survives to the bottom line?
Metric Definitions Used in This Article
- ADR (average daily rate): an estimated settled rate (tax-exclusive equivalent), calculated by applying property-type correction factors to the lowest publicly listed plan level each property posts on OTAs and elsewhere (double occupancy, per-room rate, tax-inclusive). Cross-checked against property-level results disclosed by listed hotel REITs (91 properties, most recent three months), the median error is approximately 7%. These are estimates and differ from each property’s actual transacted prices and accounting figures. Area-level ADR is the median of the properties covered (the level of a typical property in that area). The property-type ADRs in this article are weighted averages across all 47 prefectures, weighted by the number of properties covered.
- Reported occupancy rate (room occupancy rate): the room occupancy rate from the Japan Tourism Agency’s “Overnight Travel Statistics Survey”, 2025 (Reiwa 7) annual figures, final. National and accommodation-type published values are quoted as-is. Only these published values are used in the per-room annual revenue calculations.
- OCC (occupancy, MetroEngines estimate): the share of sold rooms against total rooms in an area (an estimate based on OTA sales inventory). It reflects how far the inventory listed for sale on OTAs has been sold down, and differs from a property’s true overall occupancy. Because its population and calculation method differ from the reported occupancy rate above, this article does not mix the two and shows it in a separate reference column.
- RevPAR (revenue per available room): ADR × occupancy rate.
- GOP (gross operating profit): profit after deducting the costs directly incurred in running the property. This article deals only with indicative ranges by property type; definitions and scope of calculation are left to a separate piece.
- Data sources: MetroEngines Research / Japan Tourism Agency, “Overnight Travel Statistics Survey”
- — Annual revenue per room runs at roughly ¥3.51M for resort hotels, ¥3.40M for city hotels, ¥2.31M for business hotels and ¥1.86M for ryokan. The ADR ranking and the revenue ranking do not match.
- — Ryokan ADR is around ¥13,300, some 60% above the ¥8,400 of business hotels, but the occupancy gap — 38.2% versus 75.3% (Japan Tourism Agency, January–December 2025, final) — reverses the annual revenue ranking.
- — Annual GOP per room is ¥0.92M–1.39M for business hotels, ¥0.70M–1.40M for resorts, ¥0.34M–1.02M for city hotels and ¥0.09M–0.28M for ryokan. Revenue scale and profit depth do not move together.
- — The four operating models are a design for allocating demand-volatility risk. Variable rent takes 97.5% of the amount above a threshold; management contracts are typically cited at a base of 2–4% of revenue plus 8–12% of GOP.
- — The viability line is ADR × occupancy. At an annual GOP of ¥1M per room and a 45% GOP margin, that product must reach ¥6,088 — meaning 76.1% occupancy at an ADR of ¥8,000, or 38.1% at ¥16,000.
Revenue is nothing more than three numbers multiplied together
Compared with other real-estate rental businesses, the revenue structure of a hotel is unusually simple. The number of rooms you hold cannot be changed. Only two things can: how many of those rooms sold (occupancy) and at what price each sold (ADR). Multiply those two and you have RevPAR; multiply RevPAR by the room count and 365 days and you have annual rooms revenue.
That is why almost every management discussion reduces to these two axes. A property with high occupancy but a low rate and one with a high rate but occupancy below half will differ by nearly a factor of two in annual revenue at the same room count. And the important point is that which of these two axes you choose to fight on is what “property type” actually means. Business hotels are designed to capture occupancy; ryokan and resorts are designed to capture rate and length-of-stay value.
On the cost side, three items dominate. First, labour. The guideline for Japan’s fiscal 2026 regional minimum wages was set at a national weighted average of ¥1,176, an increase of ¥55 (+4.9%) from the previous year. In accommodation, where front desk, housekeeping and food-and-beverage are all labour-intensive, that increase feeds straight through to the income statement. Second, utilities. These are variable costs incurred daily on a per-room basis and are directly exposed to movements in electricity unit prices. Third, rent or depreciation. Which party’s income statement this lands on changes with the operating model discussed below, and structurally it is the single largest fork in the road.
The picture by property type — annual revenue per room runs ¥1.86M to ¥3.51M
So let us put the actual numbers on the table. Take the estimated settled ADR that MetroEngines Research compiled for July 2026 across all 47 prefectures, weight it by property type, and multiply it by the room occupancy rates the Japan Tourism Agency published for 2025 (final figures). That gives an indicative annual revenue per room.
| Property type | Estimated settled ADR July 2026, national weighted avg |
Properties in sample | Reported occupancy JTA, Jan–Dec 2025, final |
Annual revenue per room (indicative) |
Ref: MetroEngines OCC estimate as of July 2026 |
|---|---|---|---|---|---|
| Resort hotels | ¥16,900 | 1,613 | 56.9% | approx. ¥3.51M | 85.4% |
| City hotels | ¥12,600 | 1,117 | 74.1% | approx. ¥3.40M | 88.9% |
| Business hotels | ¥8,400 | 7,398 | 75.3% | approx. ¥2.31M | 88.5% |
| Ryokan | ¥13,300 | 6,814 | 38.2% | approx. ¥1.86M | 81.9% |
| Simple lodging (capsule hotels, etc.) |
¥4,700 | 119 | 29.6% | approx. ¥0.50M | 96.3% |
Source for ADR and MetroEngines OCC estimate: MetroEngines Research, compiled by the HotelBank Editorial Team / Source for reported occupancy: Japan Tourism Agency, “Overnight Travel Statistics Survey”, 2025 annual figures (final)
Why the two occupancy figures are not mixed. “Reported occupancy” is the Japan Tourism Agency’s published figure on a full-census basis, and days on which a property was not trading are still counted in the calendar-day denominator. The “MetroEngines OCC estimate” is an estimate of how far the sales inventory posted on OTAs has been sold down; days on which no inventory was posted at all, and rooms sold direct or to groups without going through an OTA, do not enter the denominator. Because the population and the calculation method differ, only the published figure is used for the per-room annual revenue calculation, and our own estimate is separated out as a reference column for gauging how tight supply and demand are. Note also that the simple-lodging sample covers only 119 properties, so that row should be read as indicative.
The first thing that stands out is that the ADR ranking and the annual revenue ranking do not match. Estimated settled ADR at ryokan is around ¥13,300, nearly 60% above the ¥8,400 of business hotels. Yet on annual revenue per room the order flips: ¥1.86M for ryokan against ¥2.31M for business hotels. The reason is occupancy — 38.2% for ryokan versus 75.3% for business hotels (both Japan Tourism Agency, January–December 2025, final), close to twice as many nights sold. The occupancy gap does more to annual revenue than the rate gap does.
That occupancy gap does not, however, translate directly into good or bad management. Because the Japan Tourism Agency computes room occupancy as “rooms used ÷ (rooms × calendar days)”, properties that trade mainly at weekends and in high season, or that set closure days, come out structurally low. Ryokan occupancy looks modest partly because the population includes many properties that have chosen an operating design not premised on trading every day of the year at full house.
There is one more premise you cannot ignore when reading ryokan ADR. The standard listed plan at a ryokan includes dinner and breakfast, so that ADR embeds the price of two meals. In other words, the same ¥13,300 contains something quite different from the rate at a room-only business hotel. That difference becomes decisive in the cost structure discussed in the next section.
Source: MetroEngines Research (ADR) / Japan Tourism Agency, “Overnight Travel Statistics Survey”, 2025 annual figures, final (room occupancy rate), compiled by the HotelBank Editorial Team
One further dataset captures the character of each property type succinctly. Japan Tourism Agency statistics put the number of accommodation properties nationwide at 74,125 as of December 2025, and total guest nights in 2025 at 661.10 million (of which 179.92 million, or 27.2%, were foreign visitors). Line those two up as shares by property type and the distribution of properties and the distribution of guest nights barely overlap at all.
Source: Japan Tourism Agency, “Overnight Travel Statistics Survey”, 2025 annual figures (final); property counts as of December 2025, compiled by the HotelBank Editorial Team
Business hotels account for just 11.3% of all properties (8,410 properties) but 46.3% of guest nights. The model runs a large room count per property at high occupancy throughout the year. Ryokan, by contrast, make up 25.2% of properties (18,700) but only 12.0% of guest nights, and simple lodging 28.4% of properties (21,080) against a 4.9% share of guest nights. Counted by number of properties, Japan’s accommodation industry is overwhelmingly small-scale; counted by nights sold, large business hotels carry close to half of it. That asymmetry sits behind the differences in revenue structure described below.
Cost structure and GOP — how much of revenue survives
Revenue on its own tells you nothing until labour, utilities, food cost, OTA commissions, outsourced housekeeping and the rest have been deducted. That figure — profit after the costs directly incurred in running the property — is GOP (gross operating profit), and it is the single most referenced metric in hotel investment. Definitions, scope of calculation and the link to RevPAR are treated in a separate article; here we deal only with indicative ranges by property type.
The most reliable public information on where GOP margins actually sit comes from the disclosures of listed hotel REITs. Invincible Investment Corporation (インヴィンシブル投資法人) has disclosed a GOP margin of 38.9% for the fiscal period ended December 2024 (+1.6pt year on year) and 36.0% for the period ended June 2025 (+1.1pt) across the 91 properties it owns and MHM operates. That is the actual result for a portfolio mixing full-service and limited-service properties; narrow the field to a single property type and the range widens further.
| Property type | Annual revenue per room | Indicative GOP margin range | Annual GOP per room | Structural characteristics |
|---|---|---|---|---|
| Business hotels | approx. ¥2.31M | 40–60% | ¥0.92M–1.39M | Rooms revenue dominates. Food and beverage is small and headcount per room is low |
| Resort hotels | approx. ¥3.51M | 20–40% | ¥0.70M–1.40M | Rates are high, but staffing must match facility scale and seasonal swings |
| City hotels | approx. ¥3.40M | 10–30% | ¥0.34M–1.02M | Food, beverage and banqueting lift revenue scale, but the cost base is correspondingly heavy |
| Ryokan | approx. ¥1.86M | 5–15% | ¥0.09M–0.28M | Two meals are standard, so food cost plus kitchen and service labour are built into revenue |
Source for GOP margin ranges: published materials from Relo Hotel Solutions / Annual revenue per room calculated from MetroEngines Research ADR and Japan Tourism Agency room occupancy rates, compiled by the HotelBank Editorial Team
Source: MetroEngines Research / Japan Tourism Agency, “Overnight Travel Statistics Survey” / indicative GOP margins published by Relo Hotel Solutions, compiled by the HotelBank Editorial Team
What this table shows is that the size of revenue and the depth of profit per room do not necessarily move together. Resort and city hotels top the table on annual revenue per room at ¥3.40M–3.51M, but apply the indicative GOP margins and their GOP per room is on a par with business hotels — or, at the bottom of the range, below them. Business hotels, third on revenue at ¥2.31M, carry no food-and-beverage division and hold headcount per room down, and at the midpoint of the range they retain the thickest profit of the four. The reason business hotels have grown to take 46.3% of nights from 11.3% of properties is captured right there.
Ryokan numbers need to be read with care. Because ryokan revenue includes the price of dinner and breakfast, the denominator of the GOP margin is inflated by food revenue. At the same time, the food cost and the kitchen and service labour needed to deliver those meals sit on the cost side. In other words, ryokan GOP margins look thin because a single ratio is being asked to express a composite structure — a food service business laid on top of a room-selling business. The strength of a ryokan lies not in GOP per room but in a design that achieves high rates and high stay value from a small number of rooms. Indeed, as discussed below, ryokan average 22.5 rooms, and the ability to start a business without building a large facility is an ease of entry no other property type offers.
The four operating models — who bears which risk
So far the discussion has been about how much the box earns. Next comes the question of whose income statement those earnings land on. In Japan, the ways hotel income is received sort broadly into four models.
| Model | How income is received | Risk borne by the owner | Risk borne by the operator | Indicative level |
|---|---|---|---|---|
| Owner-operated | Revenue and GOP both fall straight to the company’s own P&L | Everything — occupancy, rate, labour, utilities and repairs | Same entity, so no distinction | Maximum upside and maximum downside |
| Lease (fixed rent) |
The owner takes a fixed rental income. Operating results accrue to the operator | Tenant credit risk and rent revision at renewal | Absorbs all movement in occupancy and rate | Income is stable but there is no upside to capture |
| Lease (variable rent) |
Rent = a fixed component plus a variable component linked to GOP or revenue | Bears part of demand volatility, via the rent | Downside on fixed costs. Below the threshold the variable component is zero | See the REIT disclosure examples below |
| Management contract (MC) |
Revenue and GOP accrue to the owner. The operator receives a fee | Bears all demand volatility. Day-to-day operations are delegated | A smaller fee (since it is linked to revenue and GOP) | Base fee around 2–4% of revenue and incentive around 8–12% of GOP are the levels widely cited |
| Franchise (FC) |
Revenue and GOP accrue to the franchisee, which pays royalties to the franchisor | Bears both demand volatility and day-to-day operations | The franchisor’s risk is maintaining brand value | Rates and contributions differ by franchisor, so confirmation in the disclosure document is a precondition |
Management contract fee levels: compiled from published materials of hotel management companies and specialist consultancies. Compiled by the HotelBank Editorial Team
These four models are not a question of which is superior. They are a design for allocating the risk of demand volatility. Owner-operation captures all of the upside and takes all of the downside. Fixed rent is the exact opposite: the owner’s income is predictable, but in good times the upside flows to the operator. Variable rent was designed to fill the space between the two, and the disclosures of listed hotel REITs make the design thinking explicit.
Variable rent designs disclosed by listed hotel REITs
Japan Hotel REIT Investment Corporation (ジャパン・ホテル・リート投資法人) structures rent as a fixed component plus a variable component, and discloses the variable calculation as “variable rent = [hotel AGOP (adjusted GOP) − ¥2,980 million] × 97.5%”. Where the calculated amount falls below zero, variable rent is zero. In other words, only the portion of adjusted GOP above a set threshold flows to the owner, and the GOP up to that threshold remains with the operator as the means of covering its fixed costs. For the 27th fiscal period (ending December 2026), the REIT assumes RevPER (revenue per room) of ¥18,270 across the 29 properties where variable rent has been introduced.
Ichigo Hotel REIT Investment Corporation (いちごホテルリート投資法人) discloses that approximately 48% of its rental income is made up of variable rent. For the 21st fiscal period (ending January 2026), RevPER across 21 variable-rent properties was ¥10,121 (+2.9% year on year); for the 22nd period (ending July 2026) it assumes ¥8,865 across the same 21 properties (−9.5%). Properties acquired in 2025 use a rent structure combining a minimum guaranteed rent with variable rent, under a pass-through master lease.
The key to reading variable-rent levels is the existence of the threshold. Under the Japan Hotel REIT formula, no variable rent arises until adjusted GOP exceeds ¥2.98 billion. What the owner captures is 97.5% of everything beyond that line. Put the other way round, the operator has secured the GOP up to the threshold as its own share. Management contracts follow the same logic when fees are set at a base of roughly 2–4% plus an incentive of roughly 8–12% of GOP: separating the portion received as a fixed amount from the portion linked to results keeps both parties’ incentives and risk tolerance workable at once. The practical work of comparing management contract proposals on NOI after fees is a subject in its own right and is treated separately.
The entry point — choosing a licence category under the Hotel Business Act
Operating a business that lodges people for a fee requires a licence under the Hotel Business Act (旅館業法). The amendment that took effect on 15 June 2018 consolidated the previous four licence categories into three. The licensing authority is the governor of the prefecture in which the property is located (or the mayor or ward mayor where the city or special ward operates its own public health centre).
| Licence category | Definition under the Hotel Business Act | Property types mainly covered |
|---|---|---|
| Ryokan and hotel business | A business that establishes a facility and lodges people for a lodging fee, other than a simple lodging business or a boarding house business | Business hotels, city hotels, resort hotels and ryokan. The 2018 amendment merged the former hotel business and ryokan business categories into one |
| Simple lodging business | A business that establishes a structure and equipment in which the sleeping space is shared by multiple people, and lodges people for a lodging fee | Capsule hotels, hostels, guesthouses, pensions, mountain huts and the like. The minimum floor area standard was relaxed in April 2016 |
| Boarding house business | A business that establishes a facility and lodges people for a lodging fee charged in units of one month or longer | Extended-stay accommodation offered on a monthly basis |
Source: Japan Tourism Agency, Minpaku Portal Site, “About the Hotel Business Act”, compiled by the HotelBank Editorial Team
Structural and equipment standards — minimum guest room floor area, ventilation and natural lighting, bathing facilities, whether a front desk is required, and so on — are set for each licence category, and some localities add further requirements by ordinance. The same building with the same room configuration can face different requirements depending on the licence category and the municipality, so consulting the responsible public health centre before committing to a property is standard practice. Land-use zoning restrictions, change-of-use under the Building Standards Act, and obtaining a fire-service compliance notification all need to be checked in parallel.
The other axis of an opening decision is construction cost. Based on the Ministry of Land, Infrastructure, Transport and Tourism’s “Statistical Survey on Building Construction Starts”, 2025 hotel construction cost averaged ¥1.952M per tsubo (approx. 3.3 m²) across all structural types — ¥2.405M per tsubo for steel-frame and ¥2.026M for reinforced concrete — a sharp rise from ¥1.38M per tsubo in 2022. Comparing per-room construction cost against the per-room price implied by REIT acquisition prices is a separate exercise, and is worth working through before an investment decision.
Scale — which property types work at a small size
“How few rooms can I start with?” is the question operators considering an opening confront earliest. Within the scope MetroEngines Research tracks, 27,162 properties and 1,267,377 rooms nationwide showed confirmed OTA activity as of 2026. Aggregate those by property type and the standard scale of each type separates clearly.
| Property type | Properties | Rooms | Average rooms per property |
|---|---|---|---|
| City hotels | 615 | 118,335 | 192.4 |
| Business hotels | 5,847 | 592,694 | 101.4 |
| Resort hotels | 968 | 78,847 | 81.5 |
| Ryokan | 5,150 | 115,993 | 22.5 |
| Hostels | 914 | 16,240 | 17.8 |
| Guesthouses | 1,142 | 8,816 | 7.7 |
| Pensions | 1,074 | 8,841 | 8.2 |
| Minshuku | 901 | 7,278 | 8.1 |
Source: MetroEngines Research & Consulting (based on confirmed OTA listings; principal property types extracted from 27,162 properties / 1,267,377 rooms nationwide as of 2026), compiled by the HotelBank Editorial Team
Break the properties with registered room counts in the MetroEngines Research master down by size band and the pattern is sharper still. Of 14,906 ryokan, 10,980 — fully 73.7% — have 19 rooms or fewer. Among 12,475 business hotels, by contrast, only 1,790 (14.3%) have 19 rooms or fewer, while 4,228 (33.9%) have 100 rooms or more. Read plainly: the property types designed from the outset to work at a small scale are ryokan, guesthouses and pensions, while business hotels and city hotels are types premised on economies of scale.
Small scale carries its own preconditions, however. Look at room occupancy by employee headcount in the Japan Tourism Agency’s January–December 2025 figures (full year, final) and the gap is too large to ignore.
Source: Japan Tourism Agency, “Overnight Travel Statistics Survey”, 2025 annual figures (final), compiled by the HotelBank Editorial Team
Properties with 0–9 employees number 60,128 nationwide — 81.1% of the total 74,125 — and their room occupancy rate is 35.6% (January–December 2025). Against that, properties with 10–29 employees run at 70.4%, those with 30–99 at 71.5% and those with 100 or more at 70.8%; the level shifts by a full step at the ten-employee mark. The overall average is 61.6%.
This gap does not mean that small properties are run inefficiently. Properties with small teams include many that have chosen an operating design deliberately — not aiming for full-year occupancy, concentrating trading on peak season, or restricting seasons and days of the week to protect quality. What should be read into it is instead the precondition: if you are starting small, you need a rate design and a cost design that work even at annual occupancy of around 35–40%. Apply a P&L built on selling 300 nights a year to a property that sells only 140 and the plan will not stand up. The sensitivity table in the next section exists precisely to test that point numerically.
ADR moves with the season — do not build a plan on the annual average alone
Before turning to the sensitivity table, one fact is worth establishing. ADR is not constant through the year. Plot the monthly path of estimated settled ADR — weighted by the number of properties covered across all 47 prefectures — and overlay the years, and the seasonal waveform is plain to see.
Source: MetroEngines Research, compiled by the HotelBank Editorial Team (all 47 prefectures, all property types, weighted by the number of properties covered; the sample runs to roughly 15,800–17,200 properties in each month)
In 2025 the high points of the year came in August at ¥12,026 and November at ¥12,012, while June fell to ¥9,803. Even on the same national average, the monthly swing exceeds 20%. Into 2026, January came in at ¥11,219 and May at ¥11,129, with June at ¥9,354 (−4.6% year on year) and July at ¥10,125 (−4.4%). Build a business plan on annual average ADR alone and you will misread cash flow in the quiet months. When setting a debt repayment schedule in particular, funding needs to be planned around the monthly troughs.
The viability line — a sensitivity table of ADR × occupancy
■ Calculation assumptions
- Annual revenue per room = estimated settled ADR × occupancy rate × 365 days. Rooms revenue only; food and beverage, banqueting and other departmental revenue are excluded.
- ADR is the estimated settled ADR (tax-exclusive equivalent), not the listed price (all-plan average, tax-inclusive).
- Occupancy is on a calendar-day basis (closure days are included in the denominator) — the same definition as the room occupancy rate in the Japan Tourism Agency’s “Overnight Travel Statistics Survey”.
- The GOP margin is set at 45% as a conservative level for a limited-service property. Actual levels differ by property type, location and operating model (see the range table by property type in this article).
- The “viability line” takes an annual GOP of ¥1M per room as a provisional target and works back to the required revenue of ¥2.22M per room per year. That ¥1M figure is a provisional target set as a starting point for covering per-room construction cost, land acquisition cost, debt service and reserves for repairs; the level actually required changes with the acquisition price and the capital structure.
- This is a simplified calculation. An actual investment decision requires a detailed feasibility study.
On those assumptions, the table below calculates annual revenue per room for each combination of estimated settled ADR and occupancy rate.
| Estimated settled ADR \ Occupancy Full-year basis (365 days) |
40% | 55% | 65% | 75% | 85% |
|---|---|---|---|---|---|
| ¥6,000 | ¥0.88M | ¥1.20M | ¥1.42M | ¥1.64M | ¥1.86M |
| ¥8,000 | ¥1.17M | ¥1.61M | ¥1.90M | ¥2.19M | ¥2.48M |
| ¥10,000 | ¥1.46M | ¥2.01M | ¥2.37M | ¥2.74M | ¥3.10M |
| ¥13,000 | ¥1.90M | ¥2.61M | ¥3.08M | ¥3.56M | ¥4.03M |
| ¥16,000 | ¥2.34M | ¥3.21M | ¥3.80M | ¥4.38M | ¥4.96M |
Cells shaded blue reach annual revenue of ¥2.22M per room (equivalent to an annual GOP of ¥1M per room at a 45% GOP margin). Source: calculations by the HotelBank Editorial Team
This viability line is, however, only one line drawn at an assumed GOP margin of 45%. Because GOP margins move with property type, location and operating model, three cases are shown side by side with the assumption shifted up and down. The mid case is this article’s 45% assumption; the pessimistic and optimistic cases sit 10 points either side of it.
| Case | GOP margin | Required annual revenue per room |
Required ADR × occupancy |
ADR ¥8,000 |
ADR ¥10,000 |
ADR ¥13,000 |
ADR ¥16,000 |
|---|---|---|---|---|---|---|---|
| Pessimistic | 35% | ¥2.86M | ¥7,828 | 97.8% | 78.3% | 60.2% | 48.9% |
| Mid (this article’s assumption) | 45% | ¥2.22M | ¥6,088 | 76.1% | 60.9% | 46.8% | 38.1% |
| Optimistic | 55% | ¥1.82M | ¥4,982 | 62.3% | 49.8% | 38.3% | 31.1% |
Each cell shows the occupancy rate required to reach an annual GOP of ¥1M per room. Source: calculations by the HotelBank Editorial Team
What this shows is that a 10-point difference in GOP margin comes back as a difference of around 20 points in required occupancy. For a property at an ADR of ¥10,000, a 35% GOP margin demands 78.3% occupancy, whereas 55% needs only 49.8%. How far the cost structure can be squeezed determines viability with the same weight as the design of rate and occupancy. That is also why the choice of operating model feeds through to the income statement: it is a question of who can control how much of that cost-side variance.
Read the same table from the occupancy side and the meaning of the property-type choice comes into sharper focus. With a target of ¥1M annual GOP per room, required revenue is ¥2.22M per room per year — which reduces to a single line: ADR × occupancy = ¥6,088.
Source: calculations by the HotelBank Editorial Team. Actual points by property type use room occupancy rates from the Japan Tourism Agency’s “Overnight Travel Statistics Survey”, 2025 annual figures (final), and estimated settled ADR from MetroEngines Research (July 2026, national weighted average)
Required occupancy works out at 87.0% for an ADR of ¥7,000, 76.1% at ¥8,000, 60.9% at ¥10,000, 50.7% at ¥12,000, 43.5% at ¥14,000 and 38.1% at ¥16,000. Overlay the actual figures by property type and the following can be read off.
| Property type | Prevailing ADR | Occupancy required to hit target | Reported occupancy (Jan–Dec 2025, final) | How to read it |
|---|---|---|---|---|
| Business hotels | ¥8,400 | 72.5% | 75.3% | Actual clears the required level. Sustaining high occupancy is the precondition for viability |
| City hotels | ¥12,600 | 48.3% | 74.1% | Comfortable on rooms revenue, but the GOP margin turns on how food, beverage and banqueting are designed |
| Resort hotels | ¥16,900 | 36.0% | 56.9% | The high rate sets a low occupancy hurdle, giving resilience to seasonal swings |
| Ryokan | ¥13,300 | 45.8% | 38.2% | Because the basis measures rooms revenue only, the design of meal and experience value alongside room rates is the key |
Required occupancy is on a full-year basis (365 days), calculated assuming a 45% GOP margin and an annual GOP of ¥1M per room. Reported occupancy is Japan Tourism Agency, January–December 2025, final. Source: MetroEngines Research / Japan Tourism Agency, “Overnight Travel Statistics Survey”, compiled by the HotelBank Editorial Team
The point to watch is that this required occupancy is calculated on a limited-service premise of “rooms revenue only, 45% GOP margin”. Ryokan and resort hotels earn revenue outside the room — meals, experiences, retail — and that revenue forms an important part of their economics. The finding that ryokan’s reported occupancy of 38.2% (Japan Tourism Agency, “Overnight Travel Statistics Survey”, January–December 2025, final) falls short of the required 45.8% therefore does not invalidate the ryokan model; it shows that a P&L built on room rates alone does not fit a ryokan. A ryokan business plan has to build up per-night meal and ancillary revenue explicitly, on top of rooms revenue.
Business hotels sit at the opposite end: against a required occupancy of 72.5% (full-year basis, assuming a 45% GOP margin and ¥1M annual GOP per room), actual occupancy of 75.3% (January–December 2025, final) leaves a margin of only 2.8 points. For business hotels, the ability to sustain high occupancy is itself the condition of viability, and a few points of occupancy lost thins profit immediately. That is exactly why site selection, and the precision of revenue management that lifts rates without giving up occupancy, matter decisively in this type. It is also why labour-saving investment pencils out more readily here during a period of rising wages: GOP per room is thicker to begin with than in other property types.
Conclusion — property type and operating model are choices about which number you go after
To summarise what this article has established.
First, hotel revenue reduces to rooms × occupancy × ADR × 365 days. Multiply estimated settled ADR as of July 2026 by the Japan Tourism Agency’s final 2025 occupancy rates and annual revenue per room comes to approximately ¥3.51M for resort hotels, ¥3.40M for city hotels, ¥2.31M for business hotels and ¥1.86M for ryokan. The ADR ranking and the revenue ranking do not agree: ryokan command a rate 60% above business hotels yet fall below them on annual revenue, because of the difference in nights sold.
Second, the size of revenue and the depth of profit per room do not move together. Apply the indicative GOP margin ranges and annual GOP per room comes to ¥0.92M–1.39M for business hotels, ¥0.70M–1.40M for resort hotels, ¥0.34M–1.02M for city hotels and ¥0.09M–0.28M for ryokan. The ryokan figures look thin because a room-selling business and a food service business are compressed into a single ratio; a ryokan business plan needs to build up out-of-room revenue explicitly.
Third, the operating model is a design for allocating demand-volatility risk. Owner-operation carries both upside and downside; fixed rent does the reverse. Variable rent and management contracts are mechanisms for designing the space between, and listed hotel REIT disclosures show concrete designs — “97.5% of the amount by which adjusted GOP exceeds a threshold”, “approximately 48% of rental income is variable rent”. Management contract fees are widely cited at a base of around 2–4% of revenue plus an incentive of around 8–12% of GOP.
Fourth, assumptions about scale differ sharply by property type. Ryokan average 22.5 rooms, and of the 14,906 with registered room counts, 73.7% have 19 rooms or fewer. Business hotels average 101.4 rooms, with 33.9% at 100 rooms or more. If you start small, the rate design and cost design have to be built around the fact that properties with 0–9 employees showed reported occupancy of 35.6% nationwide (January–December 2025, full year).
Fifth, the viability line is set by a single product, ADR × occupancy. Target an annual GOP of ¥1M per room and, on a 45% GOP margin, ADR × occupancy must reach ¥6,088 — 76.1% occupancy at an ADR of ¥8,000, 60.9% at ¥10,000, 38.1% at ¥16,000. Which of the two factors you choose to go after is, in itself, the choice of property type.
There is no general answer to whether hotel management “makes money”. But the choice of property type and operating model resolves into a combination of two decisions: whether you pursue occupancy or rate, and whether you carry the risk yourself or share it with someone else. Those two are what has to be settled before opening; the numbers that follow can be drawn by substituting your own assumptions into the sensitivity tables in this article.
Related reading
- What Is RevPAR? ADR x Occupancy, and Why GOP Splits 1.81x in 2026
- What Is Hotel ADR? Settled Rates 34-57% of Listed Prices, 2026
- Hotel Water & Sewer Costs Vary 2.1x by Municipality: ¥7.85mn NOI Gap
- City Hotels: 45.9% of Guest Nights Are Foreign — Ryokan +3.7%
- 2026 Electricity Price Surge: Supply-Side Cost Impact Analysis for Hotels
- Face Recognition Check-In: Survival Strategy for Mid-Size Business Hotels
References and sources
■ Data sources
MetroEngines Research estimated settled ADR (all 47 prefectures, by property type, July 2026; sample sizes range from 119 to 7,398 properties depending on the type); MetroEngines OCC estimate (based on OTA listed inventory, as of July 2026, 21,156 properties and 1,324,155 rooms nationwide); property and room counts (based on confirmed OTA listings, 27,162 properties / 1,267,377 rooms nationwide as of 2026); Japan Tourism Agency, “Overnight Travel Statistics Survey”, 2025 annual figures (final); and published materials from listed hotel REITs and industry participants. Our own aggregated figures use values re-extracted as of 30 August 2026.
■ Calculation assumptions
Annual revenue per room = estimated settled ADR × room occupancy rate × 365 days. Rooms revenue only; food and beverage, banqueting and other departmental revenue are excluded. ADR is the estimated settled ADR (tax-exclusive equivalent), and occupancy is the Japan Tourism Agency’s room occupancy rate (calendar-day basis, with closure days included in the denominator). The GOP margin is set at 45% as the mid case, a conservative level for a limited-service property, with 35% and 55% shown as sensitivity cases. The viability line takes an annual GOP of ¥1M per room as a provisional target and works back to the required revenue.
■ Limitations and caveats
Estimated settled ADR is an estimate produced by applying property-type correction factors to each property’s lowest publicly listed plan; against property-level disclosures by listed hotel REITs (91 properties, most recent three months) the median error is approximately 7%. It differs from actual transacted prices and accounting figures. Because the MetroEngines OCC estimate and the Japan Tourism Agency’s reported occupancy rate use different populations and calculation methods, the two are not mixed in this article. The simple-lodging sample is limited to 119 properties and should be read as indicative. GOP margins are published indicative ranges by property type, not the results of individual properties. This article presents simplified calculations; an actual investment decision requires a detailed feasibility study.
■ Market data
- MetroEngines Research — estimated settled ADR (all 47 prefectures, by property type, July 2026; sample sizes range from 119 to 7,398 properties depending on the type); MetroEngines OCC estimate (based on OTA listed inventory, as of July 2026, 21,156 properties and 1,324,155 rooms nationwide); property and room counts (based on confirmed OTA listings, 27,162 properties / 1,267,377 rooms nationwide as of 2026)
■ Government statistics and public data
- Japan Tourism Agency, “Overnight Travel Statistics Survey”, January–December 2025 (Reiwa 7) annual figures (final) — Table 1 (property counts), Table 4 (guest nights), Table 8 (room occupancy rate)
- Japan Tourism Agency, Minpaku Portal Site, “About the Hotel Business Act” — definitions of licence categories and licensing authorities
- Ministry of Land, Infrastructure, Transport and Tourism, “Statistical Survey on Building Construction Starts” — hotel construction cost per tsubo by structural type
- Ministry of Health, Labour and Welfare, Central Minimum Wages Council — guideline for the fiscal 2026 revision of regional minimum wages (national weighted average ¥1,176, up ¥55 year on year)
■ REIT and industry materials
- Japan Hotel REIT Investment Corporation, IR information — variable rent formula, RevPER assumptions for the 26th and 27th fiscal periods
- Ichigo Hotel REIT Investment Corporation — share of variable rent in the rent structure, RevPER for the 21st and 22nd fiscal periods
- Invincible Investment Corporation, results presentation materials — GOP margin across 91 managed properties (38.9% for the period ended December 2024, 36.0% for the period ended June 2025)
- Relo Hotel Solutions — indicative GOP margin ranges by property type
- Explanation of management contract (MC) fee structures — levels of base fees and incentive fees