

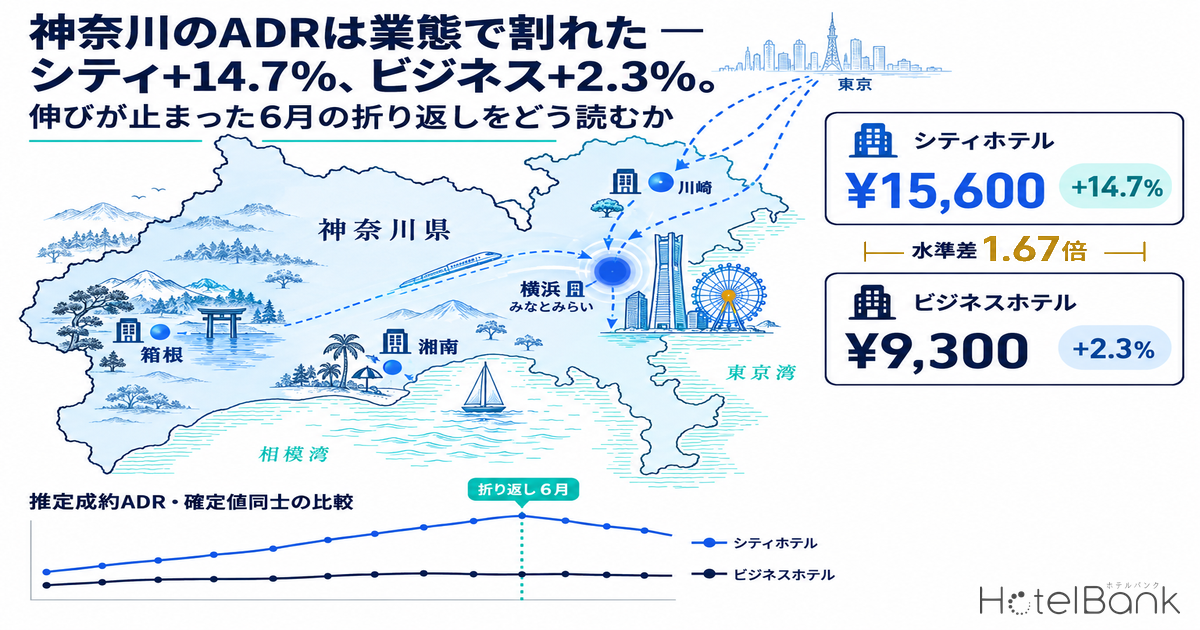
Line up Kanagawa’s settled ADR estimates using only the months for which figures are finalized, and the gap between hotel segments becomes unmistakable. The January–August 2026 average was ¥15,600 for city hotels (N=40–42 properties), up +14.7% year on year, against ¥9,300 for business hotels (N=207–213 properties), up just +2.3%. The absolute spread between the two segments widened from roughly ¥4,500 a year earlier to roughly ¥6,300. The monthly breakdown, however, adds a further layer: the double-digit growth on the city side was concentrated in January–June, then faded to +3.9% in July and −3.3% in August. The business side has been negative for three straight months since June. This article uses only finalized-month comparisons to sort out how the two segments build their pricing floor, what the first-half growth actually consisted of, and what revenue managers operating in Kanagawa can act on this week.
Scope: Kanagawa Prefecture city hotels N=40–42 properties / business hotels N=207–213 properties. Price figures in this article are settled ADR estimates (the transaction-level price level inferred from OTA and other sales data, tax-excluded equivalent); occupancy figures are estimates based on OTA-listed inventory. Both definitions appear at the end of the article. Data as of September 8, 2026.
- — The January–August 2026 settled ADR estimate averaged ¥15,569 (+14.7%) for city hotels and ¥9,310 (+2.3%) for business hotels. The ratio between the segments widened from 1.49x a year earlier to 1.67x.
- — City-side double-digit growth was concentrated in January–June (averaging about +20.6 points) and stopped at about +0.3 points in July–August. The business side has been below the prior year for three consecutive months since June. For both segments, the turning point was June.
- — Estimated OCC for June–August 2026 ran 87.6% → 89.0% for city hotels and 86.2% → 87.9% for business hotels. Peak days reached the 97% range in both segments (Saturday, July 18), with virtually no difference between them.
- — New supply relative to existing inventory is nearly identical — about 7.1% for business hotels and about 7.5% for city hotels. Differences in supply volume cannot explain the gap in ADR growth (14.7% versus 2.3%).
- — The day-of-week occupancy structure differs by segment (city hotels peak on Saturday at 93.8%, a weekend pattern; business hotels peak midweek at 88.5% Wednesday and 89.1% Thursday, with a 4.1-point gap on Sundays). The source of the difference is not the ability to fill rooms but the ceiling built into rate design.
Overlaying finalized months only — Kanagawa’s ADR traces a different curve for each segment
One premise first. Settled ADR estimates come in two kinds: months finalized against a verified historical baseline, and current or future months estimated from present sales conditions. Because the two rest on different calculation bases, pairing a finalized figure with a current-point estimate produces a year-on-year change that is structurally inflated. Every year-on-year comparison in this article is therefore built from finalized figures only — January–August 2025 against January–August 2026. Months from September 2026 onward are current-point projections on a different basis, so neither their levels nor their rates of change are discussed here. Note also that in every month of the covered period the number of properties in the sample sits near the middle of the series; no month with a thin sample that would distort the average is included.
The chart below fixes the horizontal axis to January–December and overlays 2025 and 2026. The 2026 line for city hotels sits above the prior year across nearly the whole range from the start of the year. January in particular came in at ¥15,700 (N=40) against ¥11,500 (N=40) a year earlier, up +36.3%; April reached ¥17,100 (N=42), up +19.7%; and June hit ¥15,800 (N=42), up +20.9%. The 2026 line for business hotels, by contrast, sits almost on top of the prior year’s line — the only notable upside is April at ¥10,300 (N=212, +8.4%) — and falls below the prior year from June onward.
Source: MetroEngines Research; compiled by the HotelBank Editorial Team
The figure worth holding onto is the level gap itself. The city-minus-business spread averaged about ¥4,500 over January–August 2025; over the same months of 2026 it was about ¥6,300. As a ratio, it widened from 1.49x to 1.67x. That price growth diverges this far by segment within the same prefecture and the same demand area is the starting point of this article. On when the divergence began, Kanagawa ADR Splits: City Hotels +20.9%, Business −1.7% in June 2026 follows the cross-section as of June.
| Stay month | City 2025 | City 2026 | YoY | Business 2025 | Business 2026 | YoY |
|---|---|---|---|---|---|---|
| January | ¥11,490 | ¥15,665 | +36.3% | ¥8,326 | ¥8,924 | +7.2% |
| February | ¥12,322 | ¥14,804 | +20.1% | ¥8,756 | ¥8,921 | +1.9% |
| March | ¥13,225 | ¥15,007 | +13.5% | ¥8,981 | ¥9,543 | +6.3% |
| April | ¥14,281 | ¥17,100 | +19.7% | ¥9,459 | ¥10,250 | +8.4% |
| May | ¥14,564 | ¥16,482 | +13.2% | ¥9,385 | ¥9,635 | +2.7% |
| June | ¥13,075 | ¥15,806 | +20.9% | ¥8,958 | ¥8,805 | −1.7% |
| July | ¥14,437 | ¥15,002 | +3.9% | ¥9,212 | ¥9,128 | −0.9% |
| August | ¥15,180 | ¥14,683 | −3.3% | ¥9,746 | ¥9,274 | −4.8% |
| Jan–Aug average | ¥13,572 | ¥15,569 | +14.7% | ¥9,103 | ¥9,310 | +2.3% |
Settled ADR estimate (tax-excluded equivalent). City N=40–42 properties, business N=207–213 properties. All comparisons are finalized figures against finalized figures. Source: MetroEngines Research; compiled by the HotelBank Editorial Team
First-half growth stopped in summer — the turning point was June
What gets lost when you look only at the annual average is the shape of the growth curve itself. City hotel year-on-year change peaked at +36.3% in January, then held double digits throughout January–June: +20.1% in February, +13.5% in March, +19.7% in April, +13.2% in May, +20.9% in June. It then dropped close to the waterline in two months — +3.9% in July, −3.3% in August. Growth that averaged about +20.6 points over January–June averaged about +0.3 points over July–August.
Business hotels turned even earlier. Growth that averaged about +4.1% over January–June flipped to three consecutive negative months — −1.7% in June, −0.9% in July, −4.8% in August — for a July–August average of about −2.9%. In other words, Kanagawa saw a shared turning point regardless of segment: the rate-increase phase of the first half of 2026 came to a pause in the summer, with the city side simply turning at a higher level. The same “breaking in early summer” pattern has been observed in other prefectures; the Kyoto case has been analyzed by segment in a separate article in this series.
Year-on-year change, finalized figures against finalized figures. Source: MetroEngines Research; compiled by the HotelBank Editorial Team
One caution here: do not read August’s decline as demand falling away. Estimated occupancy, discussed below, was in fact at its highest for the period in August. When a year-on-year price decline and sustained high occupancy occur together, what deserves scrutiny is not demand but the starting point of the property’s and the market’s pricing relative to the same month a year earlier.
The day-of-week occupancy structure differs — city hotels skew to weekends, business hotels to midweek
The difference in the pricing floor shows up not in price but in the shape of occupancy. Averaging estimated OCC (based on OTA-listed inventory) by day of week for June–August 2026, city hotels (N=42 properties) peak on the weekend side — Saturday 93.8%, Friday 90.5%, Sunday 87.4% — then decline in a straight line to 84.1% on Monday. Business hotels (N=198–202 properties) are similar in that Saturday is high at 92.0%, but they build a solid midweek base — Wednesday 88.5%, Thursday 89.1% — while the start of the week dips sharply, at 83.3% on Sunday and 82.5% on Monday. The Sunday gap is 4.1 points: 87.4% for city hotels against 83.3% for business hotels.
Estimated OCC (based on OTA-listed inventory). June–August 2026, Kanagawa Prefecture. Source: MetroEngines Research; compiled by the HotelBank Editorial Team
On a monthly basis, estimated OCC rose toward summer in both segments: city hotels 87.6% in June → 88.2% in July → 89.0% in August, business hotels 86.2% → 87.7% → 87.9%. The highest single day in the period was Saturday, July 18, 2026 for both segments — 97.7% for city hotels and 97.5% for business hotels. The lowest day was also shared: Monday, August 31, at 76.7% and 78.1% respectively. Peak heights barely differ by segment, yet average ADR differs by more than 1.6x. This is the practical crux, and it suggests that what the business side is leaving on the table is not the ability to fill rooms but the rate on the days that are already full.
Cross-checking against new supply and externally disclosed results
The hypothesis that “the business side isn’t growing because there is more new supply” deserves to be counted out first. Tallying accommodation properties opened in Kanagawa Prefecture (including scheduled openings) by segment: business hotels account for 4 properties and 629 rooms in 2024, 8 properties and 751 rooms in 2025, and 3 properties and 499 rooms in 2026 — 15 properties and 1,879 rooms in total. City hotels account for 1 property and 111 rooms in 2025 and 2 properties and 504 rooms in 2026 — 3 properties and 615 rooms in total.
| Segment | 2024 | 2025 | 2026 | 3-year total | vs existing inventory |
|---|---|---|---|---|---|
| Business hotels | 629 rooms | 751 rooms | 499 rooms | 1,879 rooms | approx. 7.1% |
| City hotels | 0 rooms | 111 rooms | 504 rooms | 615 rooms | approx. 7.5% |
| Resort hotels | 213 rooms | 134 rooms | 404 rooms | 751 rooms | — |
Ratio to existing inventory = three-year total new rooms ÷ total rooms covered in that segment (business 26,385 rooms / city 8,161 rooms). Source: MetroEngines Research; compiled by the HotelBank Editorial Team
In absolute terms business hotels added three times as many rooms, but as a share of existing inventory the two are nearly level — about 7.1% versus about 7.5%. The pattern of supply growth alone cannot explain why ADR growth split into 14.7% and 2.3%. It is more natural to read the source of the difference as sitting on the rate-construction side — how far the ceiling is raised on weekends and peak days — as discussed below. Because pricing is also constructed differently across Hakone, Minato Mirai, Shonan and the business districts within the prefecture, Kanagawa Hotel Market 2026: Four Tiers and a ¥15,400 Autumn ADR Gap is a useful companion for the area-level breakdown.
It is worth cross-checking the market’s direction against externally disclosed results as well. Operating results for July 2026 disclosed by listed hotel REITs (full portfolio, domestic) were: Ichigo Hotel REIT Investment Corporation (いちごホテルリート投資法人) at ADR ¥9,684, occupancy 84.4% (as of July 2026) and RevPAR ¥8,175, with ADR down −0.8% year on year; Invincible Investment Corporation (インヴィンシブル投資法人, 101 domestic hotels) at ADR ¥15,100, occupancy 86.3% (as of July 2026) and RevPAR ¥13,039, with ADR down −1.0%; and Japan Hotel REIT Investment Corporation (ジャパン・ホテル・リート投資法人, 29 hotels under variable-rent and similar schemes) at ADR ¥21,806, occupancy 83.1% (as of July 2026) and RevPAR ¥18,119, with ADR up +0.1%. In every case July ADR was broadly flat to slightly down year on year while occupancy exceeded the prior year. Kanagawa’s business hotel figure of −0.9% for July is consistent with this nationwide pattern of flat pricing and firm occupancy. Note that these are each company’s actual measured operating results, whereas the settled ADR in this article is an estimate derived from sales data. They serve different roles, and the appropriate use is to confirm direction.
For revenue managers running city and business hotels in Kanagawa — implications and an action plan
1. Split your property’s annual growth rate into “January–June” and “July–August” and look at them separately. The market wore two different faces across the halves. For the city segment, the market was up double digits year on year in January–June (averaging about +20.6 points) and roughly flat in July–August. If you track only your annual average, the second-half stall is hidden by the first-half surplus. Re-line your monthly year-on-year figures and check whether your own turning point came before or after the market’s (June). If it came later, that is evidence you pushed rates further — and grounds for next year’s pricing.
2. Compare the market ADR range against your own rate band on the same tax-excluded, settled basis. The January–August 2026 averages in Kanagawa were ¥15,600 for city hotels and ¥9,300 for business hotels. If your actual ADR is tax- and commission-inclusive it cannot be compared directly, so align the conditions before locating your position. If you are in the business segment, sitting clearly below the ¥9,300 market average while your estimated OCC fills to around the market level (the 86–88% range in June–August), there may be room left on the rate side.
3. The shape of the day-of-week peak indicates where the room to raise rates sits in each segment. The business segment shows a two-poled structure: high midweek at 88.5% on Wednesday and 89.1% on Thursday, dipping to 83.3% on Sunday and 82.5% on Monday. The city segment slopes gently toward the weekend, topping out at 93.8% on Saturday. Checking whether your high-occupancy days line up with the days you last repriced tends to surface what is being left behind.
4. Use the fact that peak heights barely differ by segment. On the highest day of the period (Saturday, July 18), city hotels reached 97.7% and business hotels 97.5% — essentially the same. If there is no difference in the ability to fill rooms as they approach sold out, the 1.6x annual ADR gap arises mainly from rate design. For the business segment, how high the ceiling price can be set on peak days is the question most worth examining.
Translating the above onto a timeline gives the following action plan. None of these guarantee a result; use them as prompts for judgment.
| Time horizon | Action | Decision trigger | Purpose |
|---|---|---|---|
| Today–this week | Line up your property’s January–August 2026 ADR by month and calculate year-on-year change | If your January–June growth fell below the bottom of the market range (city +13–36% / business +2–8%) | Take stock of how much of the first-half rate-increase phase you captured |
| Today–this week | Aggregate your last three months of occupancy by day of week and overlay it on the market’s day-of-week shape | If Sunday and Monday fall well below the market (business 83.3% / 82.5%) | Separate whether start-of-week softness is specific to your property or shared across the market |
| Within two weeks | Test the room to raise the ceiling price on Saturdays and peak days to the top of your recent settled range | If your Saturday occupancy is running above the market (city 93.8% / business 92.0%) while your rate stays flat | Recover rate left behind on near-sold-out days |
| Within two weeks | In the business segment, revisit how the price differential between midweek (Wed/Thu) and the weekend is designed | If you hold market-level occupancy of 88.5% on Wednesday and 89.1% on Thursday while weekday rates stay unchanged | Convert the ability to fill rooms into rate |
| Looking to next month | Rebuild your repricing calendar to weight the first half of the year, with the market’s turning month (June) in mind | If your rate increases have typically been concentrated from July onward | Move repricing into the period with the most headroom |
| Looking to next month | Check both segment market levels (¥15,569 / ¥9,310) against the assumptions in your annual budget | If your budget ADR diverges from the market average by more than ±10% | Ground next year’s target level in actual market conditions |
Source: MetroEngines Research; compiled by the HotelBank Editorial Team
Summary — three yardsticks for reading Kanagawa
Yardstick 1: The segment gap comes from the rate ceiling, not the ability to fill rooms. City and business hotels in Kanagawa both reach estimated OCC in the 97% range on peak days — essentially the same height. Even so, the January–August average ADR differs by 1.67x, ¥15,600 against ¥9,300. A gap occupancy cannot explain is most naturally read as a gap in how the pricing ceiling is designed.
Yardstick 2: Split growth rates into first and second half rather than using an annual average. City hotels were up +14.7% over January–August 2026, but that figure is a composite of double-digit growth in January–June (averaging about +20.6 points) and near-flat July–August (averaging about +0.3 points). Business hotels likewise turned to three consecutive negative months from June. Knowing the market’s turning month lets you measure whether your own repricing was early or late.
Yardstick 3: Build year-on-year comparisons only from finalized figures. Settled ADR estimates include both finalized months and current-point estimated months, and the two rest on different bases. Year-on-year changes that mix them are structurally inflated, so comparisons must always pair finalized figures with finalized figures. That is why this article stops at August 2026; for September onward, the safe course is to wait for month-end finalization before assessing.
About the data
■ Data sources
Settled ADR estimate: the transaction-level price (tax-excluded equivalent) inferred from OTA and other sales data (lowest-plan price level × segment coefficient, ensembled across multiple channels). Estimated OCC: occupancy based on OTA-listed inventory = 100 − 100 × rooms remaining on OTA listings ÷ total rooms. Booking observations run from 45 days before the stay date through the present. New supply and the monthly operating results of listed hotel REITs come from each company’s public disclosures. Aggregation by MetroEngines Research and the HotelBank Editorial Team.
■ Calculation assumptions and comparison rules
Settled ADR estimates comprise months finalized against a verified historical baseline and months estimated from present sales conditions. The two rest on different calculation bases, and year-on-year changes that mix them are structurally inflated, so every year-on-year figure in this article is calculated from finalized figures only (January–August 2025 against January–August 2026). September 2026 onward is on a different basis and is not covered here in either level or rate of change. The period covered for estimated OCC is June, July and August 2026. Sample sizes are N=40–42 city hotel properties / N=207–213 business hotel properties for settled ADR, and N=42 city hotel properties / N=198–202 business hotel properties for estimated OCC (varying by month). New supply comprises 3 city hotel properties with 615 rooms, 15 business hotel properties with 1,879 rooms, and 15 resort hotel properties with 751 rooms (2024–2026, including scheduled openings). Data as of September 8, 2026.
■ Limitations and caveats
Estimated OCC is an estimate based on how inventory offered on OTAs is taken up, and is defined differently from actual room occupancy (it runs higher). The settled ADR estimate has a median error of 6.6% when checked against disclosed operating results. Figures from listed hotel REITs are those companies’ actual measured operating results and are used here only to confirm direction, as an indicator with a different role from the estimates in this article. Because sales conditions and inventory change daily, the figures in this article are a snapshot as of the time of collection. This article is intended to support an understanding of market conditions and does not guarantee the outcome of any particular repricing or investment decision.
References and sources
・Ichigo Hotel REIT Investment Corporation (いちごホテルリート投資法人), “Monthly Operating Status for July 2026” https://www.ichigo-hotel.co.jp/ir/news/news_file/file/IchigoHotel_20260825_Monthly_Operating_Results_JPN.pdf
・Invincible Investment Corporation (インヴィンシブル投資法人), “Monthly Operating Status (July 2026)” https://www.invincible-inv.co.jp/news/upd/140120260825525695.pdf
・Japan Hotel REIT Investment Corporation (ジャパン・ホテル・リート投資法人), “Monthly Operating Results Data” https://www.jhrth.co.jp/file/review_exceldl-347fcee763387952f68e1b7a06e0839aaef0cd6e.xlsx