

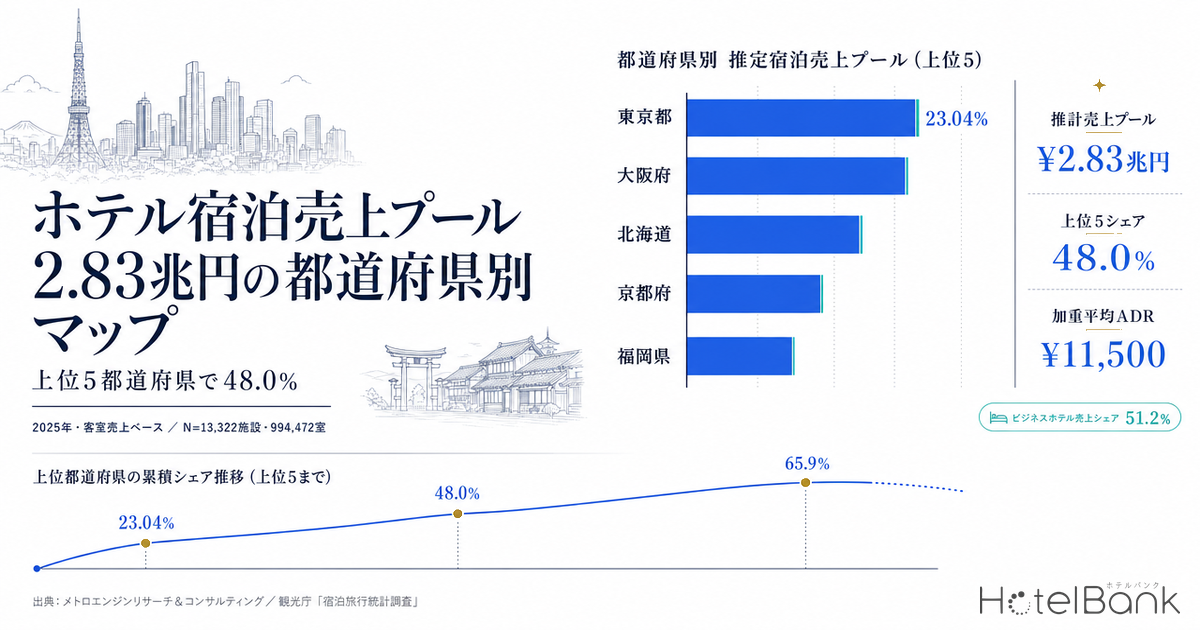
Japan’s accommodation market is surprisingly hard to answer on one basic question: where does the revenue sit, and how much of it is there? The Japan Tourism Agency publishes guest nights and occupancy by prefecture, but no rate is attached to those volumes, so they never add up to a map denominated in yen. This article multiplies the room stock tracked by MetroEngines Research & Consulting by the actual occupancy published in the Japan Tourism Agency’s Overnight Travel Statistics Survey and by estimated settled ADR, to estimate the 2025 (calendar-year) room-revenue pool by prefecture and by hotel category. The result is ¥2.8292 trillion nationwide, with the top five prefectures accounting for 48.0%.
Metric Definitions Used in This Article
- ADR (average daily rate): an estimated settled rate (tax-excluded equivalent) derived by applying a category-specific correction factor to the lowest published plan level each property lists on OTAs and similar channels (double occupancy, per-room rate, tax included). Checked against property-level actuals disclosed by listed hotel REITs, the median error is 6.6% (verified categories: business, city, resort, ryokan, capsule). It is an estimate and differs from each property’s actual transacted prices and accounting figures. Area-level ADR is calculated from the median of the properties covered and represents the standard level for that area; the prefecture-level ADR in this article is a composite of these category series weighted by room count.
- OCC (occupancy): the OCC used here is taken directly from the occupancy rates published by the Japan Tourism Agency’s Overnight Travel Statistics Survey, by prefecture and accommodation type (2025 = Reiwa 7 annual total). These are not our own estimates.
- Room-revenue pool: an estimate of annual room revenue calculated as rooms x 365 days x OCC x ADR. Food and beverage, banquet and other departmental revenue are not included.
- Annual revenue per room: room-revenue pool divided by rooms. An estimate of the room revenue one room generates in a year, equivalent to an annualised RevPAR.
- Data sources: MetroEngines Research & Consulting / Japan Tourism Agency, Overnight Travel Statistics Survey
- — ¥2.8292 trillion: the estimated 2025 room-revenue pool (13,322 properties, 994,472 rooms, four main categories). Room revenue only, excluding food, beverage and banquets, and a floor figure because it is built on OTA-distributed inventory.
- — Top five prefectures: 48.0%: Tokyo alone accounts for 23.04% (¥652.0bn), close to 2.5x second-placed Osaka (9.33%). The top 10 prefectures reach 65.9%.
- — Rank correlation 0.974: agreement with the guest-night ranking in the Japan Tourism Agency’s Overnight Travel Statistics Survey. The amounts are a floor, but the ordering across prefectures is consistent with official statistics.
- — The ranking flips on annual revenue per room: Tokyo ¥5.242mn and Kyoto ¥4.809mn, against ¥2.683mn in Hokkaido, which ranks third nationwide by room count. Markets that earn through volume and markets that earn through rate separate here.
- — 2026 run-rate: +1.8% nationwide — but Osaka at −25.2% sits alongside Okinawa at +15.8%. Read only the national average and you will misread markets moving in opposite directions.
■ Estimation Assumptions
Formula
Room-revenue pool = Σ(prefecture x category)[ rooms x 365 days x occupancy x ADR ]
Assumptions and data used
- Rooms: rooms at properties tracked by MetroEngines Research & Consulting that were confirmed on sale on OTAs over the trailing 12 months (stays from September 2025 to August 2026) and are registered as operating. The sample covers 13,322 properties and 994,472 rooms, or 92.0% of the full tracked universe (19,340 properties, 1,080,808 rooms) on a room basis.
- Category definitions: aggregated in the four categories used by the Japan Tourism Agency — ryokan, resort hotels, business hotels and city hotels. Deluxe hotels are included in city hotels. Simple lodgings (guesthouses, minshuku, pensions, rental villas and the like) and company or organisation lodging houses fall outside the verified categories for estimated settled ADR and are therefore excluded from the aggregation (the excluded portion is 86,336 rooms, 8.0% of tracked rooms, and its contribution to revenue is smaller still because occupancy in those categories is low).
- Occupancy: occupancy by prefecture and accommodation type from the Japan Tourism Agency’s Overnight Travel Statistics Survey (2025 = Reiwa 7 annual total). No in-house estimates are used.
- ADR: the day-weighted average of estimated settled ADR by prefecture and category, January to December 2025. It is not an all-plan average of listed prices. Months where the sample collapsed (below 60% of the median for that series) were excluded (affected: one month each for resort, business and city in Hyogo).
- Out of scope: food and beverage, banquet, retail and other departmental revenue, plus service charges, accommodation tax and bathing tax, are all excluded. This is strictly an estimate of room revenue.
- Base year: 2025 (calendar year). Room stock uses inventory as of the survey date, so openings and closures during 2025 are not strictly reflected.
This estimate is not the total value of Japan’s accommodation market. It is the room-revenue pool of the four main categories distributed on OTAs. As the verification section below shows, it captures only part of the country’s actual room stock, so the amounts are best read as a floor. The relative ordering across prefectures, on the other hand, agrees closely with the Japan Tourism Agency’s published results, which makes it accurate enough for screening investment areas. How much of their total rooms properties actually place on OTAs is examined in detail in our analysis of inventory allocation rates measured across 12,941 hotels.
A Quarter of the Pool Is Tokyo — Top 10 Prefectures at 65.9%
Stacked by prefecture, Tokyo accounts for ¥652.0bn, or 23.04% of the total, close to 2.5x second-placed Osaka (¥263.9bn, 9.33%). Hokkaido follows at ¥183.1bn, Kyoto at ¥134.4bn and Fukuoka at ¥124.6bn; the top five reach 48.0% cumulatively and the top 10 reach 65.9%. Seen through room revenue, Japan’s accommodation market is concentrated in a smaller number of metropolitan areas than one might expect.
That said, the size of the pool and per-room earning power are different questions. Hokkaido holds 68,251 rooms, third nationwide, but at 61.2% occupancy (January to December 2025 annual total, Japan Tourism Agency, Overnight Travel Statistics Survey) and an estimated ADR of about ¥11,000, its annual revenue per room stops at ¥2.683mn. Kyoto, with 27,946 rooms — just over 40% of Hokkaido’s stock — ranks second nationwide at ¥4.809mn per room. Markets that earn on volume and markets that earn on rate are clearly separated.
Geographic Distribution of the Revenue Pool
On a map, the structure resolves into the metropolitan belt along the Pacific coast plus two resort poles in Hokkaido and Okinawa. More than half of the pool sits on the axis connecting Tokyo, Osaka, Fukuoka and Nagoya, while inland prefectures and the Sea of Japan side fall into a range of roughly ¥20bn to ¥40bn per prefecture.
Business Hotels Take 51.2% of Revenue — Room Share vs Revenue Share
Broken down by category, business hotels account for ¥1.450 trillion, or 51.2% of the total. Their revenue share of 51.2% sits slightly below their 58.0% room share, while city hotels convert a 19.0% room share into 28.4% of revenue. The earning efficiency of urban city hotels, which run both high rates and high occupancy, shows up plainly in the numbers.
| Category | Properties | Rooms | Room share | Estimated ADR | Daily revenue per room | Revenue pool | Revenue share |
|---|---|---|---|---|---|---|---|
| Business hotels | 5,336 | 576,923 | 58.0% | ¥9,174 | ¥6,884 | ¥1.450tn | 51.2% |
| City hotels | 1,046 | 188,722 | 19.0% | ¥15,980 | ¥11,674 | ¥0.804tn | 28.4% |
| Ryokan | 5,933 | 146,143 | 14.7% | ¥14,683 | ¥5,726 | ¥0.305tn | 10.8% |
| Resort hotels | 1,007 | 82,684 | 8.3% | ¥16,226 | ¥8,948 | ¥0.270tn | 9.5% |
Ryokan come close to the largest count by property number — 5,933 properties and 146,143 rooms — but occupancy averages a structurally low 38.2% nationwide, so the revenue pool stops at ¥305.0bn and a 10.8% share. Average rooms per property is small at 24.6, and rates are high while occupancy is low: the economics of the ryokan business appear directly in the macro figures. Put the other way, it is also the category with the most headroom to lift occupancy.
Accuracy Check — Reconciliation with Japan Tourism Agency Actuals
The estimate was checked against the Japan Tourism Agency’s 2025 actuals from three angles.
Check 1: agreement of the prefecture ranking
Comparing the revenue-pool ranking here with the ranking by guest nights published by the Japan Tourism Agency (2025, 661,105,480 guest nights nationwide), Spearman’s rank correlation coefficient came to 0.974. The ordering of the money map is close to the demand map in official statistics. On shares, Tokyo has a 23.04% revenue share against a 16.32% guest-night share, a gap of +6.7pt, showing that high rates flow straight into the money share. Okinawa, by contrast, is −1.5pt and Nagano −0.9pt: room revenue is small relative to guest nights.
| Prefecture | Revenue-pool share | Guest-night share | Gap | Guests per room (implied) |
|---|---|---|---|---|
| Tokyo | 23.04% | 16.32% | +6.72pt | 2.97 |
| Osaka | 9.33% | 8.89% | +0.44pt | 2.86 |
| Hokkaido | 6.47% | 7.03% | -0.56pt | 2.79 |
| Kyoto | 4.75% | 5.02% | -0.26pt | 4.42 |
| Fukuoka | 4.40% | 3.85% | +0.55pt | 2.33 |
| Kanagawa | 3.92% | 4.05% | -0.13pt | 2.89 |
| Chiba | 3.79% | 4.27% | -0.48pt | 2.91 |
| Okinawa | 3.64% | 5.12% | -1.49pt | 4.03 |
| Shizuoka | 3.36% | 3.39% | -0.03pt | 2.61 |
| Aichi | 3.19% | 3.44% | -0.25pt | 2.18 |
Check 2: coverage rate (guests per room)
Dividing the Japan Tourism Agency’s guest nights by the room nights in this estimate (245.78mn room nights) gives 2.69 guests per room nationwide. Given how people actually stay in Japan, roughly 1.4 to 1.7 guests per room is the plausible range, so the gap means that this estimate captures only part of the national room stock. Assuming 1.55 guests per room, actual national room nights work out to about 427mn, implying a coverage rate of about 57.6% for this estimate. Dividing back by 61.6% occupancy (January to December 2025 annual total, all accommodation types) puts the national room stock at about 1.90mn rooms, roughly twice the 994k rooms we track. The guests-per-room metric itself, read across all 47 prefectures, is covered in our article on June 2026 occupancy of 56.2% and supply-demand headroom.
By prefecture, the implied value has a median of 2.34 and ranges from 1.50 (Yamaguchi) to 4.42 (Kyoto). The higher the value, the more small lodgings an area has that are not continuously sold on OTAs — small Japanese-style inns and simple lodgings, common in Kyoto and Okinawa — and the lower this estimate’s coverage there. The amounts here are not the total accommodation market of each prefecture but a floor based on OTA-distributed inventory — that is how they need to be read.
Check 3: level comparison against listed REIT disclosures
The plausibility of the rate level itself can be checked against the monthly actuals listed hotel REITs publish. Ichigo Hotel REIT Investment Corporation reported June 2026 results (24 hotels in total, excluding two of its 26 closed for renovation) of 80.6% occupancy, ADR ¥8,872 and RevPAR ¥7,147. In this estimate, the national weighted-average ADR for business hotels is about ¥9,200 and daily revenue per room about ¥6,900, close to the level of limited-service actuals. Invincible Investment Corporation’s 101 domestic hotels (June 2026) posted 82.7% occupancy, ADR ¥12,412 and RevPAR ¥10,264, above the national average here to the extent that its portfolio is concentrated in urban areas. Both indicate that the estimated ADR does not diverge materially from actuals.
Screening — Four Quadrants of Earning Power and Demand Growth
Narrowing down target areas takes two axes, not just the size of the pool: how much each room earns, and whether demand is growing. The scatter below puts annual revenue per room on the horizontal axis, the year-on-year change in guest nights (2025 vs 2024, Japan Tourism Agency actuals) on the vertical axis, and sizes each bubble by the revenue pool.
Upper right: above median on both earning power and growth
Twelve prefectures including Osaka, Hokkaido, Fukuoka, Kanagawa, Okinawa and Aichi. Absolute pool size is large as well, which makes them natural targets for core-asset acquisition — though competition and pricing are already priced in.
Upper left: growth, but earning power below median
Eleven prefectures including Miyagi, Fukushima, Kagoshima, Ibaraki, Okayama and Aomori. Demand is growing but annual revenue per room sits below the national median. Headroom on rate and value-add opportunity coexist here.
Lower right: high earnings, but flat to falling demand
Tokyo and Kyoto land here. Guest nights fell −2.2% in Tokyo and −3.1% in Kyoto, yet annual revenue per room is ¥5.242mn and ¥4.809mn, first and second nationwide. These markets have shifted to growing on rate rather than volume.
What stands out is that Tokyo and Kyoto sit in the falling-demand, high-earnings quadrant. Inbound arrivals hit a record 42,683,600 in 2025 (Japan National Tourism Organization), yet guest nights in both fell. The reading is that rates rose under supply constraints and price-sensitive demand spilled into neighbouring prefectures. The foreign share is 55.7% in Tokyo and 55.2% in Kyoto, the highest in the country, which also shows where their pricing power comes from.
2026 Run-Rate — With Osaka’s Payback, Japan Lands at +1.8%
The table below applies the actual change over January to May 2026, annualised, to the 2025 estimated pool. Occupancy uses the same-period comparison of Japan Tourism Agency figures; ADR uses the year-on-year change in the day-weighted average of estimated settled ADR for January to June. Nationwide the result is ¥2.8805 trillion, +1.8% year on year.
| Prefecture | 2025 estimate | Occupancy, Jan-May | ADR YoY | 2026 run-rate | YoY |
|---|---|---|---|---|---|
| Tokyo | 6,520 | 75.9% → 75.5% | +4.5% | 6,778 | +4.0% |
| Osaka | 2,639 | 77.5% → 69.9% | -17.1% | 1,973 | -25.2% |
| Hokkaido | 1,831 | 57.3% → 55.2% | +8.6% | 1,915 | +4.6% |
| Kyoto | 1,344 | 64.2% → 63.6% | +1.5% | 1,352 | +0.6% |
| Fukuoka | 1,246 | 72.4% → 70.3% | +12.1% | 1,356 | +8.8% |
| Kanagawa | 1,109 | 64.9% → 65.5% | +6.5% | 1,192 | +7.5% |
| Chiba | 1,072 | 64.7% → 66.4% | +6.1% | 1,166 | +8.8% |
| Okinawa | 1,029 | 58.2% → 57.2% | +17.8% | 1,191 | +15.8% |
| Shizuoka | 952 | 55.1% → 53.4% | +4.9% | 967 | +1.6% |
| Aichi | 902 | 68.1% → 63.7% | +6.1% | 896 | -0.7% |
| Hyogo | 811 | 58.9% → 56.8% | +4.8% | 819 | +1.1% |
| Nagano | 560 | 36.9% → 38.7% | +7.6% | 633 | +13.0% |
| Hiroshima | 454 | 61.9% → 62.8% | +3.4% | 476 | +5.0% |
| Miyagi | 440 | 55.1% → 56.3% | +8.9% | 489 | +11.3% |
| Mie | 373 | 55.7% → 53.6% | +2.3% | 368 | -1.5% |
The mild national figure of +1.8% is not evenly distributed. In Osaka, occupancy fell 7.6pt from 77.5% to 69.9% and estimated settled ADR came in −17.1% year on year, so the run-rate drops sharply to −25.2%. This is the payback after demand from Expo 2025 Osaka, Kansai — held from April to October 2025 — worked through, compounded by new supply added over the same period intensifying price competition (verified in our review of the Osaka Expo’s impact on hotel ADR).
At the other end, Okinawa is +15.8%, Nagano +13.0%, Fukuoka +8.8% and Chiba +8.8%: growth is concentrated in regional and secondary-city markets. It reads as the point at which the regional dispersion of inbound demand starts showing up in rates. Tokyo holds occupancy roughly flat at 75.5% while ADR rises +4.5%, for a +4.0% gain. Growth on rate rather than volume continued through the first half of 2026.
⚠ A note on the 2026 run-rate: to improve statistical accuracy, the Japan Tourism Agency changed its stratification basis from employee count to room count starting with the January 2026 survey. Occupancy comparisons against the same period of 2025 may include the effect of that revision. This scenario is also a simple exercise extrapolating the January to May change (January to June for ADR) across the full year, and does not incorporate second-half demand swings or new supply.
Sensitivity — How Far Can ¥2.83tn Move?
In a market-sizing exercise, small differences in the occupancy and rate being multiplied move the total a long way. This section treats the estimate not as a single point but shows how far the figure swings when the assumptions move, in two forms: first, a two-axis sensitivity on the 2025 total itself; second, an upside and downside range on the 2026 run-rate. Both are exercises to make the uncertainty visible, not forecasts.
Two-axis sensitivity on the 2025 estimate (occupancy x ADR)
The skeleton of the estimate is 994,472 rooms x 365 days x occupancy x ADR. Rooms and days are fixed, so only occupancy and ADR can move. The base case is 67.7% weighted occupancy (January to December 2025 annual basis) and a weighted average ADR of ¥11,511 (= 245.78mn estimated room nights, a ¥2.8292 trillion pool). The table below swings occupancy in ±2pt steps and ADR in ±5% steps from there.
| Weighted occupancy \ weighted average ADR | ¥10,360 | ¥10,936 | ¥11,511 (base) | ¥12,087 | ¥12,662 |
|---|---|---|---|---|---|
| 63.7% | 2.396 | 2.529 | 2.662 | 2.795 | 2.928 |
| 65.7% | 2.471 | 2.608 | 2.746 | 2.883 | 3.020 |
| 67.7% (base) | 2.546 | 2.688 | 2.829 | 2.971 | 3.112 |
| 69.7% | 2.621 | 2.767 | 2.913 | 3.058 | 3.204 |
| 71.7% | 2.697 | 2.847 | 2.996 | 3.146 | 3.296 |
Across a range of ±4pt on occupancy and ±10% on ADR, the total spans ¥2.396tn to ¥3.296tn, about 15% below and 16% above the base case. A 2pt difference in occupancy moves the total about 3.0%, and a 5% difference in ADR moves it 5.0%. They bite at the same order of magnitude, so tightening the precision of only one of them does not raise the confidence of the estimate overall. Using official actuals for occupancy while applying category-specific corrections on the ADR side is a design choice that follows from that symmetry.
Three scenarios for the 2026 run-rate
The run-rate conversion in the previous section (¥2.8805 trillion nationwide, +1.8% year on year) is the middle case, extrapolating the January to May 2026 change across the year. Because second-half demand swings and new supply are not included, an upside and downside range is placed alongside it.
| Scenario | Revenue pool | vs 2025 | Assumption |
|---|---|---|---|
| Downside | ¥2.7322tn | −3.4% | Osaka’s payback continues into the second half and new supply intensifies rate competition. Assumes ADR lands 3% below the middle case and occupancy 1.5pt lower. |
| Middle | ¥2.8805tn | +1.8% | The run-rate conversion from the body text as is: the January to May 2026 change (January to June for ADR) extrapolated across the year. |
| Upside | ¥3.0326tn | +7.2% | The regional dispersion of inbound demand keeps feeding into rates and second-half supply is absorbed. Assumes ADR lands 3% above the middle case and occupancy 1.5pt higher. |
A middle case of +1.8% and a range of −3.4% to +7.2% leaves the national total flat in aggregate. The total market size itself rarely decides an investment; what matters is the dispersion across prefectures seen in the previous section, with Osaka at −25.2% sitting alongside Okinawa at +15.8%. Having checked the sensitivity of the total, the useful next step is to work down to a money map at the area level.
All 47 Prefectures
| # | Prefecture | Rooms | Properties | Occupancy | Estimated ADR | Revenue pool (¥100mn) | Share | Annual revenue per room (¥10k) | Foreign share |
|---|---|---|---|---|---|---|---|---|---|
| 1 | Tokyo | 124,364 | 821 | 76.3% | ¥17,973 | 6,520 | 23.04% | 524.2 | 55.7% |
| 2 | Osaka | 69,225 | 429 | 78.6% | ¥12,859 | 2,639 | 9.33% | 381.2 | 41.7% |
| 3 | Hokkaido | 68,251 | 716 | 61.2% | ¥10,994 | 1,831 | 6.47% | 268.3 | 28.6% |
| 4 | Kyoto | 27,946 | 382 | 66.8% | ¥17,900 | 1,344 | 4.75% | 480.9 | 55.2% |
| 5 | Fukuoka | 39,740 | 330 | 72.1% | ¥11,369 | 1,246 | 4.40% | 313.5 | 33.0% |
| 6 | Kanagawa | 34,603 | 446 | 66.2% | ¥11,957 | 1,109 | 3.92% | 320.5 | 18.4% |
| 7 | Chiba | 36,099 | 301 | 64.0% | ¥11,044 | 1,072 | 3.79% | 296.9 | 15.5% |
| 8 | Okinawa | 32,575 | 327 | 60.3% | ¥12,239 | 1,029 | 3.64% | 315.8 | 27.2% |
| 9 | Shizuoka | 37,822 | 710 | 56.0% | ¥11,099 | 952 | 3.36% | 251.6 | 9.9% |
| 10 | Aichi | 39,752 | 388 | 69.2% | ¥8,634 | 902 | 3.19% | 226.9 | 21.4% |
| 11 | Hyogo | 28,006 | 465 | 61.1% | ¥11,541 | 811 | 2.87% | 289.5 | 12.1% |
| 12 | Nagano | 30,057 | 724 | 39.0% | ¥10,303 | 560 | 1.98% | 186.4 | 13.2% |
| 13 | Hiroshima | 19,308 | 220 | 64.4% | ¥8,851 | 454 | 1.60% | 234.9 | 18.2% |
| 14 | Miyagi | 21,871 | 241 | 60.2% | ¥8,516 | 440 | 1.55% | 201.0 | 9.6% |
| 15 | Mie | 16,230 | 296 | 57.6% | ¥10,168 | 373 | 1.32% | 229.9 | 4.1% |
| 16 | Tochigi | 16,554 | 291 | 55.2% | ¥9,926 | 372 | 1.31% | 224.6 | 4.3% |
| 17 | Niigata | 21,607 | 374 | 46.1% | ¥8,658 | 353 | 1.25% | 163.5 | 8.3% |
| 18 | Gunma | 16,213 | 369 | 46.8% | ¥10,409 | 351 | 1.24% | 216.7 | 4.1% |
| 19 | Kumamoto | 15,178 | 309 | 58.9% | ¥9,226 | 333 | 1.18% | 219.1 | 20.9% |
| 20 | Oita | 14,235 | 379 | 54.4% | ¥10,660 | 326 | 1.15% | 228.7 | 18.3% |
| 21 | Nagasaki | 14,601 | 201 | 56.3% | ¥9,245 | 317 | 1.12% | 216.8 | 10.0% |
| 22 | Fukushima | 20,140 | 343 | 49.2% | ¥7,637 | 301 | 1.06% | 149.5 | 3.7% |
| 23 | Gifu | 13,796 | 319 | 56.0% | ¥9,794 | 296 | 1.05% | 214.5 | 24.6% |
| 24 | Ishikawa | 13,024 | 187 | 57.1% | ¥10,158 | 291 | 1.03% | 223.6 | 22.5% |
| 25 | Yamanashi | 11,318 | 251 | 43.8% | ¥11,885 | 272 | 0.96% | 240.5 | 27.7% |
| 26 | Kagoshima | 16,317 | 250 | 51.6% | ¥7,183 | 260 | 0.92% | 159.5 | 8.4% |
| 27 | Saitama | 12,041 | 151 | 66.7% | ¥8,015 | 252 | 0.89% | 209.1 | 5.2% |
| 28 | Ibaraki | 14,466 | 243 | 54.1% | ¥7,032 | 243 | 0.86% | 168.1 | 4.3% |
| 29 | Okayama | 12,080 | 154 | 59.2% | ¥8,229 | 238 | 0.84% | 197.0 | 11.6% |
| 30 | Aomori | 12,433 | 164 | 61.1% | ¥7,964 | 234 | 0.83% | 187.9 | 10.7% |
| 31 | Iwate | 13,467 | 208 | 54.9% | ¥7,172 | 208 | 0.73% | 154.3 | 8.1% |
| 32 | Yamagata | 11,443 | 260 | 50.3% | ¥8,724 | 205 | 0.73% | 179.4 | 6.6% |
| 33 | Shiga | 8,616 | 134 | 53.2% | ¥9,769 | 200 | 0.71% | 231.6 | 6.4% |
| 34 | Yamaguchi | 11,006 | 159 | 57.0% | ¥7,600 | 189 | 0.67% | 171.6 | 4.4% |
| 35 | Kagawa | 8,907 | 116 | 58.4% | ¥8,363 | 186 | 0.66% | 208.5 | 22.9% |
| 36 | Ehime | 11,343 | 168 | 57.2% | ¥6,962 | 182 | 0.64% | 160.7 | 13.3% |
| 37 | Toyama | 9,703 | 136 | 55.5% | ¥7,364 | 163 | 0.58% | 168.3 | 9.8% |
| 38 | Wakayama | 8,559 | 189 | 48.4% | ¥9,645 | 155 | 0.55% | 181.4 | 17.7% |
| 39 | Miyazaki | 9,760 | 137 | 54.1% | ¥6,948 | 145 | 0.51% | 149.0 | 6.8% |
| 40 | Akita | 8,898 | 147 | 48.3% | ¥7,876 | 144 | 0.51% | 162.0 | 5.0% |
| 41 | Shimane | 6,488 | 139 | 54.2% | ¥9,460 | 131 | 0.46% | 202.1 | 3.3% |
| 42 | Saga | 5,991 | 117 | 52.4% | ¥9,259 | 128 | 0.45% | 213.8 | 10.7% |
| 43 | Fukui | 7,260 | 184 | 46.2% | ¥9,059 | 124 | 0.44% | 170.8 | 2.8% |
| 44 | Kochi | 6,528 | 98 | 48.6% | ¥7,588 | 114 | 0.40% | 174.0 | 5.0% |
| 45 | Tottori | 6,591 | 122 | 52.2% | ¥7,899 | 113 | 0.40% | 172.0 | 7.9% |
| 46 | Nara | 4,569 | 105 | 50.9% | ¥11,420 | 111 | 0.39% | 242.0 | 16.4% |
| 47 | Tokushima | 5,491 | 122 | 52.6% | ¥6,405 | 76 | 0.27% | 137.5 | 8.6% |
Conclusion — What the Money Map Shows
The 2025 room-revenue pool is estimated at ¥2.8292 trillion nationwide, with Tokyo alone at 23.04% and the top 10 prefectures at 65.9%. By category, business hotels hold 51.2%, while city hotels turn a 19.0% room share into 28.4% of revenue. Ryokan, despite their numbers, stop at a 10.8% revenue share, which puts lifting occupancy directly on their upside.
Reconciled against the Japan Tourism Agency’s Overnight Travel Statistics Survey, the prefecture ranking shows a high rank correlation of 0.974, while the implied guests-per-room figure shows the estimate captures just under 60% of the national room stock. The amounts are a floor and the ordering is reliable — separating those two is the precondition for using a market-size estimate in an investment decision.
Folding in first-half 2026 actuals gives +1.8% nationwide, but Osaka at −25.2% sits alongside Okinawa at +15.8%. Decide on the macro average alone and you will misread markets moving in the exact opposite direction. That is the practical value of holding a money map broken down by area.
Frequently Asked Questions
Q. Is this ¥2.83tn the market size of Japan’s accommodation industry?
No. It covers room revenue only, excluding food and beverage, banquets and other departments. Coverage is also limited to OTA-distributed inventory in the four main categories, just under 60% of the national room stock. For reference, domestic overnight travel spending by Japanese residents in the Japan Tourism Agency’s Travel and Tourism Consumption Trend Survey (2025 annual, final) was ¥21.7211 trillion, but that is total travel spend including transport, food and shopping, a different scope from the room revenue here.
Q. Why not use your own occupancy estimates?
For a full-year macro aggregation, official statistics with an established sample design are the better fit. Our own estimated occupancy has only accumulated data since March 2026, which makes it effective for near-term and forward booking curves and short-run comparisons by category, but not for a calendar-year market-size estimate.
Q. Does annual revenue per room work as a proxy for investment yield?
No. Annual revenue per room is top-line room revenue. Cash flow appears only after operating costs, payroll, utilities, OTA commissions and the like are deducted to reach GOP, and after rent and FF&E reserves are deducted on top of that. It becomes a yield discussion only when combined with acquisition price per room.
Related Reading
- Hotel Supply Pressure Ranking 2026-2027: Ozu Kumamoto Tops at 30.8%
- Osaka Expo’s Impact on Hotel ADR: REIT & OTA Data Analysis
- City Hotels: 45.9% of Guest Nights Are Foreign — Ryokan +3.7%
- Tokyo 2026: 2,055 New Rooms, 55.6% Business Hotels, ADR Turns Negative
- H1 2026 ADR YoY: 16 Prefectures Aligned, 31 Split Across 4 Categories
- June 2026 Occupancy 56.2%: Guest-Nights per Room in 47 Prefectures
- Median 39.2% of Rooms Online — Allocation Across 12,941 Hotels
- Hotel Category Mix Explains Half of City ADR: 34 Municipalities
- Japan Hotel Closures 2026: 3 Hotels, 316 Rooms Closed, 1,149 Delayed
References and Sources
■ Data sources
Room stock and estimated settled ADR are aggregated by MetroEngines Research & Consulting (13,322 properties, 994,472 rooms; by prefecture and category, day-weighted average for January to December 2025). Occupancy and guest nights are the published figures of the Japan Tourism Agency’s Overnight Travel Statistics Survey by prefecture and accommodation type (2025 = Reiwa 7 annual total); no in-house estimates are used. Monthly operating data published by Ichigo Hotel REIT Investment Corporation and Invincible Investment Corporation (June 2026) were used to verify the rate level.
■ Limitations and caveats
This estimate takes as its universe the room inventory of the four main categories confirmed on sale on OTAs, and does not cover the whole national room stock. The coverage rate back-calculated from implied guests per room is about 57.6%, so the amounts need to be read as a floor. Simple lodgings (guesthouses, minshuku, pensions, rental villas and the like) and company or organisation lodging houses are excluded because they fall outside the verified categories for estimated settled ADR. Departmental revenue from food and beverage, banquets and retail, plus service charges, accommodation tax and bathing tax, are excluded. Room stock uses inventory as of the survey date, so openings and closures during 2025 are not strictly reflected. The 2026 run-rate and the three scenarios extrapolate year-to-date rates of change across the full year as a sensitivity exercise, not a forecast. The Japan Tourism Agency also changed its stratification basis from employee count to room count starting with the January 2026 survey, so occupancy comparisons against the same period a year earlier may include that effect.
■ Market data
- MetroEngines Research & Consulting — estimated settled ADR (by prefecture and category, January to December 2025), room stock (13,322 properties, 994,472 rooms)
■ Government statistics and public data
- Japan Tourism Agency, Overnight Travel Statistics Survey trend tables (guest nights by prefecture / occupancy by accommodation type)
- Japan Tourism Agency, Travel and Tourism Consumption Trend Survey, 2025 annual (final)
- Japan National Tourism Organization (JNTO), Foreign Visitor Arrivals (December 2025 estimate)
■ REIT disclosures