

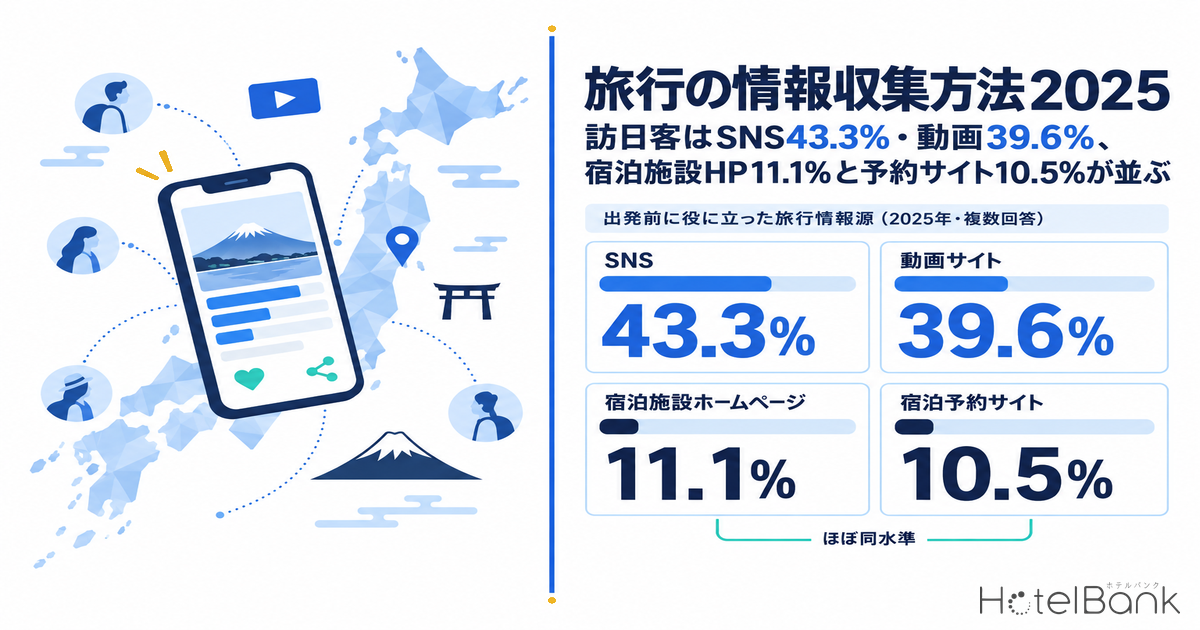
Where do travelers gather their information? For hotel operators and marketers, the answer underpins how they split advertising spend, how much priority they give their direct-booking website, and how they allocate inventory between OTAs and other channels. The Japan Tourism Agency’s 2025 annual report of the “Consumption Trend Survey for Foreigners Visiting Japan” (A1 nationwide survey, 30,005 valid responses) shows that the information sources inbound visitors found useful before departure were led by SNS at 43.3% and video sites at 39.6%, while hotel websites (11.1%) and hotel booking sites (10.5%) sat at almost the same level. This article cuts the survey’s published figures along three axes — all nationalities, 20 individual markets, and information used during the stay — checks what published data exist for domestic travelers, and turns the results into implications for how a property should design its information channels.
Metric Definitions Used in This Article
- Share (%): The multiple-answer selection rate for the questions “Travel information sources that were useful before departure” and “Travel information that was useful during the stay in Japan” in the Japan Tourism Agency’s 2025 annual report of the Consumption Trend Survey for Foreigners Visiting Japan. Figures for each nationality/region are transcribed from the report’s country/region pages (which list the top 10 items); no estimation or gap-filling was done for this article.
- Survey scope: The A1 nationwide survey of general visitors to Japan (excluding cruise passengers) in calendar year 2025. Valid responses totaled 30,005 for the year (about 7,500 per quarter). Figures are weighted values.
- Years: Every figure in this article is shown with its survey year. Japan Tourism Agency figures are for 2025, figures from the referenced article on domestic travelers are for 2024, and industry-body and company examples are dated by their announcement.
- Our data: This article focuses on public statistics and published materials; it does not use MetroEngines Research price or inventory estimates (ADR, OCC).
- — SNS 43.3%, video sites 39.6%: These were the only two information sources that roughly 40% of inbound visitors found useful before departure (Japan Tourism Agency 2025 annual report, multiple answers, N=30,005).
- — Hotel websites at 11.1% vs booking sites at 10.5%: a gap of just 0.6 points. Across all nationalities, a property’s own website is consulted with the same weight as booking sites.
- — In 12 of 20 markets SNS and video sites take the top two spots, while in the UK (41.5%) and Germany (43.3%) family and friends at home rank first — and in the UK, hotel websites rank third at 32.6%.
- — During the stay, accommodation information ranks 4th at 38.0%, after transportation (65.9%) and restaurants (56.0%), and it is in the top six in all 20 markets (2025).
- — Domestic travelers: Japan’s public statistics contain no information-source question, so domestic travelers cannot be compared with inbound visitors on the same axis. Read the figures with their years and sources kept separate.
Pre-Departure Sources — SNS 43.3%, Video 39.6%, While Hotel Websites and Booking Sites Sit Side by Side at About 11%
Start with the figures for all nationalities combined. In Figure 5-1 of the Japan Tourism Agency’s 2025 annual report, “Travel information sources that were useful before departure”, SNS (43.3%) and video sites (39.6%) are the only two sources at around 40%. They are followed by personal blogs (23.9%) in third place and family and friends in the home country (19.9%) in fourth; these are the sources at or around 20% and above. The official and booking-related sources are packed into a 10–12% band: the JNTO (Japan National Tourism Organization) website at 12.2%, travel agency websites at 11.8%, hotel websites at 11.1%, review sites at 11.0% and hotel booking sites at 10.5%. The spending side of the same survey (accommodation is the largest expense item) is covered in Lodging Is 37% of Japan’s ¥2.51T Inbound Spend: ¥10,446 vs Real ADR; this article focuses only on information sources.
Two points stand out from this ranking. First, the “discovery” stage before a trip is driven by SNS and video, with official and booking sites consulted later, at the “confirm and book” stage. Second, the gap between hotel websites (11.1%) and booking sites (10.5%) is only 0.6 points: at least as a “useful information source”, a property’s own website is viewed with the same weight as booking sites. Travel guidebooks (8.1%) and TV programs (5.0%) remain in single digits, so the role of print and broadcast media is limited.
Source: Compiled by the HotelBank Editorial Team from the Japan Tourism Agency, “Consumption Trend Survey for Foreigners Visiting Japan, 2025 Annual Report”, Figure 5-1 (all nationalities/regions, multiple answers, A1 nationwide survey, N=30,005 valid responses)
Top Sources by Nationality — 12 SNS/Video-Driven Markets vs European Markets Led by Family, Friends and Guidebooks
An all-nationality average blurs the differences between markets. The heatmap below transcribes the top nine sources for each of 20 markets from the report’s country/region pages (the “before departure” column for each market, which lists the top 10), arranged by information source.
The first thing to notice is that in the East and Southeast Asian markets other than Vietnam, SNS and video sites monopolize first and second place. These two items took the top two spots in 12 markets: South Korea (SNS 47.1%, video 43.8%), Taiwan (video 45.5%, SNS 42.7%), Hong Kong (video 48.8%, SNS 40.8%), China (SNS 49.4%, video 24.4%), Thailand (video 44.9%, SNS 44.1%), Singapore (video 49.7%, SNS 38.5%), Malaysia (SNS 43.5%, video 43.4%), Indonesia (SNS 49.1%, video 44.0%) and the Philippines (SNS 45.2%, video 38.1%), plus Italy, Canada and Australia. In South Korea, personal blogs rank third at 42.9%, making it the only market where SNS, video and blogs all exceed 40%. For China, a private-sector survey reports that more than 90% of travelers now use generative AI in addition to SNS to plan their itineraries.
The UK and Germany, by contrast, have a different structure. In the UK, family and friends at home rank first at 41.5%, and second through fifth place fall in a narrow 30–33% band: SNS at 33.2%, hotel websites at 32.6%, travel guidebooks at 31.7% and the JNTO website at 30.9%. Germany also has family and friends at home in first place (43.3%), with travel guidebooks (32.6%) fourth and hotel websites (27.6%) fifth. France (family and friends 38.3%, 2nd; guidebooks 24.9%, 4th), Spain (family and friends 38.8%, 2nd) and the US (family and friends 35.6%, 2nd) are also markets where word of mouth works about as well as video and SNS. In Russia, review sites rank second at 40.3% and booking sites fifth at 34.1% — the highest reliance on review and booking sites among the 20 markets.
| Market | SNS | Video | Blogs | Family/friends at home | Family/friends in Japan | Review sites | Guidebooks | JNTO website | Hotel websites | Booking sites | Travel agency websites |
|---|---|---|---|---|---|---|---|---|---|---|---|
| South Korea | 47.1 | 43.8 | 42.9 | 9.1 | 6.9 | 7.5 | – | – | 7.8 | 15.4 | 8.7 |
| Taiwan | 42.7 | 45.5 | 29.0 | 17.7 | 10.0 | – | – | 17.1 | 11.2 | – | 16.1 |
| Hong Kong | 40.8 | 48.8 | 15.4 | 12.8 | – | – | – | 16.2 | 11.2 | 10.2 | 9.3 |
| China | 49.4 | 24.4 | 14.8 | 15.0 | 12.5 | – | – | 7.9 | 7.3 | – | 9.8 |
| Thailand | 44.1 | 44.9 | 13.8 | 17.8 | 12.1 | 11.0 | – | 17.4 | – | 12.7 | 14.4 |
| Singapore | 38.5 | 49.7 | 14.1 | 30.0 | – | 20.3 | 8.8 | 14.3 | 16.1 | – | – |
| Malaysia | 43.5 | 43.4 | 13.4 | 21.6 | 11.9 | 12.8 | – | 12.4 | – | – | 15.1 |
| Indonesia | 49.1 | 44.0 | – | 30.4 | 23.1 | – | 12.5 | 15.7 | 15.5 | – | 15.6 |
| Philippines | 45.2 | 38.1 | 18.0 | 27.0 | 23.8 | 11.9 | – | 10.0 | 10.4 | – | 9.6 |
| Vietnam | 29.2 | 21.3 | – | 24.2 | 24.9 | – | 9.7 | 12.4 | 9.1 | – | 18.3 |
| India | 24.1 | 30.1 | – | 26.9 | 24.7 | – | 16.7 | 18.4 | 15.1 | – | 17.2 |
| UK | 33.2 | 29.7 | – | 41.5 | 24.5 | 26.8 | 31.7 | 30.9 | 32.6 | – | – |
| Germany | 36.4 | 36.2 | – | 43.3 | – | 23.3 | 32.6 | 27.1 | 27.6 | 21.1 | – |
| France | 41.6 | 36.9 | – | 38.3 | 24.4 | 23.3 | 24.9 | 24.8 | 19.8 | – | – |
| Italy | 43.9 | 45.5 | 21.8 | 28.0 | 17.4 | 24.0 | 29.8 | 26.9 | 16.0 | – | – |
| Spain | 38.1 | 46.4 | 27.0 | 38.8 | – | – | 26.5 | 29.3 | 24.1 | – | 25.1 |
| Russia | 32.2 | 47.8 | 37.0 | 37.5 | – | 40.3 | – | 25.5 | – | 34.1 | 22.9 |
| US | 35.4 | 43.0 | – | 35.6 | 21.6 | 18.6 | 14.7 | 16.5 | 16.1 | – | – |
| Canada | 40.6 | 45.4 | 19.8 | 32.6 | 21.0 | 19.8 | – | 12.6 | 9.8 | – | – |
| Australia | 38.4 | 43.9 | 17.3 | 36.0 | 15.6 | 22.9 | – | 14.7 | 19.6 | – | 15.1 |
Figures are each nationality/region’s share (%) for “Travel information sources that were useful before departure” (multiple answers, 2025). Bold marks each market’s top three. “–” means the item was not among that market’s top nine; it does not mean zero (the report’s country/region pages list the top 10; the 10th item is not covered in this article).
Source: Compiled by the HotelBank Editorial Team from the Japan Tourism Agency, “Consumption Trend Survey for Foreigners Visiting Japan, 2025 Annual Report”, country/region pages (“Before departure”)
Classifying each market by its single top source, video sites rank first in 11 of the 20 markets, SNS in 7, and family and friends at home in 2 (the UK and Germany). The next chart shows each market’s top source and its share. China’s SNS (49.4%) and Singapore’s video sites (49.7%) are the highest, while in Vietnam (SNS 29.2%) and India (video 30.1%) even the top source reaches only about 30%, indicating that information sources are more dispersed.
Source: Compiled by the HotelBank Editorial Team from the Japan Tourism Agency, “Consumption Trend Survey for Foreigners Visiting Japan, 2025 Annual Report”, country/region pages (each market’s top information source and its share, multiple answers)
Information Useful During the Stay — Accommodation Ranks 4th at 38.0%, and in the Top Six in All 20 Markets
Separately from pre-departure sources, the report also tabulates “Travel information that was useful during the stay in Japan” (Figure 5-2). In 2025, transportation was the most common answer at 65.9%, followed by restaurants (56.0%), tourist attractions (39.1%), accommodation (38.0%) and shopping places (33.8%). Infrastructure-type information such as free Wi-Fi (15.3%), ATMs (9.2%) and stores that accept credit cards (7.9%) stayed in the 10–20% range or below.
That accommodation information ranks fourth even during the stay is something properties should not overlook. Although most travelers have presumably chosen their hotel before departure, 38.0% still said accommodation information was “useful” while in Japan. This indicates that travelers already in Japan go back to property information when arranging the next hotel on a multi-stop trip, sharing details with travel companions, or re-checking access and facilities. By nationality/region, the share exceeded 40% in Taiwan (47.9%, 3rd), Malaysia (47.0%, 4th), China (45.1%, 3rd), Hong Kong (43.6%, 4th), Thailand (43.2%, 4th), Spain (42.2%, 5th) and Australia (40.9%, 4th), and accommodation ranked in the top six in all 20 markets.
Source: Compiled by the HotelBank Editorial Team from the Japan Tourism Agency, “Consumption Trend Survey for Foreigners Visiting Japan, 2025 Annual Report”, Figure 5-2 (all nationalities/regions, multiple answers, A1 nationwide survey, N=30,005 valid responses)
| Market | Rank of “Accommodation” | Share | No.1 item | No.1 share |
|---|---|---|---|---|
| South Korea | 3rd | 31.9% | Restaurants | 56.5% |
| Taiwan | 3rd | 47.9% | Transportation | 66.3% |
| Hong Kong | 4th | 43.6% | Transportation | 66.6% |
| China | 3rd | 45.1% | Transportation | 68.0% |
| Thailand | 4th | 43.2% | Transportation | 67.1% |
| Singapore | 4th | 36.6% | Transportation | 72.1% |
| Malaysia | 4th | 47.0% | Transportation | 71.7% |
| Indonesia | 5th | 36.6% | Transportation | 76.1% |
| Philippines | 4th | 37.6% | Transportation | 68.9% |
| Vietnam | 5th | 19.4% | Transportation | 52.7% |
| India | 5th | 24.1% | Transportation | 66.0% |
| UK | 5th | 31.5% | Transportation | 79.5% |
| Germany | 5th | 28.6% | Transportation | 78.2% |
| France | 6th | 27.6% | Transportation | 80.8% |
| Italy | 5th | 30.3% | Transportation | 77.2% |
| Spain | 5th | 42.2% | Transportation | 84.0% |
| Russia | 6th | 38.2% | Transportation | 87.6% |
| US | 5th | 25.7% | Transportation | 74.1% |
| Canada | 5th | 30.1% | Transportation | 71.5% |
| Australia | 4th | 40.9% | Transportation | 74.7% |
Rank and share of “Accommodation” within “Travel information that was useful during the stay in Japan” (multiple answers, 2025). It ranks in the top six in all 20 markets.
Source: Compiled by the HotelBank Editorial Team from the Japan Tourism Agency, “Consumption Trend Survey for Foreigners Visiting Japan, 2025 Annual Report”, country/region pages (“After departure”)
Unlike pre-departure sources, information during the stay is asked about by “content” rather than by “medium” such as SNS or video. Even so, the fact that transportation and restaurants always occupy first and second place shows a property what to prioritize on its own website and social accounts. If travelers in Japan are looking for routes from the nearest station and for nearby restaurants in addition to the appeal of the property itself, placing that information on the property’s own channels is the shortest way to reach the 38.0% who refer to accommodation information during their stay.
How Domestic Travelers Gather Information — No Information-Source Question in Public Statistics, Only What Private Surveys Publish
Can the same cross-cut be done for Japanese residents traveling domestically? In short, within the published materials we could confirm at the time of writing, public statistics contain no “share by information source” directly comparable to the inbound Figure 5-1. The Japan Tourism Agency’s “Travel and Tourism Consumption Trend Survey” measures the number of trips, nights and spending, and has no question on information sources. The “Domestic Overnight Travel Survey 2026” published on July 16, 2026 by Recruit Co., Ltd.’s research institute (15,548 valid responses, covering domestic overnight trips in fiscal 2025) also focuses its published results on travel participation rates, number of trips, spending and destination ratings, with no tabulation of information sources. For the Japan Travel Bureau Foundation’s “Annual Report on Travel 2025”, we could not confirm any published information-source figures on the web, so it is not cited here.
What is available on the domestic side are private surveys. A 2024 survey by iRidge, covered by HotelBank in September 2024, asked about 200 men and women in their 20s, 40s and 60s about domestic travel and found that “web search” was the main way to gather information when planning a trip across a wide range of ages, with women in their 20s standing out for their use of SNS (Instagram, followed by YouTube and TikTok). However, this is a small-sample survey from 2024 and cannot be compared on equal terms with the 2025 tabulation of 30,005 inbound visitors. For reference, the “Traveler Value Index 2025” published in May 2025 by a major overseas OTA group (11 markets including Japan, more than 11,000 respondents) states that 61% of people use SNS for travel inspiration, up from 35% in its 2022 survey. This is not a Japan-only figure but a figure for 11 global markets based on the company’s own survey design.
Since there are no public figures that speak definitively about domestic travelers’ information sources, properties need to keep two separate observations — “for inbound visitors, SNS and video each reach about 40%” and “for domestic travelers, it varies by age group” — side by side, with their years and sources kept apart. That is why this article does not put domestic figures on the same charts as the inbound data.
Implications for Properties — How to Use the Fact That Hotel Websites (11.1%) and Booking Sites (10.5%) Are Level
This is the core of the article. The 2025 finding that hotel websites (11.1%) and hotel booking sites (10.5%) are almost level has two implications for properties designing their direct and OTA channels.
Direct-booking websites already reach the level of “useful”
If inbound visitors are as likely to call a property’s own website “useful” before departure as they are a booking site, there is ample reason to invest in the property’s own site. HotelBank’s August 2026 estimate, OTA Commission ¥877–2,193 per Night: The Direct-Booking Break-Even, showed that applying commission rates to the national estimated settled ADR gives a range of ¥877–2,193 per night. That amount can fund making the property’s website multilingual and building pathways from SNS. That said, as laid out in Inventory Allocation First: 4 Routes to Cut OTA Fees, ¥95,200/Room, there are things to check before raising the direct-booking share, and the design of information channels cannot be separated from inventory allocation.
The weight of “hotel website” vs “booking site” flips by market
The two items that are level across all nationalities swap weight when you look market by market. In South Korea, booking sites are at 15.4% (4th), about twice hotel websites at 7.8% (7th), and Russia also shows a high share for booking sites at 34.1% (5th). In the UK, by contrast, hotel websites rank third at 32.6%, while booking sites do not make the top nine. Germany (hotel websites 27.6%, 5th), Spain (24.1%, 8th), France (19.8%, 8th), Australia (19.6%, 5th) and the US (16.1%, 7th) are also markets where hotel websites rank high. The more a property targets travelers from Europe, North America and Australia, the more likely its English-language pages and its pathways from SNS are to become a direct booking channel; the more it targets East Asian travelers, the more the entry point becomes rich information on booking sites plus discovery via SNS, video and blogs.
| Market | Hotel websites | Booking sites | Travel agency websites |
|---|---|---|---|
| South Korea | 7.8% (7th) | 15.4% (4th) | 8.7% (6th) |
| Taiwan | 11.2% (7th) | Not in top 9 | 16.1% (6th) |
| Hong Kong | 11.2% (6th) | 10.2% (7th) | 9.3% (8th) |
| China | 7.3% (9th) | Not in top 9 | 9.8% (7th) |
| Thailand | Not in top 9 | 12.7% (7th) | 14.4% (5th) |
| Singapore | 16.1% (5th) | Not in top 9 | Not in top 9 |
| US | 16.1% (7th) | Not in top 9 | Not in top 9 |
| Australia | 19.6% (5th) | Not in top 9 | 15.1% (8th) |
| UK | 32.6% (3rd) | Not in top 9 | Not in top 9 |
| Germany | 27.6% (5th) | 21.1% (9th) | Not in top 9 |
The three items related to a property’s booking channels within “Travel information sources that were useful before departure” (multiple answers, 2025). “Not in top 9” means the item’s share was not among the top nine for that market; it does not mean zero.
Source: Compiled by the HotelBank Editorial Team from the Japan Tourism Agency, “Consumption Trend Survey for Foreigners Visiting Japan, 2025 Annual Report”, country/region pages
Which prefectures are seeing growth in demand from Europe, North America and Australia is covered in Western Guest Nights H1 2026: Nagasaki +65%, ADR Up in Hokkaido/Miyagi, and progress toward the 2026 inbound visitor forecast can be tracked in Japan Inbound 2026: 41.4-43.1M Forecast. Information-channel design only becomes meaningful when it is combined with knowing which markets’ travelers are actually coming to your area.
What makes a property discoverable on SNS and video — four published examples
The figures of SNS at 43.3% and video sites at 39.6% are a starting point for thinking about what a property needs to be on the “discoverable” side. Below are four materials and examples published in 2025–2026, with sources. All reflect what each organization announced; their effects have not been verified for this article.
| Organization / date | What was published | What a property can take from it |
|---|---|---|
| Japan National Tourism Organization (JNTO) July 2026 | Released the 9th edition of its “Guidelines for Using Instagram for Effective Promotion”. Recommends the Explore tab and Reels to reach beyond followers, notes that “saves” signal strong interest, and covers location tags and account tagging, use of UGC (user-generated content) and — as of 2026 — crediting creators and posting via “Collab” posts. | Add location and account tags to official posts and design “discovery” pathways that reach beyond followers. A reference standard for crediting rules when using UGC. |
| Japan Hotel Association February 3, 2025 | Launched an official Instagram account for inbound travelers, posting and updating short videos of 228 member hotels and nearby attractions to match seasons and themes. | A way to gain video exposure through an industry body’s joint account when an individual property lacks the capacity for filming and multilingual content. |
| Real Co., Ltd. (Kyoto, Rinn) October 29, 2025 | The official Instagram account of the company, which operates 73 buildings with 403 rooms in Kyoto City (as of October 2025, including planned openings), passed 10,000 followers. To celebrate, from November 1 to 30, 2025 it offered guests a one-day city transit pass for following the account and posting a Story. | A structure that gives guests a reason to post during their stay (a perk they can use in the city) and turns guests’ posts into “discovery” for the next travelers. |
| TikTok Japan May 13, 2026 | Announced the Japan rollout of “TikTok GO”, which lets users jump from a location tag in a video to a booking page for accommodation or experiences (operating since 2025). As of April 2026, it had partnered with domestic and overseas booking companies, starting with six firms, and listed more than 70,000 accommodation and experience services. According to the company, bookings in Japan over the latest six months rose 270% versus the prior period, and the number of creators using the feature grew by more than 130% from six months earlier. The company says users abroad include those in Thailand, Indonesia, the US and Malaysia. | The 39.6% who use video sites are starting to complete the journey “from discovery to booking” inside the app. Check whether your inventory is listed with the partner booking companies and whether videos can carry a location tag for your property. Growth rates are company-reported; absolute numbers are not disclosed. |
Source: Compiled by the HotelBank Editorial Team from each published material (see References and Sources)
What the four examples have in common is that the emphasis is less on how much a property posts itself and more on creating a state where “the property appears in other people’s posts and can be traced through location and account tags.” Travelers in the SNS 43.3% and video 39.6% groups are not searching for a property’s official account; they are watching videos of places they want to visit. Whether there is a path from those videos to the property — location tags, account tags, listings with booking companies — separates properties that get found from those that do not. HotelBank’s empirical analysis of the cost-effectiveness of micro-influencers by follower size on TikTok and Instagram is also a useful reference for designing these pathways. In markets where review sites carry more weight (11.0% for all nationalities, 40.3% in Russia, 22.9% in Australia, 20.3% in Singapore), building up review volume is another entry point. That review volume is driven by factors other than years in operation is covered in Review Volume Doesn’t Grow With Age: 1,643 Hotels, ADR, Sell-Through.
Do First-Time and Repeat Visitors Use Different Sources? — Reading Two of the Report’s Tables Side by Side
Since there is steady search interest in how repeat travelers gather information, the relationship between number of visits and information sources is worth addressing. However, the 2025 annual report contains no table that cross-tabulates information sources by number of visits. What this article can say is limited to reading the report’s Figure 1-5 “Number of visits” and the country/region information-source rankings separately.
According to Figure 1-5, “first visit” was the most common answer among 2025 inbound visitors (all purposes) at 35.1%, and the ratio of first-timers to repeaters varies widely by market: first-time visitors exceed 80% in Spain, while in Hong Kong about 40% are on their “10th visit or more”. Setting this beside the information-source rankings reveals a correspondence: in European markets with a high first-visit share (Spain, the UK, Germany, France), family and friends at home and travel guidebooks rank high, while in Hong Kong, South Korea and Taiwan, with high repeat shares, SNS, video and personal blogs dominate. This is, however, a reading of two tables side by side, not a result that separates first-timers and repeaters within the same respondents. Discussing information sources by number of visits would require the individual-level tabulations published by the Japan Tourism Agency or another survey that uses number of visits as a cross-tabulation axis.
Summary
Read along the information-source axis, the Japan Tourism Agency’s 2025 annual report of the Consumption Trend Survey for Foreigners Visiting Japan (30,005 valid responses) shows that inbound visitors’ pre-departure information gathering is driven by SNS (43.3%) and video sites (39.6%), while hotel websites (11.1%) and hotel booking sites (10.5%) are consulted with the same weight. Split into 20 markets, SNS and video monopolize the top two spots in 12 markets — nine in East and Southeast Asia plus Italy, Canada and Australia — while in the UK and Germany family and friends at home rank first, with hotel websites and guidebooks also near the top. During the stay, accommodation information is referred to by 38.0%, after transportation (65.9%) and restaurants (56.0%), and ranks in the top six in all 20 markets.
The implications for properties can be summarized in three points. First, a property’s own website already reaches the level of being called “useful” by inbound visitors, which justifies redirecting money that would go to OTA commissions toward building direct channels. Second, because the weight of hotel websites versus booking sites flips depending on the target market, properties should strengthen their own websites and SNS pathways for Europe, North America and Australia, and information on booking sites plus discovery via SNS, video and blogs for East Asia. Third, what makes a property discoverable on SNS and video is not how much it posts itself but having pathways from other people’s posts to the property (location tags, account tags, listings with booking companies). For domestic travelers, because public statistics have no information-source question, this article limits itself to referencing private surveys, with years and sources kept separate.
Frequently Asked Questions
Q. Where do inbound visitors to Japan gather information before their trip?
In the Japan Tourism Agency’s 2025 annual report of the Consumption Trend Survey for Foreigners Visiting Japan (A1 nationwide survey, 30,005 valid responses), the information sources found useful before departure were, in order, SNS (43.3%), video sites (39.6%), personal blogs (23.9%) and family and friends in the home country (19.9%). Hotel websites were at 11.1% and hotel booking sites at 10.5%, almost the same level.
Q. Do information sources differ by country?
Yes. In the 2025 country/region tabulations, SNS and video sites take first and second place in South Korea, Taiwan, Hong Kong, China and the Southeast Asian markets other than Vietnam, while in the UK and Germany “family and friends in the home country” rank first, with travel guidebooks and hotel websites near the top. In Russia, review sites rank second (40.3%).
Q. How can a hotel get discovered on SNS and video?
The 9th edition of the “Guidelines for Using Instagram for Effective Promotion” released by the Japan National Tourism Organization (JNTO) in July 2026 lists as key points the Explore tab and Reels that reach beyond followers, saving behavior, location tags and account tagging, and Collab posts with creators (UGC). This article also introduces published examples from the Japan Hotel Association, a Kyoto accommodation operator and a short-video platform.
Related Articles
Further Reading
References and Sources
- Japan Tourism Agency, “Consumption Trends of Foreign Visitors to Japan: Results and Analysis of the Consumption Trend Survey for Foreigners Visiting Japan, 2025 Annual Report” (Japanese) — Figures 5-1, 5-2 and 1-5, country/region pages (A1 nationwide survey, 30,005 valid responses)
- Japan National Tourism Organization (JNTO), “Guidelines for Using Instagram for Effective Promotion”, 9th edition (July 2026, Japanese)
- Japan Hotel Association, “Japan Hotel Association Launches Official Instagram for Inbound Travelers” (February 3, 2025, Japanese)
- Real Co., Ltd., “[Rinn] Campaign Celebrating 10,000 Instagram Followers” (October 29, 2025, published on Zaikei Shimbun, Japanese)
- TikTok Japan Newsroom, Japan rollout of “TikTok GO” (May 13, 2026)
- TRAVEL VOICE, “Consumer survey of 11 global markets: influence of SNS on travel planning expands” (Traveler Value Index 2025, May 27, 2025, Japanese)
- Recruit Co., Ltd. research institute, “Domestic Overnight Travel Survey 2026” (July 16, 2026, 15,548 valid responses, Japanese) — used to confirm that no information-source figures are published
- Japan Tourism Agency, “Travel and Tourism Consumption Trend Survey” — used to confirm that the survey has no information-source question
- HotelBank, “How Domestic Travelers Gather Information and Book: App Use Among Younger Travelers” (September 2024, iRidge survey, Japanese)