

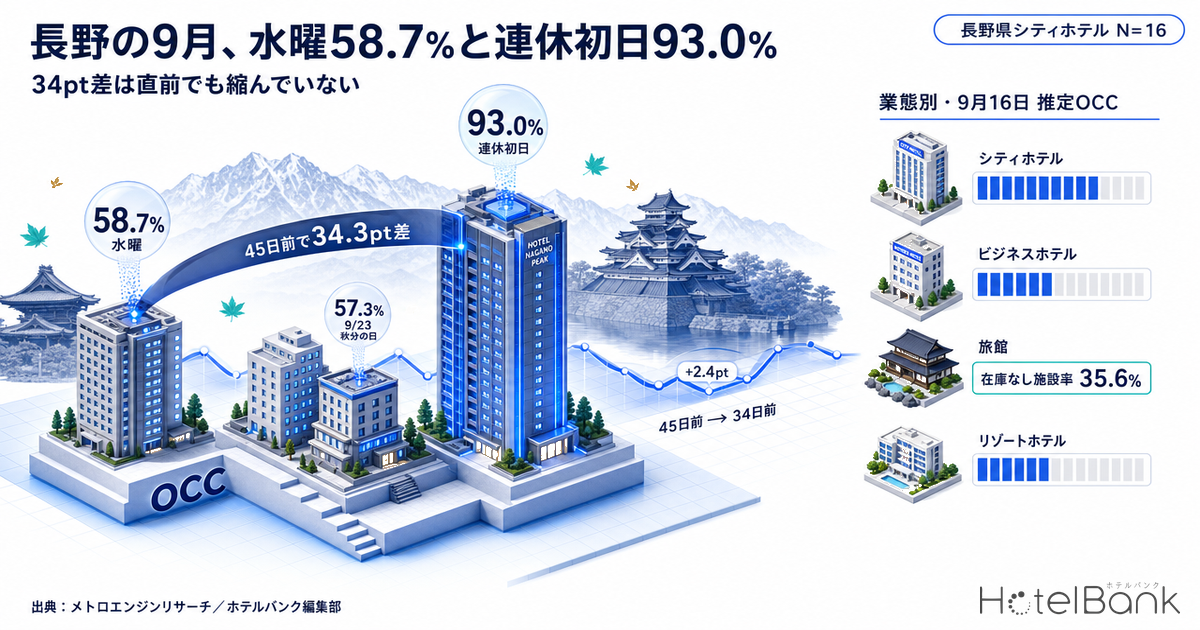
At city hotels in Nagano Prefecture (N=16 properties), estimated OCC for Wednesday, September 16, 2026 stood at 58.7% as of 45 days before the stay date. At that same 45-day cross-section, Saturday, September 19 — the first day of the long holiday — was at 93.0%. The gap: 34.3pt. The problem is that at the most recent common cross-section, 34 days out, after 11 more days of bookings had accumulated, the figures were 61.1% and 95.8% — meaning the gap had widened to 34.7pt. Far from filling in, the trough has not moved at all.
Line up all five Wednesdays in September at that same 45-day cross-section and city hotels were pinned to a narrow band of 49.1%–59.3% (average 56.1%). Even September 23 (Wed), a national holiday (Autumnal Equinox Day), came in at 57.3% — indistinguishable from an ordinary Wednesday. What is visible in mid-September in Nagano is not “a one-day trough on September 16” but “a band covering every non-Saturday in September.”
Scope: Nagano Prefecture, city hotels N=16 properties / business hotels N=145–148 / ryokan N=434–454 / resort hotels N=102–105. The price metric in this article is estimated settled ADR (the transaction price level estimated from OTA and other sales data, tax-excluded equivalent); occupancy is an estimate based on OTA-listed inventory. Both definitions appear at the end of the article. Data as of: August 17, 2026.
- — At Nagano city hotels (N=16 properties), estimated OCC for Wednesday, September 16, 2026 was 58.7% at the 45-day cross-section, versus 93.0% for Saturday, September 19. A gap of 34.3pt.
- — Eleven days later, at the 34-day cross-section, the figures were 61.1% versus 95.8% — the gap widened to 34.7pt. The trough has not narrowed even at close range.
- — The five Wednesdays in September sit in a narrow 49.1–59.3% band at the 45-day cross-section. The trough is not “the single date of September 16” but “the band of non-Saturdays in September.”
- — September 19–23 is a five-day holiday run, but only the first two days clear 90%. The final day, September 23 (Autumnal Equinox Day), sits at 57.3% — below an ordinary Wednesday.
- — Ryokan show estimated OCC of 67.7% (September 16, 2026, 45-day cross-section) against a no-listed-inventory property rate of 35.6% (averaging 22.6 rooms per property). The prefecture-average OCC is not a valid proxy for your own property.
Booking curves for three dates — only Wednesday is nearly flat
Start with the three dates at the heart of the theme, plotted as booking curves for Nagano city hotels (N=16 properties, 1,535 rooms in total). The horizontal axis is days remaining until the stay date, running from 45 days out to the most recent observation.
Source: Compiled by MetroEngines Research and the HotelBank Editorial Team
The three lines have distinctly different characters. September 19 (Sat) had already reached 93.0% at 45 days out, then hugged the ceiling on its way to 95.8%. September 12 (Sat) climbed steadily from 76.8% to 82.9% (at 27 days remaining), a pace of +4.0pt over 11 days. September 16 (Wed), however, moved only from 58.7% to 62.2% (at 31 days remaining) — a gain of just +2.4pt over the common window from 45 days out to 34 days out.
This slow pickup holds across every property type. Over the 11 days from 45 to 34 days out, estimated OCC for September 16 gained +2.4pt at city hotels, +2.8pt at business hotels, +2.0pt at ryokan and +2.1pt at resort hotels. For September 19 the same figures were +2.8pt, +4.0pt, +4.4pt and +3.4pt. The first day of the holiday run, already at a high level, is still filling faster. Not one of the four property types shows any movement in the direction of a narrowing gap. For how far late-summer inventory in the same prefecture was absorbed, Nagano’s late-summer booking curve for 2026 tracks the same 45-day fixed point.
| Property type (N) | Stay date | 45 days out | 34 days out | Latest observation | Pickup, 45 → 34 days out | No listed inventory (latest) |
|---|---|---|---|---|---|---|
| City hotels (N=16) | Sep 12 (Sat) | 76.8% | 80.8% | 82.9% (27 days out) | +4.0pt | 18.8% |
| Sep 16 (Wed) | 58.7% | 61.1% | 62.2% (31 days out) | +2.4pt | 0.0% | |
| Sep 19 (Sat, first day of the holiday run) | 93.0% | 95.8% | 95.8% (34 days out) | +2.8pt | 43.8% | |
| Business hotels (N=147–148) | Sep 12 (Sat) | 80.5% | 83.4% | 85.9% (27 days out) | +2.9pt | 26.4% |
| Sep 16 (Wed) | 69.9% | 72.7% | 73.4% (31 days out) | +2.8pt | 6.8% | |
| Sep 19 (Sat, first day of the holiday run) | 89.0% | 93.0% | 93.0% (34 days out) | +4.0pt | 66.0% | |
| Ryokan (N=450–453) | Sep 12 (Sat) | 69.8% | 73.9% | 76.6% (27 days out) | +4.1pt | 29.6% |
| Sep 16 (Wed) | 67.7% | 69.7% | 70.6% (31 days out) | +2.0pt | 36.4% | |
| Sep 19 (Sat, first day of the holiday run) | 78.2% | 82.6% | 82.6% (34 days out) | +4.4pt | 45.0% | |
| Resort hotels (N=104–105) | Sep 12 (Sat) | 79.4% | 80.8% | 82.4% (27 days out) | +1.4pt | 17.1% |
| Sep 16 (Wed) | 74.3% | 76.4% | 76.8% (31 days out) | +2.1pt | 21.2% | |
| Sep 19 (Sat, first day of the holiday run) | 80.7% | 84.1% | 84.1% (34 days out) | +3.4pt | 24.0% |
Source: Compiled by MetroEngines Research and the HotelBank Editorial Team. “No listed inventory” is the estimated share of properties for which no listed inventory can be confirmed on OTAs or similar channels.
What stands out in Table 1 is that the share of city hotels with no listed inventory for September 16 is 0.0%. All 16 properties still have sellable inventory. Rooms remaining that day total 580 out of 1,535. This is not a case of “some properties sold out and the rest going unchosen” — every city hotel in the prefecture has availability, uniformly across the board.
The September 19–23 holiday run — demand lands on only the first two days
One premise needs correcting first. In 2026, September 21 (Mon) is Respect for the Aged Day, September 22 (Tue) is a Citizens’ Holiday, and September 23 (Wed) is Autumnal Equinox Day, which makes September 19 (Sat) through September 23 (Wed) a five-day holiday run (based on the list of national holidays published by the Cabinet Office in “Concerning National Holidays”). Not a three-day weekend.
So are all five days strong? Lined up at the common 45-day cross-section, the answer is a clear no.
Source: Compiled by MetroEngines Research and the HotelBank Editorial Team
City hotels hold a high level for just two days — 93.0% on the 19th and 93.2% on the 20th — then fall away sharply: 80.3% on the 21st, 65.7% on the 22nd, 57.3% on the 23rd. The decline from the 19th to the 23rd is 35.7pt, or 35.9pt measured from the peak on the 20th. The 57.3% on September 23 (Wed, Autumnal Equinox Day), the final day of the run, is below the 58.7% recorded for the ordinary Wednesday of September 16. Being a national holiday is doing almost nothing for demand. This pattern — the back half of a holiday run settling at ordinary-weekday levels — is not unique to Nagano; booking progress for the back two days of Silver Week 2026 shows the same tendency at a 47-day fixed point.
The same shape holds for the other property types. Business hotels go from 92.2% on the 20th to 70.7% on the 23rd (−21.5pt), ryokan from 87.6% to 65.3% (−22.3pt), and resort hotels from 90.5% to 74.0% (−16.5pt). Across all four types, holiday demand concentrates in the first half (the 19th to the 21st), and the last two days revert to weekday levels. Even with a day off to follow, lodging demand has not moved away from the “Saturday and Sunday” shape.
Measured by the share of properties with no listed inventory, that concentration looks even more extreme. On September 20 (Sun), 50.0% of city hotels, 59.9% of business hotels, 54.3% of ryokan and 46.2% of resort hotels already had no confirmable listed inventory as of 45 days out. For September 23, the same figures were 0.0%, 6.8%, 27.2% and 19.4%. Within a single holiday run, inventory tightness differs by an order of magnitude.
The trough is not September 16 but “non-Saturdays in September” — re-sorted by day of week
Viewed in isolation, September 16 looks like an anomaly. Average all the Wednesdays, Sundays and Saturdays in September at the same 45-day cross-section, however, and the picture changes.
| Property type (N) | Wed, 5-day avg | Sun, 3-day avg | Sat, 4-day avg | Sat − Wed |
|---|---|---|---|---|
| City hotels (N=16) | 56.1% | 59.6% | 82.1% | +26.0pt |
| Business hotels (N=145–148) | 71.3% | 74.1% | 85.0% | +13.7pt |
| Ryokan (N=434–453) | 67.8% | 64.9% | 72.6% | +4.8pt |
| Resort hotels (N=102–105) | 74.3% | 76.3% | 78.9% | +4.6pt |
Wednesdays = Sep 2, 9, 16, 23, 30; Sundays = Sep 6, 13, 27; Saturdays = Sep 5, 12, 19, 26. Source: Compiled by MetroEngines Research and the HotelBank Editorial Team
The five Wednesdays for city hotels read 49.1%, 56.2%, 58.7%, 57.3% and 59.3%. The three Sundays read 59.5%, 57.2% and 62.0%. At the 45-day cross-section, these two days of the week sit in almost the same band. The 58.7% on September 16 is not especially low within that band. Rather, the trough exists on more than a dozen days across the month, and September 16 is merely a representative example.
The ranking of trough depth by property type is equally clear. The Saturday-minus-Wednesday gap is +26.0pt at city hotels, +13.7pt at business hotels, +4.8pt at ryokan and +4.6pt at resort hotels. The more a property type depends on weekday business demand to support urban occupancy, the wider its swing becomes on mid-September weekdays. Ryokan and resorts run at similar levels on weekdays and Saturdays alike; structurally, their intra-week peaks and troughs are small to begin with. For how differently those intra-week peaks and troughs show up by property type, day-of-week occupancy at Saitama business hotels makes the same comparison at an identical lead-time cross-section.
Does this reading — that September weekdays are weak — hold up against actuals from months already elapsed? Averaging Nagano’s daily actuals for June–July 2026 by day of week (using only days with observation coverage of 80% or higher, and excluding the three-day Marine Day weekend in July) gives the following.
Source: Compiled by MetroEngines Research and the HotelBank Editorial Team
In the elapsed-month actuals (the final level reached after bookings accumulate right up to the stay date), Wednesday at city hotels comes in at 86.2% — above Monday’s 80.5% and Tuesday’s 84.2%, placing it mid-pack within the week. The lowest day is Sunday at 73.4%. Business hotels likewise show Wednesday at 92.3%, with the trough on Sunday at 81.5%. Wednesday is not, in itself, a structurally weak day of the week. Note that the elapsed-month figures are levels after accumulation right up to the stay date, while the September figures are a mid-progress cross-section 45 days out; the levels themselves are not directly comparable. What can be compared is the intra-week ranking and the size of the gaps.
On that basis, returning to September: the 26.0pt Saturday-minus-Wednesday spread for city hotels at 45 days out is large even against the 8.2pt spread in the June–July actuals (94.4% versus 86.2%). The mid-September trough is better read as the product of demand concentrating into the holiday run combined with weak weekday business demand, rather than as a property of the day of the week itself. And on the holiday side, there is little inventory left to work with.
Ryokan: 67.7% occupancy with 35.6% of properties out of inventory — the small properties are the full ones
Ryokan are the type that most needs unpacking. At the 45-day cross-section for September 16, estimated OCC is 67.7% — higher than city hotels at 58.7%. Yet at the same point, 35.6% of properties have no confirmable listed inventory. At the most recent reading (31 days out), the same combination persists: estimated OCC of 70.6% (September 16, 2026, 31-day cross-section) against a no-listed-inventory property rate of 36.4%.
That combination points to a skewed distribution of inventory. Nagano has N=450 ryokan with 10,155 rooms in total — an average of 22.6 rooms per property. City hotels average 95.9 rooms, business hotels 91.3 and resort hotels 68.2. Ryokan alone are numerous and individually small.
At the latest cross-section for September 16, rooms remaining across the prefecture’s ryokan total 2,981 (29.4% of all rooms). Meanwhile, roughly 36% of properties have no listed inventory left. In other words, those roughly 3,000 remaining rooms are concentrated at the properties that still have inventory. Small properties fill first, and vacancy piles up at the larger ones. The prefecture-average estimated OCC of 70.6% (September 16, 2026, 31-day cross-section) is nothing more than the average of those two states.
By comparison, city hotels show a no-listed-inventory rate of 0.0% and 580 rooms remaining (37.8% of all rooms), spread near-evenly across the 16 properties. The same “roughly 30% vacant” means something entirely different for ryokan than for city hotels. If your ryokan is on the side that still holds inventory, using the prefecture-average OCC as a proxy for your own position is risky.
A yardstick for price — monthly estimated settled ADR in Nagano
This article focuses on diagnosis along the occupancy axis and does not address daily price levels. Still, as a yardstick for thinking about actions, here is the monthly price band. The figures below are estimated settled ADR (tax-excluded equivalent) for Nagano Prefecture, with the month as the base unit.
| Property type | Sep 2025 (final) | Sep 2026 (current estimate) | Jul 2025 (final) | Jul 2026 (final) | Jul YoY (final vs final) |
|---|---|---|---|---|---|
| City hotels | ¥11,081 N=16 | ¥13,463 N=16 | ¥10,794 N=16 | ¥10,564 N=16 | −2.1% |
| Business hotels | ¥7,724 N=162 | ¥11,932 N=158 | ¥7,644 N=162 | ¥8,072 N=167 | +5.6% |
| Ryokan | ¥12,384 N=501 | ¥14,326 N=491 | ¥12,455 N=519 | ¥12,105 N=517 | −2.8% |
| Resort hotels | ¥15,400 N=114 | ¥18,132 N=115 | ¥16,171 N=115 | ¥15,772 N=119 | −2.5% |
September 2026 is an estimate based on current sales conditions and may shift by month-end. A simple comparison against final figures should wait for the month-end close. Source: Compiled by MetroEngines Research and the HotelBank Editorial Team
The most recent YoY comparison between two final months is July: −2.1% for city hotels, −2.8% for ryokan and −2.5% for resorts, against +5.6% for business hotels alone. Final figures for September 2025 were roughly ¥11,100 for city hotels, ¥7,700 for business hotels, ¥12,400 for ryokan and ¥15,400 for resorts. The current estimates for September 2026 all sit above those levels, but they are mid-progress estimates derived from inventory still on sale and are not the kind of figure that can be set beside final numbers to discuss increases or decreases. Best used simply as a yardstick for checking where your own September pricing sits within the range.
For revenue managers running hotels and ryokan in Nagano — implications and an action plan
1. Not “fill September 16” but “treat September’s non-Saturdays as a bundle”
At the 45-day cross-section, the five Wednesdays for city hotels run 49.1–59.3% and the three Sundays 57.2–62.0% — essentially the same band. Measures aimed at a single date have too small a base for their effect to be legible. Treating September’s weekdays and Sundays as a single inventory pool and applying the same conditions across the whole set fits the shape of the market better.
2. Think of the holiday run as “the first three days,” not “five days”
September 19–23 is a five-day run, but only the 19th and 20th were above 90% for city hotels at 45 days out. From there it falls: 80.3% on the 21st, 65.7% on the 22nd, 57.3% on the 23rd. If you have set aggressive pricing across all five days on the strength of the calendar’s holiday count, there is room to move the last two days closer to how you treat a September weekday. September 23 in particular shows a 0.0% no-listed-inventory rate for city hotels, with availability still widespread across the prefecture.
3. Ryokan should not use the prefecture-average OCC as a proxy for their own property
For September 16, ryokan show estimated OCC of 67.7% (September 16, 2026, 45-day cross-section) against a no-listed-inventory rate of 35.6%. Given a size profile averaging 22.6 rooms per property, inventory is disappearing from the smaller properties first. If your property is on the larger side by room count, it is safer to assume you may be sitting below the prefecture average. Conversely, a small property can plan the sale of its remaining allotment on the assumption that it is running ahead of the average.
4. Compare the “speed” of pickup against your own curve
Over the 11 days from 45 to 34 days out, September 16 gained only +2.0 to +2.8pt across all four property types. Over the same window, September 19 gained +2.8 to +4.4pt. The fact that the market side has barely moved on the trough day means that if your own bookings for that date have stalled, it is not necessarily a problem specific to your property. What matters is less the absolute level than the relative question: how does your own 11-day pickup compare with the market’s range?
With that in mind, here are actions organized by time horizon. As of August 17, 2026, September 12 is 26 days away, September 16 is 30 days away and September 19 is 33 days away.
| Time horizon | Action | Decision trigger | Objective |
|---|---|---|---|
| Today to this week | Take stock of September’s Wednesdays and Sundays (Sep 16, 23, 27, 30 and others) as a single inventory group and review minimum-length-of-stay settings | If your booking pace for that set of dates is below the market’s 56.1% (city) / 71.3% (business) / 67.8% (ryokan) / 74.3% (resort) — the day-of-week averages at the 45-day cross-section | Check whether consecutive-night conditions are turning away single-night demand, and widen the entrance to the trough |
| Today to this week | Consider shifting September 22 and 23 from holiday treatment toward September-weekday treatment | If your Sep 22 and Sep 23 remain on the same terms as Sep 19 and Sep 20, while the market for those dates sits at just 65.7% and 57.3% (city hotels, 45-day cross-section) | Recover what is being left on the table in the back half of the run, in line with actual demand |
| Within two weeks | Concentrate weekday-only added value (in-stay experiences, meals, late check-out and similar items with low inventory cost for your property) on the trough date group | If your September pricing is pinned to the lower end of the monthly ranges in Table 3 (city approx. ¥11,100–¥13,500, business approx. ¥7,700–¥11,900, ryokan approx. ¥12,400–¥14,300, resort approx. ¥15,400–¥18,100) | Add a reason to be chosen on trough days without cutting price |
| Within two weeks | Share weekday corporate and group allotments with the sales side and review whether any business can be shifted onto September’s Wednesdays and Sundays | If, at a business hotel, your weekday OCC is below the market’s 71.3% while Saturdays are reaching around 85.0% (i.e. you are skewed toward a weekend profile) | Compress the +13.7pt Saturday-minus-Wednesday swing seen at the type average within your own property |
| Within two weeks | For ryokan, check where your room count sits relative to the prefecture’s size distribution (averaging 22.6 rooms per property) before deciding how to sell the remaining allotment | If your property is well above the 22.6-room average and your remaining September weekday allotment is not moving even with the prefecture’s no-listed-inventory rate at 35.6% | Revisit your exposure settings within a market where the smaller properties fill first |
| Looking to next month | Establish a routine of recording three fixed points — 45 days out, 34 days out and immediately prior — weekly for your own property, and read October’s trough days ahead using the same framework | If your own pickup from 45 to 34 days out is tracking below the +2.0 to +2.8pt observed in the market on trough days | Detect anomalies by speed rather than level, and bring decisions forward |
Source: Compiled by MetroEngines Research and the HotelBank Editorial Team
Summary — three yardsticks to take away
Yardstick 1: Count the trough as a band, not a date. All five Wednesdays in September sit at 49.1–59.3% for Nagano city hotels at the 45-day cross-section, and the three Sundays at 57.2–62.0%. Treat a single day as an anomaly and you miss the dozen-plus days of identically behaving inventory across the month. Averaging by day of week at an identical lead time reveals the true base you need to address.
Yardstick 2: The number of holidays and the number of days of demand do not match. September 19–23 is a five-day run, but only the first two days cleared 90% at city hotels, and the final day — September 23 (Wed, Autumnal Equinox Day) — came in at 57.3%, below an ordinary Wednesday. Judge by the day-by-day progress cross-section, not by the calendar’s holiday count.
Yardstick 3: Always read average OCC and the no-listed-inventory rate as a pair. For September 16, ryokan show estimated OCC of 67.7% (September 16, 2026, 45-day cross-section) against a no-listed-inventory rate of 35.6%; city hotels show 58.7% against 0.0%. Even when the numbers look similar, whether inventory is spread across all properties or concentrated in a few completely changes the right move. Deciding which side you are on comes first, and it is the starting point for choosing what to do.
About the data
- Definition of estimated OCC: OTA-listed-inventory-based occupancy = 100 − 100 × rooms remaining on OTA listings ÷ total rooms. This is an estimate based on how inventory sold through OTAs is being absorbed, and its definition differs from actual room occupancy (it reads higher). This article labels it “estimated OCC (OTA-listed inventory basis).” Coverage is Nagano Prefecture, for September 2026 (day-of-week actuals only: June–July 2026).
- Booking curves: Based on observations from 45 days before the stay date up to the most recent reading.
- Share of properties with no listed inventory: The estimated share of properties for which no listed inventory can be confirmed on OTAs or similar channels.
- Definition of estimated settled ADR: The transaction price level (tax-excluded equivalent) estimated from OTA and other sales data (lowest-plan level × property-type coefficient, ensembled across multiple channels). Past months are final figures; the current and future months are estimates based on current sales conditions. Median error against published operating results is 6.6%.
- Breakdown of N: Booking curves = Nagano city hotels N=16 properties (1,535 rooms in total) / business hotels N=145–148 (13,360–13,508 rooms) / ryokan N=434–454 (9,809–10,220 rooms) / resort hotels N=102–105 (6,975–7,119 rooms). The number of observed properties varies by stay date, so N is given as a range. Monthly estimated settled ADR = city hotels N=16 / business hotels N=158–167 / ryokan N=491–519 / resort hotels N=114–119 (varying by month).
- Aggregation conditions for day-of-week actuals: Among daily actuals for June and July 2026, only days with observation coverage of 80% or higher were included, the three-day holiday weekend of July 18–20, 2026 was excluded, and the remainder was averaged by day of week. Days included in the aggregation: 53 for city hotels, 51 for business hotels, 51 for ryokan and 55 for resort hotels.
- National holidays: September 21, 2026 (Respect for the Aged Day), September 22 (Citizens’ Holiday) and September 23 (Autumnal Equinox Day) are based on the list of national holidays published by the Cabinet Office.
- Data as of: August 17, 2026. Sales conditions and inventory change daily, so the figures in this article are a snapshot at the time of retrieval.
References and sources
■ Data sources
Daily observation of OTA-listed inventory and listed prices within Nagano Prefecture (compiled by MetroEngines Research). Booking curves cover city hotels N=16 properties / business hotels N=145–148 / ryokan N=434–454 / resort hotels N=102–105, tracked from 45 days before the stay date to the most recent observation. Day-of-week actuals use daily actuals for June–July 2026 (days with observation coverage of 80% or higher). Holiday classification is based on the Cabinet Office’s “Concerning National Holidays.” Data as of August 17, 2026.
■ Calculation assumptions
Estimated OCC = 100 − 100 × rooms remaining on OTA listings ÷ total rooms. All comparisons are aligned to identical lead-time cross-sections (45 days out, 34 days out, most recent observation), matching different stay dates at the same number of days out. Day-of-week averages are simple averages of the 45-day cross-section for each stay date (five Wednesdays, three Sundays, four Saturdays). The three-day holiday weekend of July 18–20, 2026 is excluded from the day-of-week actuals. Estimated settled ADR uses the month as its base unit; past months are final figures, while the current and future months are estimates based on current sales conditions.
■ Limitations and caveats
Estimated OCC is an estimate based on how inventory sold through OTAs is being absorbed; its definition differs from actual room occupancy and it reads higher. The number of observed properties varies by stay date, so N is given as a range. The 45-day cross-section (mid-progress) and elapsed-month actuals (the final level after accumulation) cannot be compared on level; only the intra-week ranking and the size of the gaps are comparable. Estimated settled ADR for September 2026 is derived from inventory still on sale, and a simple comparison against final figures should wait for the month-end close. Sales conditions and inventory change daily, so the figures in this article are a snapshot at the time of retrieval.
Related reading
- Nagano Late-Summer Booking Curve 2026: Ryokan -11.8pt at 45 Days Out
- Silver Week 2026 Back Half at T-47: Sep 23 Matches a Normal Wednesday
- Saitama Business Hotels: Sat 77.2% vs Sun 70.1%, Gap Widens to 11pt
- Kumamoto Day-of-Week Occupancy Inverts by Type: Thu 88.3% vs Sat 89.9%
- Tokyo Early Sep: Booking Curves at T-45/T-30/T-14, OCC 76.0-81.5%
- Gunma Ryokan vs Resorts: +3.2pt and +5.5pt Gains from 45 Days Out
- Hokkaido City Hotels: Only Aug 15 Trails at 78.7% OCC, 45 Days Out
- Hyogo Booking Curves: 3.6x Pickup Gap, Ryokan Sellout Rate 28.4%