

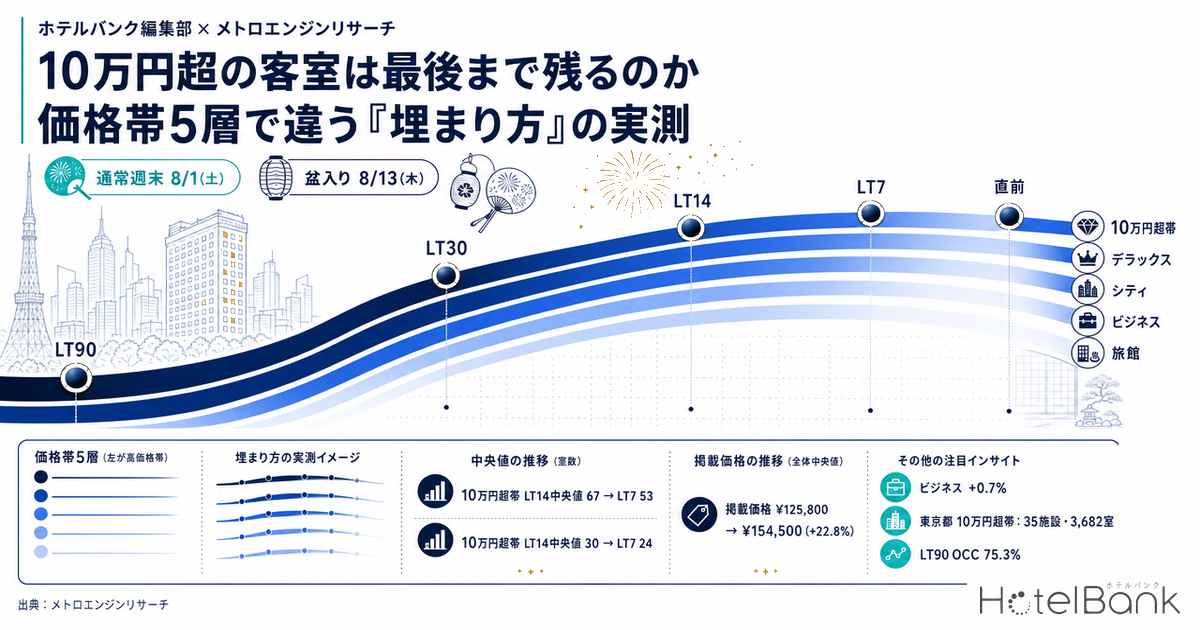
“Are rooms priced above ¥100,000 the ones that sell last?” This question comes up again and again on the ground at properties handling the high-price tier. Because the rate is high, the pool of demand is small, and plenty of operators feel that this inventory sits unsold until the very end. At the same time, others say the opposite — that on peak dates it is precisely the high-price tier that disappears first. In this article we track daily inventory depletion for five categories, split by price band and property type, across five areas — Tokyo, Osaka, Kyoto, Hokkaido and Okinawa — from 90 days before check-in right up to the day itself, and compare with measured figures exactly when each category fills.
Metric Definitions Used in This Article
- LT (lead time): days remaining until the check-in date. LT90 = 90 days out, LT0 = the day itself. In every chart and table in this article, 90 days out is on the left and the last-minute window is on the right.
- OCC (occupancy): the share of sold rooms against total rooms in the area (an estimate based on inventory published for sale on OTAs). It is an estimate derived from the depletion of inventory offered on OTAs, and differs from a property’s actual overall occupancy.
- Per-property remaining-room index: remaining rooms on each observation day divided by the number of properties observed that day, giving remaining rooms per property, then indexed with LT90 set to 100. Because the number of observed properties varies by day, the figure is normalised by property count rather than using a simple sum of remaining rooms. The lower the value, the further inventory has been sold down.
- ¥100k+ band: properties whose listed price for the date in question (average across all plans, tax included, per-room rate for two people in one room) sits at ¥100,000 or more per night. Note that this band is defined on listed price rather than estimated settled ADR, so the properties it contains change from date to date.
- Listed price: the average across all plans of the selling prices published on OTAs and similar channels (per-room rate for two people in one room, tax included). Because it rests on a different basis from estimated settled ADR, this article consistently uses the term “listed price”.
- Data source: MetroEngines Research
- — All 50 series were already above 50% OCC at LT90 (90 days out). How early filling begins lies outside the observation window, so comparison is made with a remaining-room index that sets LT90 to 100.
- — On an ordinary Saturday (August 1, 2026) the ¥100k+ band is the last to clear. Its five-area median remaining-room index is 67 at LT14 and 53 at LT7 — the latest of the five categories.
- — At the start of Obon (August 13) the order reverses. The ¥100k+ band clears fastest at 30 on LT14 and 24 on LT7, while Deluxe at 52 and City at 51 remain into the closing stretch.
- — The side that keeps inventory and the side that moves price are not the same. In Tokyo on August 1 the ¥100k+ band lifted its listed price by 22.8% while still holding inventory; Business was flat at +0.7%.
- — October 10, 2026 is a mid-course reading taken at LT61. Tokyo’s ¥100k+ band saw remaining rooms rise from 1,513 to 1,603, so with the possibility that more allocation is being opened up, no sell-out judgement can be made at this stage.
Every category was already above 50% OCC at 90 days out
The original design was to use “the lead time at which OCC (occupancy) reaches 50%” as a single number expressing how early each category begins to fill. In practice, that metric did not work. Checking 50 series in total — five areas by five categories — for the two dates of Saturday August 1 and Thursday August 13, 2026 (the start of Obon), all 50 series were already above 50% OCC at LT90 (90 days out). The lowest series was Okinawa’s ryokan at 54.8% (August 1) and the highest was Osaka’s Deluxe at 87.6% (same date). In other words, the LT at which OCC reaches 50% sits outside the observation window and is of no use as a tool for measuring differences between categories.
That result is itself instructive. Inventory published on OTAs already has more than half of total rooms in a “sold or unpublished” state 90 days out. The higher the price tier, the higher this starting value tends to be: in Tokyo on August 1 the ¥100k+ band stood at 75.3%, Deluxe at 80.3% and City at 75.4%, against Business at 63.4%, the lowest of the group. Behind this lies not only real demand being absorbed but also differences in how allotment to OTAs is designed. Our analysis measuring what share of total rooms is placed on OTAs across 12,941 properties likewise confirms that the ratio of published allocation varies widely from property to property.
This article therefore compares using a relative metric — “taking inventory at LT90 as 100, what percentage remains from there” — rather than the absolute level of OCC. This isolates depletion speed within the 90-day window without being swayed by how high or low the starting point sits. To avoid the problem of a shifting number of observed properties feeding directly into the total remaining-room count, we also used a per-property figure obtained by dividing remaining rooms by the number of properties observed.
On an ordinary Saturday, the ¥100k+ band is the last one left
Saturday August 1, 2026 is an ordinary pre-Obon weekend. The chart below tracks the per-property remaining-room index from LT90 to LT2 for Tokyo’s five categories.
Source: MetroEngines Research; compiled by the HotelBank Editorial Team
Business (871 properties, 126,478 rooms) and City (100 properties, 32,712 rooms) decline steadily from around LT60 onward, falling to 35 and 36 respectively by LT14. The ¥100k+ band (35 properties, 3,682 rooms), by contrast, is still at 62 at LT21 and 46 at LT14 — plainly weighted toward the back. Our own category-level work on Tokyo has likewise shown that the lead time at which late bookings accumulate differs substantially by property type. Lining the areas up on their median makes the gap sharper still.
Source: MetroEngines Research; compiled by the HotelBank Editorial Team
| Category | 8/1 LT30 | 8/1 LT14 | 8/1 LT7 | 8/13 LT30 | 8/13 LT14 | 8/13 LT7 |
|---|---|---|---|---|---|---|
| ¥100k+ band | 76 | 67 | 53 | 60 | 30 | 24 |
| Deluxe | 68 | 50 | 42 | 68 | 52 | 52 |
| City | 61 | 41 | 38 | 64 | 51 | 44 |
| Business | 58 | 39 | 34 | 64 | 46 | 39 |
| Ryokan | 63 | 52 | 48 | 55 | 34 | 28 |
Source: MetroEngines Research; compiled by the HotelBank Editorial Team
Looking at the August 1 columns, the LT14 median is 39 for Business, 41 for City, 50 for Deluxe and 52 for Ryokan, against 67 for the ¥100k+ band. At LT7 the ¥100k+ band is still at 53, holding more inventory than any other category. To the question posed at the outset — do rooms above ¥100,000 remain until the end — the answer on an ordinary weekend is yes. With one week to go, counting from 90 days out, the ¥100k+ band is still carrying half of its original inventory.
It would be premature, however, to read this as “not selling”. Looking at the gradient from two weeks out to the last minute, the ¥100k+ band moves from 70 at LT21 to 53 at LT7, and in Tokyo falls further to 24 at the final observation (LT2). Only the timing of the movement differs; the final depletion rate itself is not far off the other categories. OCC for Tokyo’s ¥100k+ band rises from 75.3% at LT86 to 93.9% at the final observation, landing on a par with City (94.5%) and Business (91.5%).
At the start of Obon the order flips — the ¥100k+ band clears fastest
Applying the same analysis to Thursday August 13, 2026 (the start of Obon) reverses the result.
Source: MetroEngines Research; compiled by the HotelBank Editorial Team
As the right half of Table 1 shows, the LT14 median is smallest for the ¥100k+ band at 30, followed by Ryokan at 34. Deluxe at 52, City at 51 and Business at 46, meanwhile, stay at higher levels than they did on the ordinary weekend (8/1). The gap widens further at LT7: 24 for the ¥100k+ band and 28 for Ryokan against 52 for Deluxe, 44 for City and 39 for Business.
The direction is consistent across areas as well. The LT14 figure for the ¥100k+ band on August 13 is 24 in Hokkaido (45 properties, 1,173 rooms), 29 in Okinawa (118 properties, 8,057 rooms), 31 in Kyoto (36 properties, 1,038 rooms) and 42 in Tokyo (23 properties, 2,604 rooms). The pull-forward is especially strong in the resort-heavy areas of Hokkaido and Okinawa. Ryokan behave similarly — Tokyo 30, Hokkaido 34, Kyoto 40 — moving earlier across the board from August 1 (Tokyo 33, Hokkaido 52, Kyoto 60). How Obon demand emerges splits further by date and area: in our analysis tracking Kyoto’s three Obon days by property type, it is in fact ryokan that add the most close in.
In short, the property that “the high-price tier is left until last” is not fixed — it swaps around with the demand structure of the date. At the start of Obon, when family and group trips and returns to hometowns are concentrated, securing a room that is available on that specific date takes priority over price, and high-rate rooms and ryokan alike get locked in early. On an ordinary weekend, by contrast, price-sensitive guests keep comparing options until the last minute, which pushes the high-price tier’s movement toward the back.
The side that keeps inventory and the side that moves price do not match
Overlaying the path of listed prices makes the operational implication clear. The chart below shows, for Tokyo’s five categories on August 1, an index of listed price with LT90 set to 100.
Source: MetroEngines Research; compiled by the HotelBank Editorial Team
The listed price of the ¥100k+ band rises 22.8%, from ¥125,800 (LT86) to ¥154,500 at the final observation. City also turns up toward the last minute, from ¥40,600 to ¥49,200 (+21.2%), as does Deluxe, from ¥70,600 to ¥83,000 (+17.6%). Business, in contrast, tracked almost flat at ¥25,100 to ¥25,300 (+0.7%). The picture is one in which price barely moves for Business, where inventory clears earliest, while price rises by two tenths for the ¥100k+ band, where inventory lasts longest.
At the start of Obon this too swaps around. Business in Tokyo on August 13 moved its listed price from ¥18,200 to ¥15,800, a fall of 12.8%. The ¥100k+ band on that same date barely changed, from ¥129,700 to ¥130,400 (+0.5%). Two different ways of selling are thus observed side by side: on dates with thick demand the high-price tier clears its inventory without moving price, while on dates with relatively thin demand it raises price while carrying inventory.
Disclosing the population — scale differs greatly between categories
In the comparisons here, property and room counts differ between categories by close to two orders of magnitude. In Tokyo, Business accounts for 871 properties and 126,478 rooms, whereas the ¥100k+ band comes to 35 properties and 3,682 rooms and Ryokan to 46 properties and 1,058 rooms. The daily number of observed properties (obs) also tends to increase as LT gets smaller, in line with expanding collection coverage. The full population and headline metrics for every series are given below. Series with fewer than 1,000 total rooms or fewer than 8 properties were excluded from the aggregation, because inventory swings at a single property would move the index too much.
| Category | Area | Properties | Total rooms | Observed properties | LT90 OCC | LT30 | LT21 | LT14 | LT7 | LT90 listed price | To last minute |
|---|---|---|---|---|---|---|---|---|---|---|---|
| ¥100k+ band | Tokyo | 35 | 3,682 | 25–35 | 75.3% | 63 | 62 | 46 | 31 | ¥125,818 | +22.8% |
| ¥100k+ band | Kyoto | 37 | 1,030 | 23–37 | 64.4% | 85 | 90 | 77 | 53 | ¥131,863 | -2.7% |
| ¥100k+ band | Okinawa | 95 | 3,900 | 48–92 | 76.2% | 76 | 70 | 67 | 66 | ¥149,433 | -2.3% |
| Deluxe | Tokyo | 40 | 11,924 | 32–40 | 80.3% | 57 | 46 | 38 | 34 | ¥70,628 | +17.6% |
| Deluxe | Osaka | 23 | 8,318 | 18–23 | 87.6% | 73 | 65 | 52 | 49 | ¥45,503 | +21.6% |
| Deluxe | Kyoto | 23 | 2,638 | 20–23 | 61.1% | 62 | 56 | 49 | 44 | ¥66,003 | +3.9% |
| Deluxe | Hokkaido | 14 | 1,533 | 11–14 | 84.5% | 73 | 58 | 52 | 39 | ¥53,251 | +38.5% |
| City | Tokyo | 100 | 32,712 | 83–100 | 75.4% | 52 | 42 | 36 | 28 | ¥40,591 | +21.2% |
| City | Osaka | 91 | 24,219 | 79–91 | 81.7% | 70 | 54 | 49 | 41 | ¥27,904 | +6.6% |
| City | Kyoto | 56 | 10,369 | 43–56 | 77.3% | 74 | 69 | 65 | 57 | ¥31,409 | -4.9% |
| City | Hokkaido | 72 | 15,704 | 58–72 | 80.6% | 30 | 21 | 19 | 20 | ¥32,654 | +10.6% |
| City | Okinawa | 14 | 3,155 | 13–14 | 74.0% | 61 | 46 | 41 | 38 | ¥28,782 | -16.5% |
| Business | Tokyo | 871 | 126,478 | 668–867 | 63.4% | 58 | 44 | 35 | 27 | ¥25,081 | +0.7% |
| Business | Osaka | 453 | 73,447 | 339–451 | 62.1% | 68 | 58 | 50 | 40 | ¥19,817 | -13.5% |
| Business | Kyoto | 293 | 31,712 | 207–288 | 68.7% | 68 | 57 | 53 | 45 | ¥22,054 | -22.5% |
| Business | Hokkaido | 392 | 44,513 | 267–390 | 77.5% | 43 | 32 | 26 | 23 | ¥23,699 | +4.5% |
| Business | Okinawa | 181 | 16,867 | 140–180 | 63.0% | 57 | 45 | 39 | 34 | ¥16,549 | -0.6% |
| Ryokan | Tokyo | 46 | 1,058 | 19–37 | 79.7% | 59 | 41 | 33 | 28 | ¥37,341 | +41.8% |
| Ryokan | Kyoto | 181 | 3,341 | 122–179 | 62.7% | 68 | 63 | 60 | 53 | ¥49,182 | -11.3% |
| Ryokan | Hokkaido | 271 | 11,685 | 151–265 | 76.4% | 63 | 56 | 52 | 48 | ¥36,103 | +1.4% |
Source: MetroEngines Research; compiled by the HotelBank Editorial Team
| Category | Area | Properties | Total rooms | Observed properties | LT90 OCC | LT30 | LT21 | LT14 | LT7 | LT90 listed price | To last minute |
|---|---|---|---|---|---|---|---|---|---|---|---|
| ¥100k+ band | Tokyo | 23 | 2,604 | 18–23 | 71.8% | 71 | 62 | 42 | 38 | ¥129,748 | +0.5% |
| ¥100k+ band | Kyoto | 36 | 1,038 | 22–36 | 64.4% | 64 | 46 | 31 | 28 | ¥136,961 | +1.3% |
| ¥100k+ band | Hokkaido | 45 | 1,173 | 24–45 | 83.6% | 51 | 34 | 24 | 19 | ¥135,014 | +11.1% |
| ¥100k+ band | Okinawa | 118 | 8,057 | 72–114 | 85.7% | 55 | 45 | 29 | 19 | ¥150,681 | +5.7% |
| Deluxe | Tokyo | 40 | 11,924 | 37–40 | 78.6% | 71 | 64 | 51 | 51 | ¥59,468 | -5.4% |
| Deluxe | Osaka | 23 | 8,318 | 22–23 | 84.5% | 84 | 75 | 61 | 54 | ¥38,359 | +11.7% |
| Deluxe | Kyoto | 23 | 2,638 | 21–23 | 63.7% | 66 | 60 | 53 | 52 | ¥63,892 | +25.1% |
| Deluxe | Hokkaido | 14 | 1,533 | 12–14 | 84.3% | 59 | 43 | 38 | 34 | ¥62,945 | +36.2% |
| City | Tokyo | 100 | 32,712 | 92–100 | 70.2% | 64 | 60 | 51 | 44 | ¥31,847 | +1.1% |
| City | Osaka | 91 | 24,219 | 86–91 | 77.9% | 69 | 61 | 55 | 48 | ¥22,057 | +3.7% |
| City | Kyoto | 56 | 10,369 | 51–56 | 75.3% | 70 | 61 | 55 | 48 | ¥29,072 | -1.5% |
| City | Hokkaido | 74 | 15,884 | 66–74 | 77.4% | 42 | 33 | 27 | 18 | ¥27,049 | +21.0% |
| City | Okinawa | 14 | 3,155 | 13–14 | 71.9% | 61 | 52 | 46 | 37 | ¥28,563 | -8.0% |
| Business | Tokyo | 869 | 126,076 | 766–865 | 61.2% | 64 | 55 | 46 | 39 | ¥18,157 | -12.8% |
| Business | Osaka | 453 | 73,447 | 395–451 | 58.3% | 73 | 64 | 55 | 47 | ¥14,862 | -17.2% |
| Business | Kyoto | 293 | 31,712 | 259–288 | 65.8% | 69 | 60 | 52 | 53 | ¥18,811 | -20.6% |
| Business | Hokkaido | 390 | 44,130 | 320–387 | 75.3% | 47 | 37 | 27 | 23 | ¥21,597 | -1.5% |
| Business | Okinawa | 181 | 16,834 | 164–180 | 61.0% | 61 | 52 | 43 | 34 | ¥15,826 | -4.1% |
| Ryokan | Tokyo | 47 | 1,063 | 24–47 | 75.5% | 51 | 41 | 30 | 22 | ¥38,894 | +0.3% |
| Ryokan | Kyoto | 180 | 3,340 | 123–178 | 63.3% | 65 | 56 | 40 | 33 | ¥52,674 | -19.2% |
| Ryokan | Hokkaido | 268 | 11,661 | 204–265 | 73.6% | 55 | 45 | 34 | 28 | ¥38,777 | -4.4% |
Source: MetroEngines Research; compiled by the HotelBank Editorial Team
Note that because the ¥100k+ band is defined on listed price, the properties it covers change from date to date. In Tokyo it comprises 35 properties and 3,682 rooms on August 1, 23 properties and 2,604 rooms on August 13, and 63 properties and 7,686 rooms on October 10, discussed below — a materially different population under the same “above ¥100k” label. The structure is such that the higher the rate on a given date, the more properties fall into the band. That the contents of the category are not fixed should be kept in mind as a premise when reading the figures here.
Observation data can also contain collection discontinuities, such as a large property’s listings being temporarily unverifiable in a particular week. This article excludes observation points deviating by 20% or more from the 15-day rolling median of per-property remaining rooms, then smooths with a 5-day rolling median. For Tokyo’s ¥100k+ band, 7 points were excluded on August 13 and 11 points on August 1.
Mid-course reading for October 10 (Saturday, first day of a long weekend)
For reference, we also look at Saturday October 10, 2026 (the first day of a three-day weekend including Sports Day), a date that has not yet reached check-in. This date, however, stood at LT61 as of our aggregation — two months still to run — so what follows is strictly a mid-course reading at LT61. Both the possibility that properties are adding inventory in stages and the possibility that the booking peak has not yet arrived are live, and no conclusion such as “sold out early” can be drawn from figures at this point.
| Category | Area | Properties | Total rooms | LT90 OCC | LT61 OCC | LT90 listed price | LT61 listed price |
|---|---|---|---|---|---|---|---|
| ¥100k+ band | Tokyo | 63 | 7,686 | 80.3% | 79.1% | ¥143,600 | ¥145,800 |
| ¥100k+ band | Kyoto | 69 | 2,923 | 69.3% | 77.4% | ¥181,100 | ¥166,700 |
| ¥100k+ band | Okinawa | 63 | 1,948 | 87.4% | 87.1% | ¥150,700 | ¥153,100 |
| Deluxe | Tokyo | 38 | 11,599 | 85.6% | 86.5% | ¥106,400 | ¥107,800 |
| City | Tokyo | 100 | 32,712 | 83.4% | 86.6% | ¥61,500 | ¥66,000 |
| Business | Tokyo | 853 | 124,872 | 64.9% | 71.6% | ¥35,100 | ¥37,600 |
| Business | Kyoto | 285 | 31,210 | 81.2% | 87.1% | ¥43,600 | ¥45,300 |
| Ryokan | Kyoto | 157 | 2,969 | 67.0% | 72.0% | ¥61,800 | ¥64,100 |
Source: MetroEngines Research; compiled by the HotelBank Editorial Team
For Tokyo’s ¥100k+ band, remaining rooms actually increased over these 30 days, from 1,513 at LT90 to 1,603 at LT61 (38–63 properties observed). This does not mean demand is weak; more likely, properties are adding published allocation on OTAs. Kyoto’s ¥100k+ band has progressed from 897 remaining rooms to 662 (26% depleted, 40–69 properties observed), so even on the same date the pace of progress differs by area. Both are mid-course readings at LT61, and the remaining two months need to be watched.
How to use the fact that “time to sell out” differs by price band
The measurements above come down to three points.
| Observed fact | Operational reading |
|---|---|
| On ordinary weekends, inventory depletion in the ¥100k+ band concentrates between LT14 and LT7 (median 67 at LT14, 53 at LT7) | The decisive window for the high-price tier is the final two weeks. There is design room to thicken exposure and inventory release during this period |
| At the start of Obon, the ¥100k+ band and ryokan clear fastest (median 30 and 34 at LT14), while Business and City are left behind | On peak dates the early-securing segment moves in the high-price tier. Business and City have room to capture another layer of demand in the closing stretch |
| On ordinary weekends the ¥100k+ band lifted its listed price by 22.8% while holding inventory; Business was flat at +0.7% | For the high-price tier, “inventory left over” does not mean “cut the rate” — an approach that raises the rate and lands the date late is demonstrably workable |
Source: MetroEngines Research; compiled by the HotelBank Editorial Team
What has practical value is not which category performs best, but knowing the lead time at which the peak arrives for your own property’s price band. Business hotels finish clearing a little over 40% of inventory by LT30, while the ¥100k+ band is still holding more than 70% at the same point. Once that difference is taken as given, it becomes clear that the very yardstick for judging a remaining-room ratio at LT30 as “behind schedule” ought to differ by price band. On where to place fixed checkpoints, our framework based on measurements in Okayama, which found that 45 days out, 30 days out and the last minute are enough for operations, is also worth consulting.
There is similarly room to manoeuvre in how price is moved. In the high-price tier on ordinary weekends, an approach that raises the rate late while holding inventory is demonstrably working, showing that a landing without last-minute discounting is possible. Conversely, because the high-price tier moves early on peak dates, pricing set in the LT45–LT30 stage all but determines the final revenue level. That the optimal timing for a given lever changes with the character of the date, even at the same property, is the practical crux of this analysis.
On day-level demand shapes at the area level, see also our comparison of ryokan, business and city curves for Saga during Obon 2026 and our reading of Obon in Iwate at three fixed points — 45 days out, 30 days out and the latest observation. Day-of-week demand shapes are covered in our analysis of day-of-week occupancy at business hotels in Saitama, and differences by property type on peak dates within a month in our article on August in Mie by property type.
Conclusion
To the question “do rooms above ¥100,000 remain until the end”, the measurements return a conditional answer. On an ordinary Saturday (August 1, 2026), the five-area median remaining-room index is 67 at LT14 and 53 at LT7 — inventory lasts longer than in any of the other five categories. At the start of Obon (August 13), however, the same metric reads 30 at LT14 and 24 at LT7, making it the fastest-clearing category. Whether inventory remains is determined not by the price band itself but by what kind of demand the date is made of.
This asymmetry means the scope for revenue design differs by price band. On dates with thick demand, lock price in early; on dates with relatively thin demand, raise the rate while carrying inventory. The measured data show that the latter genuinely works in the high-price tier. Grasping where the peak sits for your own property’s price band is the starting point for lead-time design.
⚠ Note on data for future dates: figures relating to October 10, 2026 are a mid-course reading based on inventory and selling prices published on OTAs and similar channels as of the survey point (LT61), and will move as the check-in date approaches. Because properties may add inventory or adjust prices, current levels will not necessarily be the final outcome.
Related Reading
- Median 39.2% of Rooms Online — Allocation Across 12,941 Hotels
- Saga Obon 2026: Ryokan Peak Aug 11, Not Aug 13; Aug 15 Down 6.5pt
- Iwate Obon 2026: Aug 13 Peaks 92.5%, Aug 15 Dips to 78.9% Both Types
- Saitama Business Hotels: Sat 77.2% vs Sun 70.1%, Gap Widens to 11pt
- Mie August Booking Curves: Business Hotels Swing 25.5pt, Ryokan 9.7pt
- Kyoto Obon 2026 Booking Curves: Ryokan Add the Most Close In, +11.4pt
- Okayama Booking Curves: 3 Checkpoints, Aug 8 Late-Surges +11.8pt
- Tokyo Aug 14: 434 Hotels, Front-Loaded 10.8% vs Late-Surge 9.4%
- Obon T-7: Kyushu’s 31.7pt Gap — Fukuoka 73.0%, Kagoshima 41.3%
References and Sources
■ Data source
Aggregated data from MetroEngines Research covering daily inventory and listed prices from 90 days before check-in to the last minute, for five categories split by price band and property type (¥100k+ band / Deluxe / City / Business / Ryokan) across five areas: Tokyo, Osaka, Kyoto, Hokkaido and Okinawa. The check-in dates covered are Saturday August 1, 2026, Thursday August 13, 2026 (start of Obon) and Saturday October 10, 2026. Listed price is the average across all plans (per-room rate for two people in one room, tax included).
■ Calculation assumptions
Because population size differs between categories by close to two orders of magnitude, we used per-property remaining rooms — remaining rooms divided by the number of properties observed that day — rather than a total of remaining rooms, and indexed it with the first observation day on which the observed property count is stable (LT90–LT86) as the starting point = 100. Series with fewer than 1,000 total rooms or fewer than 8 properties were excluded from the aggregation, because inventory swings at a single property would move the index too much. Observation points deviating by 20% or more from the 15-day rolling median of per-property remaining rooms were excluded as outliers, after which the series were smoothed with a 5-day rolling median.
■ Limitations and caveats
Occupancy is an estimate based on the depletion of selling inventory published on OTAs and similar channels, and differs in definition and scope from a property’s actual overall occupancy. Because the “¥100k+ band” is defined on listed price, the properties it contains change from date to date (in Tokyo: 35 properties on August 1, 23 on August 13 and 63 on October 10). The number of observed properties fluctuates daily with collection coverage and tends to increase as LT gets smaller. Figures for October 10, 2026 are a mid-course reading as of aggregation (LT61), and the final outcome will move with inventory additions and price adjustments by properties. This article is a descriptive comparison of measurements and does not assert causation.
- MetroEngines Research — booking curves and estimated occupancy based on inventory listed on OTAs for Tokyo, Osaka, Kyoto, Hokkaido and Okinawa (check-in August 1, August 13 and October 10, 2026; five categories × five areas)
- MetroEngines Research — listed price (average across all plans, tax included, per-room rate for two people in one room)
- Japan Tourism Agency, “Accommodation Travel Statistics Survey” (official occupancy statistics; definition and scope differ from the estimated occupancy used here)
- Japan National Tourism Organization (JNTO), “Statistics of Visitors to Japan”