

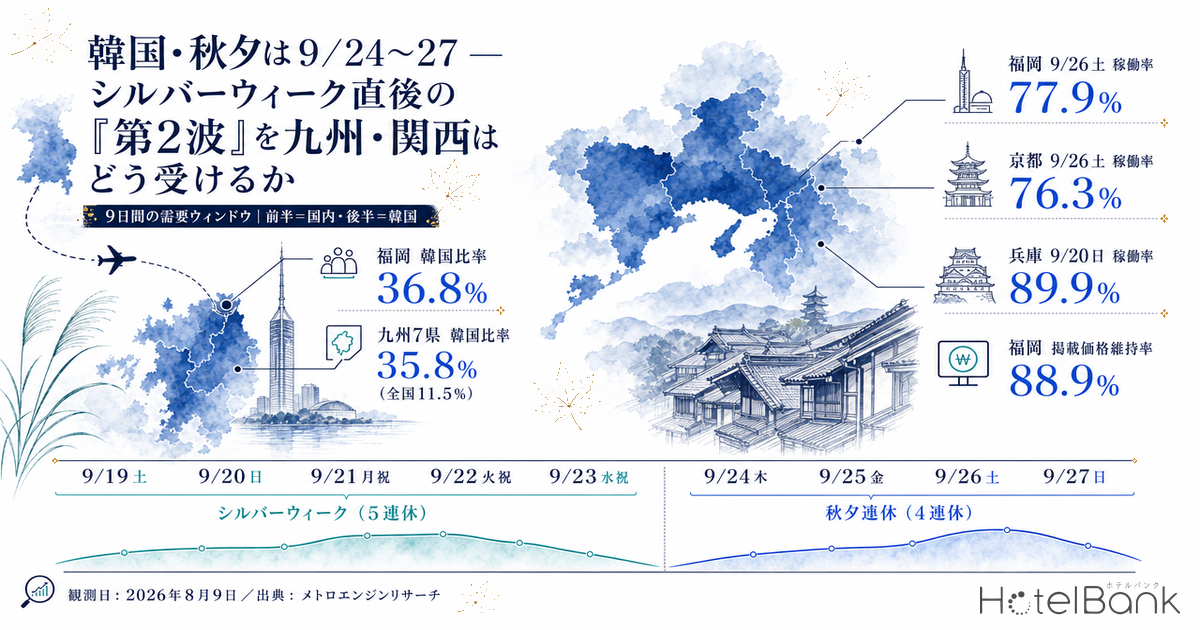
In September 2026, the major holiday periods of Japan and South Korea fall back-to-back. Japan’s Silver Week runs five days, from Saturday, September 19 through Wednesday, September 23 (Autumnal Equinox Day). The very next day, South Korea’s Chuseok holiday begins, running four days from Thursday, September 24 through Sunday, September 27. In other words, the nine days from September 19 to 27 can form a two-layered structure: the first half led by domestic demand, the second half carrying short-haul demand from South Korea. This article compares inventory absorption across those nine days for the seven prefectures of Kyushu and the three prefectures of Kansai, broken down by property type, to identify the markets where the outline of second-half demand is already visible.
Metric Definitions Used in This Article
- ADR (average daily rate): An estimated settled rate (tax-exclusive equivalent) calculated by applying property-type correction coefficients to the lowest published plan level each property posts on OTAs and similar channels (double occupancy, per-room rate, tax-inclusive). Cross-checked against property-level results disclosed by listed hotel REITs, the median error is approximately 7%. These are estimates and differ from each property’s actual transaction prices and accounting figures. Area-level ADR is the median of the properties covered (the level of a typical property in that area).
- OCC (occupancy): The share of sold rooms against total rooms in the area (an estimate based on OTA sales inventory). This article refers to it as “occupancy (estimated).” It is an estimate based on the absorption of inventory sold on OTAs and differs from a property’s overall actual occupancy.
- LT (lead time): The number of days until the check-in date. LT0 = same day.
- Listed price: The average across all plans of the selling prices posted on OTAs and similar channels as of August 9, 2026 (double occupancy, per-room rate, tax-inclusive). This is measured on a different basis from ADR.
- Data source: MetroEngines Research
- — The nine days from 9/19 to 9/27 are not a single holiday block—the first half is Japan’s five-day Silver Week, the second half is South Korea’s four-day Chuseok, and the leading guest segment switches between them.
- — On a Saturday-to-Saturday comparison matched for day of week and LT, only three prefectures hold flat: Fukuoka +0.3pt, Saga +1.9pt, and Kyoto −0.8pt. The Sunday comparison is negative in every prefecture because of how the calendar is structured.
- — What holds up in the second half is the urban formats; what pulls back is ryokan. In Fukuoka, city hotels are +3.3pt while ryokan are −9.7pt. Ryokan are negative in all ten prefectures, directly reflecting a format structure tied to Japanese domestic holidays.
- — On a room basis as well, Fukuoka’s Saturday 9/26 stands at 7.4% (11 of 148 properties), on par with the 8.3% of the first-half Saturday. Listed prices are also at 88.9% of the first-half Saturday, the highest of the ten prefectures—inventory and pricing point the same direction.
- — South Korea accounts for 35.8% of foreign guest-nights across Kyushu’s seven prefectures, more than triple the national average of 11.5%. Kyushu, which represents just 7.8% of Japan’s total foreign guest-nights, absorbs 24.3% of all Korean overnight stays nationwide.
Two Holiday Blocks Connect Across Nine Days — First, Fix the Dates
Let us pin down the calendar first. On the Japanese side, Monday, September 21 is Respect for the Aged Day and Wednesday, September 23 is Autumnal Equinox Day, which makes the Tuesday sandwiched between them, September 22, a “Citizens’ Holiday” under the Public Holiday Act. Combined with the preceding weekend, this creates a five-day break from Saturday, September 19 through Wednesday, September 23. This alignment has not occurred since 2015 — the first time in 11 years.
On the Korean side, Chuseok falls on Friday, September 25 in 2026. Because the day before Chuseok, the day itself, and the day after are all public holidays in South Korea, Thursday September 24, Friday September 25, and Saturday September 26 are holidays, and with Sunday the 27th following, this forms a four-day break. Because the 2026 Chuseok holiday does not overlap with a Sunday, no substitute holiday is added. Monday, September 28 is therefore a working day in South Korea as well.
Because the final day of Japan’s break (9/23) sits adjacent to the first day of Korea’s break (9/24), the accommodation market sees a continuous nine-day demand window. The starting point of this article is that the leading guest segment may switch between the first and second halves.
The Nine-Day Calendar
9/19 (Sat), 9/20 (Sun), 9/21 (Mon, Respect for the Aged Day), 9/22 (Tue, Citizens’ Holiday), 9/23 (Wed, Autumnal Equinox Day) = Japan’s Silver Week (five-day break)
9/24 (Thu), 9/25 (Fri, Chuseok itself), 9/26 (Sat), 9/27 (Sun) = South Korea’s Chuseok holiday (four-day break)
Inventory Absorption at 41–49 Days Out — Lining Up the Nine-Day Cross-Section
Now to the data. What follows is the occupancy (estimated) for each of the nine days as of a single observation date, August 9, 2026. Because everything is observed on the same day, no differences from observation timing enter the picture. On the other hand, the number of days to check-in (LT) runs from 41 days for 9/19 to 49 days for 9/27, so the later dates are further out. At the same rate of absorption, later dates will tend to read lower.
These are dates still more than 40 days away, and have not yet entered the peak booking window. What can be read here is a snapshot of progress to date, not the final landing point.
Source: Compiled by HotelBank Editorial Team from MetroEngines Research
| Prefecture | Properties observed | 9/19 Sat | 9/20 Sun | 9/21 Mon hol. | 9/22 Tue hol. | 9/23 Wed hol. | 9/24 Thu | 9/25 Fri | 9/26 Sat | 9/27 Sun |
|---|---|---|---|---|---|---|---|---|---|---|
| LT (days) | 41 | 42 | 43 | 44 | 45 | 46 | 47 | 48 | 49 | |
| Fukuoka | 613 | 78.6 | 79.8 | 75.0 | 72.5 | 67.1 | 68.5 | 73.1 | 77.9 | 69.1 |
| Saga | 172 | 78.5 | 83.8 | 77.6 | 67.0 | 62.1 | 68.7 | 71.6 | 79.2 | 65.9 |
| Nagasaki | 381 | 82.9 | 87.8 | 82.8 | 71.3 | 64.9 | 65.9 | 67.5 | 70.2 | 67.4 |
| Kumamoto | 482 | 80.6 | 87.6 | 83.1 | 74.1 | 68.8 | 72.1 | 76.8 | 88.4 | 80.5 |
| Oita | 577 | 79.5 | 88.0 | 83.7 | 71.7 | 65.0 | 66.5 | 69.0 | 72.2 | 64.5 |
| Miyazaki | 225 | 78.0 | 81.5 | 76.9 | 66.9 | 57.2 | 60.2 | 64.9 | 71.3 | 61.2 |
| Kagoshima | 511 | 65.3 | 72.0 | 73.8 | 57.9 | 49.5 | 50.1 | 52.1 | 54.4 | 48.8 |
| Osaka | 711 | 78.3 | 78.2 | 71.9 | 69.7 | 64.0 | 65.0 | 68.7 | 71.0 | 64.4 |
| Kyoto | 1,082 | 78.7 | 82.7 | 79.5 | 72.7 | 70.2 | 73.6 | 76.0 | 76.3 | 71.5 |
| Hyogo | 811 | 81.4 | 89.9 | 81.5 | 72.7 | 65.7 | 68.6 | 69.5 | 75.1 | 68.6 |
Units = occupancy (estimated, %). Shading marks the Chuseok holiday (9/24–27). The observation date is August 9, 2026 for all columns. The number of properties observed is nearly constant across the nine days in each prefecture (e.g., 613–618 properties in Fukuoka).
Source: Compiled by HotelBank Editorial Team from MetroEngines Research
The first thing that stands out is that 9/20 (Sun) is the peak of the nine days in every prefecture. Because the following day, 9/21, is Respect for the Aged Day, this Sunday effectively functions as a mid-holiday night. Levels such as Hyogo at 89.9%, Oita at 88.0%, and Nagasaki at 87.8% line up here.
Conversely, 9/23 (Wed, Autumnal Equinox Day) is the last day of the break, with weekdays resuming the next morning, so it sits near the nine-day floor in every prefecture. Some prefectures fall to around the 50% mark, such as Kagoshima at 49.5% and Miyazaki at 57.2%.
Turning to the second half (9/24–27), most prefectures come in below their first-half levels. However, Fukuoka’s 9/26 (Sat) at 77.9% and Kyoto’s 9/26 (Sat) at 76.3% are almost identical to their own 9/19 (Sat) readings of 78.6% and 78.7%. Given that these dates are seven days more disadvantaged in LT terms, the second-half Saturday in these two prefectures can be read as effectively level with the first-half Saturday.
Matching the Day of Week — Saturday vs Saturday, Sunday vs Sunday
Because the two holiday blocks have different day-of-week compositions, comparing period averages against each other invites misreading. So we match the day of week and pit Silver Week’s weekend (9/19 and 9/20) directly against Chuseok’s weekend (9/26 and 9/27). Both come from the same observation date, so there is no gap in observation timing.
On top of that, we correct for the handicap that the later dates are seven days further out in LT terms. For each prefecture, we derived the pace at which occupancy (estimated) advances over the LT 56–41 band (progress per day) from that prefecture’s own curve, multiplied that slope by seven days, and added it back to the second-half side. If the corrected difference is positive, it means that “even after matching day of week and LT, the second half is further along.”
Source: Compiled by HotelBank Editorial Team from MetroEngines Research
In the corrected Saturday-to-Saturday comparison, the prefectures standing in positive territory are Fukuoka (+0.3pt) and Saga (+1.9pt). Kyoto is essentially flat at −0.8pt. In these three prefectures, the Chuseok Saturday stands shoulder to shoulder with the Silver Week Saturday.
The Sunday-to-Sunday comparison, on the other hand, is negative in every prefecture. This owes more to calendar structure than to demand strength. September 20 (Sun) is followed by a public holiday, whereas September 27 (Sun) is followed by a working day in both Japan and South Korea. The smallest gaps are in Kyoto (−9.6pt) and Fukuoka (−9.7pt), roughly 13pt away from Oita (−22.5pt) and Kagoshima (−22.6pt).
A Note on How Kumamoto’s Figures Are Treated
Kumamoto Prefecture is under the influence of the 2026 Kumamoto Earthquake, which struck on July 28, 2026. According to the tally by the prefectural ryokan and hotel sanitation trade association, as of August 3, 29 properties were suspended and 7 were partially operating, leaving room inventory on OTAs in an abnormal state, particularly in the affected areas. When inventory thins, the remaining-room rate falls and occupancy (estimated) reads higher than it otherwise would. The tables and charts in this article include Kumamoto for reference, but it should be read separately from any judgment about second-half demand. For details, see Kumamoto Quake 2026, 72 Hours On: 6 Closures vs 17.9% Inventory Loss.
Breaking It Down by Property Type — Urban Formats Hold, Ryokan Pull Back
Breaking that same Saturday-vs-Saturday comparison (after LT correction) into four property types — business hotels, city hotels, resort hotels, and ryokan — brings the character of second-half demand into focus.
Source: Compiled by HotelBank Editorial Team from MetroEngines Research
| Prefecture | Business hotels | City hotels | Resort hotels | Ryokan |
|---|---|---|---|---|
| Fukuoka | +0.2 n=307 | +3.3 n=35 | +0.2 n=14 | -9.7 n=63 |
| Saga | +4.4 n=42 | -0.9 n=7 | +12.3 n=7 | -6.4 n=81 |
| Nagasaki | -12.2 n=113 | -14.6 n=23 | -10.0 n=34 | -8.0 n=62 |
| Kumamoto | +17.2 n=92 | +15.1 n=17 | +10.3 n=21 | -2.8 n=202 |
| Oita | -6.2 n=81 | +2.3 n=14 | -4.0 n=35 | -8.1 n=271 |
| Miyazaki | -7.2 n=77 | -1.8 n=18 | +3.2 n=15 | -17.1 n=34 |
| Kagoshima | -9.4 n=138 | -2.9 n=24 | -10.7 n=43 | -19.1 n=76 |
| Osaka | -7.7 n=449 | -2.1 n=91 | -6.6 n=4 | -8.5 n=29 |
| Kyoto | -0.9 n=282 | +2.7 n=55 | -0.7 n=11 | -4.3 n=162 |
| Hyogo | -3.9 n=146 | -3.2 n=46 | -9.0 n=46 | -6.5 n=241 |
Units = pt. Occupancy (estimated) for 9/19 (Sat) subtracted from that for 9/26 (Sat), with the 7-day LT gap corrected using each prefecture’s own absorption pace. A positive value indicates the second-half Saturday is further along. n is the number of properties observed in each format. Kumamoto is a reference value because it is under the influence of the earthquake.
Source: Compiled by HotelBank Editorial Team from MetroEngines Research
In Fukuoka, all three urban formats hold flat or better — business hotels +0.2pt, city hotels +3.3pt, resort hotels +0.2pt — and only ryokan fall, at −9.7pt. Kyoto takes the same shape: city hotels +2.7pt, business hotels −0.9pt, and resort hotels −0.7pt, against ryokan at −4.3pt.
Ryokan are a format tightly bound to Japanese holidays. Domestic leisure demand — three-generation family trips, onsen stays — concentrates in the first half and does not carry into the second. That ryokan are negative in all ten prefectures is a direct reflection of this structure. Among Kyushu’s ryokan, the drops are steepest in Kagoshima at −19.1pt and Miyazaki at −17.1pt.
What holds up in the second half, by contrast, is the urban formats. Short-haul international travel tends to prioritize access to airports and ports along with walkability in the city center, so accommodation likewise tends to cluster in downtown business and city hotels. That Fukuoka and Kyoto — two urban markets — maintain their levels into the second half is consistent with this guest-segment composition.
How Inventory Is Tightening on a Room Basis
Occupancy (estimated) is an area-wide aggregate, so it is worth looking separately at how tightly inventory is filling at the individual property level. Here we narrow the population to only those properties releasing at least 30% of their total rooms to OTAs and similar channels, and count the share of those whose remaining-room rate has fallen to 10% or below. This is a room-count metric; it does not use the number of plans.
| Prefecture | 9/19 Sat | 9/20 Sun | 9/23 Wed hol. | 9/24 Thu | 9/25 Fri | 9/26 Sat | 9/27 Sun |
|---|---|---|---|---|---|---|---|
| Fukuoka | 8.3% 11/132 | 10.3% 14/136 | 0.0% 0/205 | 0.0% 0/202 | 2.8% 5/180 | 7.4% 11/148 | 1.0% 2/193 |
| Saga | 6.4% 7/109 | 26.9% 25/93 | 0.0% 0/134 | 0.0% 0/123 | 0.8% 1/129 | 4.3% 5/117 | 0.0% 0/137 |
| Nagasaki | 1.7% 2/115 | 22.9% 22/96 | 0.0% 0/154 | 0.0% 0/153 | 0.7% 1/146 | 0.0% 0/145 | 0.0% 0/150 |
| Kumamoto | 5.2% 10/191 | 14.8% 22/149 | 2.6% 6/234 | 2.3% 5/219 | 3.6% 8/224 | 4.3% 9/207 | 1.8% 4/227 |
| Oita | 2.6% 5/191 | 18.0% 24/133 | 0.5% 1/221 | 0.0% 0/208 | 0.0% 0/236 | 0.8% 2/251 | 0.8% 2/249 |
| Miyazaki | 4.7% 6/128 | 16.5% 18/109 | 0.0% 0/180 | 0.6% 1/174 | 1.1% 2/181 | 0.6% 1/165 | 0.0% 0/176 |
| Kagoshima | 3.5% 5/142 | 9.2% 11/120 | 0.5% 1/195 | 0.5% 1/191 | 1.5% 3/194 | 2.1% 4/190 | 0.5% 1/200 |
| Osaka | 11.0% 13/118 | 13.4% 16/119 | 1.1% 2/187 | 1.1% 2/189 | 1.2% 2/169 | 1.4% 2/141 | 1.1% 2/188 |
| Kyoto | 17.2% 16/93 | 21.2% 18/85 | 0.8% 1/128 | 0.0% 0/111 | 1.8% 2/113 | 2.8% 3/107 | 0.9% 1/115 |
| Hyogo | 4.5% 10/220 | 5.6% 10/178 | 1.1% 3/283 | 0.4% 1/261 | 0.7% 2/282 | 1.7% 4/242 | 1.1% 3/279 |
Number of properties at a remaining-room rate of 10% or below / number of properties in the tally. The tally covers only properties whose released allocation to OTAs and similar channels is 30% or more of total rooms (properties below 30% are excluded). Because the size of the population differs by date, absolute counts are shown alongside the ratios. Observed as of August 10, 2026. Kumamoto is a reference value because it is under the influence of the earthquake.
Source: Compiled by HotelBank Editorial Team from MetroEngines Research
The highest second-half ratio is Fukuoka’s 9/26 (Sat) at 7.4% (11 of 148 properties), which is nearly the same level as that prefecture’s 9/19 (Sat) at 8.3% (11 of 132 properties). Because the second half in other prefectures largely stays in the 0–4% range, Fukuoka’s second-half Saturday has a clear outline on a room basis as well. It is worth noting that two separate lenses — area aggregation (occupancy) and property-level aggregation (remaining-room rate) — point in the same direction.
One caveat deserves mention regarding the exclusion of properties releasing less than 30% of their total rooms. There is no single reason why a released allocation might be small. Some properties center their business on direct sales through their own website or call center, or on travel agencies and corporate contracts; others practice inventory control, holding back from releasing all stock to OTAs at once and adding it in small increments as check-in approaches; and in still other cases the contractual allotment itself is simply small. Because public data cannot distinguish between these, such properties are left out of the tally.
How Far Are Listed Prices Holding Up in the Second Half?
Alongside inventory absorption, it is worth confirming where the second half sits from the pricing side. The following looks at the listed price for 9/26 (Sat) as a percentage of that for 9/19 (Sat). Listed price is an average across all plans and is measured on a different basis from the ADR (estimated settled rate) discussed above.
Source: Compiled by HotelBank Editorial Team from MetroEngines Research
Fukuoka, at 88.9%, holds its second-half level better than any of the ten prefectures apart from earthquake-affected Kumamoto (99.8%, reference value). Saga and Kyoto follow, tied at 84.2%. In Nagasaki (72.8%), Oita (76.3%), and Osaka (75.8%), the second-half Saturday’s listed price falls below 80% of the first-half Saturday.
This pricing-side ranking broadly overlaps with the inventory-absorption ranking above. In Fukuoka, Kyoto, and Saga — the markets where inventory is also progressing in the second half — listed prices are being held at relatively high levels. This is a state in which inventory is moving without discounting, which can be read as a certain amount of second-half demand being priced in. That said, this is only a listing snapshot from early August, and it will shift with future plan additions and price adjustments.
How Deep Is Kyushu’s Capacity to Host Korean Guests?
We should now corroborate, against official statistics, whether this lineup of “markets that hold up in the second half” is consistent with demand from South Korea. From the Japan Tourism Agency’s “Overnight Travel Statistics Survey” (2025, final figures / properties with 10 or more employees), we extract South Korea’s share of foreign guest-nights by prefecture.
Source: Compiled by HotelBank Editorial Team from MetroEngines Research
| Prefecture / region | Foreign guest-nights | Of which South Korea | Korea share | Share of all Korean stays nationwide |
|---|---|---|---|---|
| Fukuoka | 7,831,810 | 2,883,440 | 36.8% | 16.26% |
| Saga | 240,330 | 82,230 | 34.2% | 0.46% |
| Nagasaki | 529,940 | 165,980 | 31.3% | 0.94% |
| Kumamoto | 1,565,840 | 491,720 | 31.4% | 2.77% |
| Oita | 1,097,070 | 426,540 | 38.9% | 2.41% |
| Miyazaki | 188,790 | 58,950 | 31.2% | 0.33% |
| Kagoshima | 562,520 | 192,710 | 34.3% | 1.09% |
| Kyushu 7 prefectures, total | 12,016,300 | 4,301,570 | 35.8% | 24.3% |
| Osaka | 23,179,170 | 2,835,280 | 12.2% | 15.99% |
| Kyoto | 15,591,430 | 732,320 | 4.7% | 4.13% |
| Hyogo | 1,897,870 | 195,030 | 10.3% | 1.10% |
| Kansai 3 prefectures, total | 40,668,470 | 3,762,630 | 9.3% | 21.2% |
| Nationwide | 154,254,100 | 17,731,300 | 11.5% | 100.00% |
January–December 2025. Covers properties with 10 or more employees.
Compiled by HotelBank Editorial Team from the Japan Tourism Agency “Overnight Travel Statistics Survey” (2025 final figures)
Summing Kyushu’s seven prefectures, South Korea accounts for 4.302 million of 12.016 million foreign guest-nights — a Korea share of 35.8%, more than triple the national average of 11.5%. At the individual prefecture level, the top ranks are dominated by Kyushu: Oita 38.9%, Fukuoka 36.8%, Kagoshima 34.3%, and Saga 34.2%. Kyushu’s seven prefectures account for just 7.8% of Japan’s total foreign guest-nights, yet they absorb 24.3% of all Korean overnight stays nationwide.
The three Kansai prefectures come in at a Korea share of 9.3%; relative to their total volume of foreign stays (40.668 million guest-nights), South Korea’s weight is small. In absolute terms, however, they draw 3.763 million guest-nights, or 21.2% of all Korean stays nationwide. Osaka in particular, at 2.835 million guest-nights, is second only to Tokyo (3.676 million) among individual prefectures. The distinction is between “Kyushu, deep in share” and “Kansai, deep in absolute volume.”
Conditions on the demand side are also favorable. Japan National Tourism Organization (JNTO) estimates put Korean visitors to Japan at 5,675,100 for January–June 2026, up 18.6% year on year. Against a total of 21.08 million inbound visitors over the same period — down 2.0% year on year — South Korea is leading growth among source markets. It is reasonable to assume that both Kyushu and Kansai still have room to absorb that growth.
September Rate Levels — Kyushu Trending Up, Kansai Varying by Market
Finally, let us check the estimated settled ADR for September. On a year-on-year basis, all seven Kyushu prefectures are positive, and the prefectures with the lowest rates show the largest gains: Kagoshima +50.0%, Miyazaki +47.6%, and Nagasaki +43.8%.
Source: Compiled by HotelBank Editorial Team from MetroEngines Research
| Prefecture | Sep 2024 | Sep 2025 | Sep 2026 | YoY | N (properties) |
|---|---|---|---|---|---|
| Fukuoka | ¥9,732 | ¥10,561 | ¥12,976 | +22.9% | 459 |
| Saga | ¥14,256 | ¥11,665 | ¥14,143 | +21.2% | 152 |
| Nagasaki | ¥7,760 | ¥7,444 | ¥10,708 | +43.8% | 249 |
| Kumamoto | ¥10,438 | ¥10,078 | ¥13,269 | +31.7% | 386 |
| Oita | ¥13,930 | ¥13,266 | ¥15,321 | +15.5% | 447 |
| Miyazaki | ¥7,036 | ¥6,534 | ¥9,641 | +47.6% | 159 |
| Kagoshima | ¥6,546 | ¥6,486 | ¥9,729 | +50.0% | 307 |
| Osaka | ¥9,030 | ¥13,764 | ¥10,044 | -27.0% | 630 |
| Kyoto | ¥12,994 | ¥14,017 | ¥14,154 | +1.0% | 574 |
| Hyogo | ¥11,411 | ¥12,439 | ¥13,635 | +9.6% | 526 |
Estimated settled ADR (tax-exclusive equivalent). The September 2026 figure is an estimate based on listing levels at the time of the survey and will shift going forward.
Source: Compiled by HotelBank Editorial Team from MetroEngines Research
Kansai splits. Osaka is down sharply at −27.0%, but this owes to a high comparison base: September 2025 fell during the Osaka-Kansai Expo. Kyoto is essentially flat at +1.0%, and Hyogo is at +9.6%. On Osaka’s post-Expo pullback, Osaka Settled ADR June 2026: City -26.3%, Business -32.8% Post-Expo tracks the month-by-month trajectory.
Kyushu’s rate increases reflect both the accumulation of inbound demand centered on South Korea and the overlay of domestic demand. Fukuoka and Saga are the prefectures where inventory is also progressing in the second half (the Chuseok side) during a phase of rising rates, which puts these two in a position to capture both layers — first half and second.
How Robust Is the Conclusion? — Correction Strength and the ADR × Occupancy Picture
Everything read so far rests on comparing the second-half dates (9/24–27) after correcting, from each prefecture’s own absorption pace, for the handicap that they sit seven days further out in LT terms. If changing how the correction is applied flips the conclusion, then the reading is weak. So we vary the strength of the correction.
| Prefecture | No correction (k=0) | Used in text (k=1.0) | Stronger (k=2.0) | Notes |
|---|---|---|---|---|
| Fukuoka | -0.7 | +0.3 | +1.3 | |
| Saga | +0.7 | +1.9 | +3.1 | |
| Nagasaki | -12.7 | -11.8 | -10.9 | |
| Kumamoto | +7.8 | +11.7 | +15.6 | Reference value |
| Oita | -7.3 | -6.3 | -5.3 | |
| Miyazaki | -6.7 | -5.5 | -4.3 | |
| Kagoshima | -10.9 | -10.3 | -9.7 | |
| Osaka | -7.3 | -6.0 | -4.7 | |
| Kyoto | -2.4 | -0.8 | +0.8 | |
| Hyogo | -6.3 | -4.9 | -3.5 |
The raw difference obtained by subtracting occupancy (estimated) for 9/19 (Sat) from that for 9/26 (Sat), with the correction amount for the 7-day LT gap multiplied by coefficient k and added back. k=1.0 is the correction adopted in the text. The correction amount ranges from 0.6 to 3.9pt by prefecture, and across the range from k=0 (a conservative reading applying no correction at all) to k=2.0 (a reading that estimates the LT gap at double), the lineup of prefectures standing in positive territory does not change. This is not a forecast of where things will land; it is a calculation to verify how much the text’s correction assumptions drive the conclusion.
Source: Compiled by HotelBank Editorial Team from MetroEngines Research
Even under a conservative reading with no correction applied at all (k=0), the only prefecture in positive territory is Saga (+0.7pt), while Fukuoka at −0.7pt and Kyoto at −2.4pt remain within the flat band. Conversely, even estimating the correction at double (k=2.0), Nagasaki, Kagoshima, Oita, Miyazaki, Osaka, and Hyogo never emerge from negative territory. The lineup of Fukuoka, Saga, and Kyoto in the flat band, with the rest clearly negative, does not depend on how the correction assumption is set. Excluding earthquake-affected Kumamoto, the number of prefectures in positive territory (0pt or above) is one at k=0, two at k=1.0, and three at k=2.0.
One more thing worth establishing is the combined picture of rate and occupancy. This article has looked at September’s estimated settled ADR (Table 5) and the nine-day occupancy (estimated) (Table 1) independently, but multiplying the two gives a rough indication of revenue per room. This is multiplication exactly as defined; it adds no new estimate.
| Estimated settled ADR \ occupancy (estimated) | 50% | 60% | 70% | 80% | 90% |
|---|---|---|---|---|---|
| ¥9,600 | ¥4,800 | ¥5,760 | ¥6,720 | ¥7,680 | ¥8,640 |
| ¥11,000 | ¥5,500 | ¥6,600 | ¥7,700 | ¥8,800 | ¥9,900 |
| ¥12,400 | ¥6,200 | ¥7,440 | ¥8,680 | ¥9,920 | ¥11,160 |
| ¥13,800 | ¥6,900 | ¥8,280 | ¥9,660 | ¥11,040 | ¥12,420 |
| ¥15,300 | ¥7,650 | ¥9,180 | ¥10,710 | ¥12,240 | ¥13,770 |
Both axes are kept within the range actually measured in this article (estimated settled ADR of ¥9,641–¥15,321 for September 2026; occupancy (estimated) of 48.8–89.9% across the nine days). Each cell is simply the product of the two figures and contains no new estimate or forecast. Because occupancy (estimated) is based on OTA listed inventory and reads higher than actual occupancy, this product should be read as a guide for relative comparison between markets and dates, not as an absolute level.
Source: Compiled by HotelBank Editorial Team from MetroEngines Research
Fukuoka, for example, has a September estimated settled ADR of ¥12,976 and occupancy (estimated) of 77.9% on 9/26 (Sat). Reading the corresponding band in Table 7 (ADR ¥12,400–¥13,800 × occupancy 70–80%) places it at ¥8,680–¥11,040 per room. Kagoshima, where the second half drops sharply, has a September estimated settled ADR of ¥9,729 and occupancy (estimated) of 54.4% on 9/26 (Sat) — both as observed on August 9–10, 2026 — putting it in the lower left of the same table (¥9,600 × 50–60%), or around ¥4,800–¥5,760. Whether inventory holds up in the second half operates on a different axis from the level of rates—Kagoshima sits on the low side for both rate and occupancy, but Oita has the highest rate of the ten prefectures (¥15,321) and still comes in at −6.3pt on the second-half Saturday, so a high rate does not guarantee second-half demand.
What these two checks establish is that the split between first and second half is structural, unaffected by how the correction is set, and that it is a separate question from the level of rates. Pricing design should look at the vertical axis of Table 7, and inventory design at the ordering in Table 6 — the two are better decided separately.
Conclusion — Do Not Treat the Nine Days as a Single Holiday
Here is a summary of what this article found.
| Aspect | What the data shows |
|---|---|
| Calendar | Japan’s Silver Week (9/19–23) and South Korea’s Chuseok holiday (9/24–27) sit adjacent, forming a nine-day demand window. No substitute holiday is added on the Korean side. |
| Inventory absorption (first half) | 9/20 (Sun) is the peak of the nine days; 9/23 (Wed, Autumnal Equinox Day) is the floor. A typical domestic-holiday shape. |
| Inventory absorption (second half) | On a Saturday comparison matched for day of week and LT, Fukuoka +0.3pt, Saga +1.9pt, and Kyoto −0.8pt sit in the flat band. Other prefectures are −5 to −12pt. |
| Property type | What holds up in the second half is the urban formats (business and city). Ryokan are negative in all ten prefectures, with demand concentrated in the first half. |
| Pricing | Second-half Saturday listed price relative to first-half Saturday: Fukuoka 88.9%, Saga and Kyoto 84.2%. Consistent with the inventory-absorption ranking. |
| Hosting capacity | The Korea share across Kyushu’s seven prefectures is 35.8% (11.5% nationwide). Kyushu absorbs 24.3% of all Korean overnight stays nationwide. |
Source: Compiled by HotelBank Editorial Team from MetroEngines Research
The practical implication comes down to this: do not run the nine days as a single holiday with one pricing and one inventory design. The first half belongs to domestic leisure, where ryokan and resort half-board plans and multi-night stays work. The second half shifts toward urban formats, where the booking shape tends to be different — room-only, shorter stays, and later lead times. Even within the same property, there is room to switch how plans are presented and how inventory is held back between the first and second halves.
Fukuoka, Saga, and Kyoto in particular show a visible outline of second-half demand. These are markets where a design that avoids exhausting inventory in the first half and deliberately reserves an allocation for the second half is likely to work. Conversely, in markets such as Nagasaki, Oita, Kagoshima, and Miyazaki, where the second half falls well short of the first, it is more realistic to design for multi-night stays and touring itineraries than to push for high levels in the second half.
That said — and to repeat — this is a snapshot taken at a point when 9/24–27 were still more than 40 days away. There is every possibility that the situation will change once bookings enter their peak window. The next checkpoints are likely to be twice: in early September (around LT20) and in the final run-up (around LT7).
⚠ Note on data for future dates: The occupancy (estimated), listed prices, and estimated settled ADR in this article are all estimates based on inventory and selling prices published on OTAs and similar channels as of August 9–10, 2026, and will shift as check-in approaches. The analysis period of September 19–27 was 40–49 days out at the time of the survey — a snapshot taken before bookings enter their peak window. This article indicates the state of progress at the present moment and does not assert where occupancy and rates will finally land. In addition, Kumamoto Prefecture is under the influence of the 2026 Kumamoto Earthquake, and because its inventory sales conditions differ from normal, its figures are treated as reference values.
Related Reading
- Double Ten x Sports Day: Japan’s Oct 9-12 Capacity at 76 Days Out
- Korea’s Mini-Holiday Moves Kyushu ADR: Testing Inbound “Routinization” with OTA Data
- US Now Tops Japan Inbound at 13.5% — Prefecture Host Map 2026
- Obon T-7: Kyushu’s 31.7pt Gap — Fukuoka 73.0%, Kagoshima 41.3%
- Osaka Settled ADR June 2026: City -26.3%, Business -32.8% Post-Expo
- Silver Week 2026: First in 11 Years — ADR & Booking Curve Analysis
- Oita Ryokan vs Resorts: 61.6% and 78.5% OCC 45 Days Out for Sep 12
References and Sources
■ Data sources
Occupancy (estimated), remaining-room rate, listed prices, and estimated settled ADR are compiled by MetroEngines Research (7 Kyushu prefectures + 3 Kansai prefectures, all property types, observation dates August 9–10, 2026, target check-in dates September 19–27, 2026). Korean hosting capacity is from the Japan Tourism Agency’s “Overnight Travel Statistics Survey,” 2025 final figures (properties with 10 or more employees); inbound visitor counts are Japan National Tourism Organization (JNTO) estimates. Holiday dates were confirmed against the official public-holiday information for Japan and South Korea respectively.
■ Calculation assumptions
Occupancy (estimated) = 100 − 100 × OTA-listed remaining rooms ÷ total rooms. All nine days are cross-sections from the same observation date, so no differences from observation timing enter the picture. In day-of-week-matched comparisons, the handicap that the second-half dates sit seven days further out in LT terms is added back to the second-half side using the slope derived from each prefecture’s per-day absorption over the LT 56–41 band, multiplied by seven days (k=1.0 in Table 6). The tally of properties at a remaining-room rate of 10% or below uses as its population only properties whose released allocation to OTAs and similar channels is 30% or more of total rooms, and counts on a room basis (the number of plans is not used). Estimated settled ADR is the monthly median on a double-occupancy, tax-exclusive-equivalent basis. The estimated RevPAR equivalent in Table 7 is the product of estimated settled ADR × occupancy (estimated) exactly as defined and includes no new estimate.
■ Limitations and caveats
The target dates were 41–49 days out at the time of observation — a snapshot taken before bookings enter their peak window. This article does not forecast where occupancy and rates will finally land. Because occupancy (estimated) is based on OTA listed inventory, it reads higher than a property’s overall actual occupancy. Listed prices (all-plan average, tax-inclusive) and estimated settled ADR (lowest-plan basis, tax-exclusive equivalent) are measured on different bases and cannot be compared directly. Kumamoto Prefecture is under the influence of the 2026 Kumamoto Earthquake and its inventory sales conditions differ from normal, so it is treated as a reference value in all tables and charts and is separated from any judgment about second-half demand. The official statistics indicating Korean hosting capacity are 2025 results and do not guarantee demand in September 2026.
■ Market data
- MetroEngines Research — occupancy (estimated), remaining-room rate, listed prices, estimated settled ADR. 7 Kyushu prefectures and 3 Kansai prefectures, all property types, observation dates August 9–10, 2026.
■ Government statistics and official data
- Japan Tourism Agency, “Overnight Travel Statistics Survey” (2025 final figures / Reference Table 1, foreign guest-nights by nationality (place of origin), properties with 10 or more employees)
- Japan National Tourism Organization (JNTO), “Foreign Visitors to Japan (June 2026 estimate)”
- Japan Tourism Agency, “2026 Kumamoto Earthquake Related Information”
■ Calendar and holiday-date confirmation
- 2026년 추석(한가위) 날짜 — 추석 연휴·대체공휴일 안내 (dates of the Korean Chuseok holiday and whether a substitute holiday applies)
- “When is Silver Week 2026? What to do over the holidays” (dates of Japan’s 2026 Silver Week)
■ News