

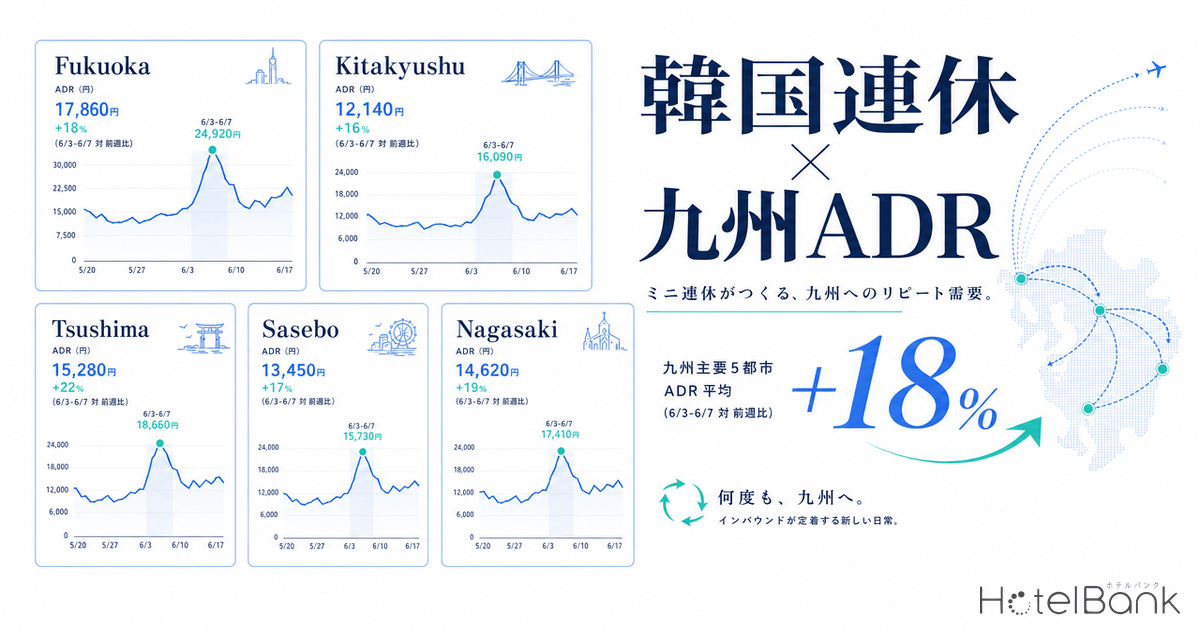
On Wednesday, June 3, 2026, South Korea will hold its quadrennial nationwide local elections. Election day is designated as a temporary public holiday, and the following Saturday, June 6, is Memorial Day (Hyeonchungil). By taking one or two days of paid leave on the intervening Thursday and Friday, Koreans can string together up to a five-day break from June 3 to 7, and local Korean media have long dubbed this the “mini June golden week.”
In a report published on February 13, 2026, Aun Consulting analyzed inbound travel from Korea, Taiwan, and Hong Kong as having “settled into a routine that feels less like travel and more like domestic travel.” Their thesis is that weekend trips to Japan and purpose-driven micro-trips—golf, hiking, pop-culture pilgrimages—have become the norm in an ultra-high-repeat-rate market where over 90% of visitors are returnees.
Does this “routinization of inbound travel” hypothesis show up empirically in Japanese hotel pricing aligned with Korea’s June 3–7 holiday? We targeted five Kyushu areas where Korean visitors concentrate (Fukuoka, Kitakyushu, Tsushima, Sasebo, Nagasaki) and three Tokyo metropolitan areas (Shin-Okubo in Shinjuku Ward, Ueno in Taito Ward, and Akasaka in Minato Ward)—620 properties in total—and aggregated daily rates and sold-out ratios via MetroEngines Research, comparing them against ordinary June weekdays. The results show an interesting distribution that partially supports and partially contradicts the hypothesis.
Metric Definitions Used in This Article
- ADR (Average Daily Rate): Average of listed prices on OTAs and similar platforms. Differs from actual transaction prices. Per-room rate (tax included) for double occupancy, averaged across all plans (room-only through plans with meals).
- Sold-out Ratio: Share of plans that had closed reservations on OTAs at the time of survey. Differs from a property’s overall room occupancy rate.
- Holiday Lift: Difference between the daily average for holiday weekdays (Wed 6/3, Thu 6/4, Fri 6/5) and the daily average for ordinary June weekdays (Tue–Fri of 6/9–12 and 6/16–19), expressed in % for ADR and percentage points for sold-out ratio. To exclude weekend bias, Saturday 6/6 and Sunday 6/7 within the holiday are tabulated separately.
- Data Source: MetroEngines Research (620 properties surveyed, over 440,000 plan observations cumulatively).
Why Korea’s June Holiday Matters
In Korea, June 3, 2026 (Wednesday) is the polling day for the 9th nationwide simultaneous local elections, designated as a temporary public holiday. The following Saturday, June 6, is Memorial Day (Hyeonchungil), honoring those who died in service. Taking even a single day of paid leave on Thursday June 4 or Friday June 5 sandwiched between these holidays creates a chain of up to five consecutive days off, from Wednesday the 3rd through Sunday the 7th. Korean overseas-travel sites have been promoting this as a “mini golden week” since early in the year, and it has been viewed as a window when short-haul demand to nearby Asian destinations spikes.
Compared with Korea’s major holidays—Golden Week, summer vacation, Chuseok, Lunar New Year—this break is on the small side. But a 4-night, 5-day itinerary is exactly the right size to function as a “micro-holiday” for nearby Asia. In Japanese terms, it has the character of a Silver Week or three-day weekend (for the pricing structure of Japan’s major holidays, see Silver Week 2026 — First in 11 Years: ADR Analysis and Booking Curve for the 9-Day Break).
Does this calendar event in Korea translate into a measurable “lift” in hotel pricing in regional Kyushu cities and metropolitan Tokyo? If so, it would empirically support Aun Consulting’s argument about “routinized inbound travel,” “weekend Japan trips,” and “micro-trips.” If not, their analysis may be over-generalizing a limited phenomenon.
Daily ADR June 3–7: A Tale of Two Areas
First, we examine how daily ADR moved across the eight target areas during the 10-day window from Saturday May 30 to Monday June 8. The chart below makes visible both the natural Saturday lift and the holiday-period movement layered on top.
Source: MetroEngines Research, compiled by HotelBank Editorial Team
Notably, the single Saturday peak on June 6 marks the highest value in this two-week window for nearly every area. Fukuoka City hit ¥45,200, Shinjuku Ward ¥51,200, Minato Ward ¥64,200, Nagasaki City ¥35,800—all peaks for the survey period. This date is also the final weekend of Korea’s holiday, suggesting that pure Saturday demand was layered on top of “final-night-of-the-holiday” demand.
That said, Saturdays naturally carry a weekend premium, so this alone is not enough to attribute the lift purely to Korea’s holiday. The cleaner test, controlling for weekend bias, is “weekday vs. weekday.”
Holiday Weekdays vs. Ordinary June Weekdays: A Skewed Lift
We compared the daily average ADR for the holiday weekdays of Wednesday June 3, Thursday June 4, and Friday June 5 against the daily average for ordinary June weekdays (the Tuesday–Friday spans of June 9–12 and June 16–19). This is a clean weekday-to-weekday comparison that excludes Saturdays and Sundays.
Source: MetroEngines Research, compiled by HotelBank Editorial Team
The result shows a striking distribution. The largest lift was in Nagasaki City at +7.9%, followed by Sasebo City at +2.8% and Tsushima City at +0.9%. Meanwhile, Fukuoka City sat at -1.8% and Kitakyushu City at -2.7%—with holiday weekdays priced lower than ordinary weekdays. Even within Kyushu, sightseeing destinations and business cities moved in opposite directions.
The metropolitan Tokyo side was even clearer: Shinjuku Ward (home to Shin-Okubo) rose +9.6%, and Taito Ward (home to Ueno) +5.4%—both showing distinct upward moves. By contrast, Minato Ward (home to Akasaka) edged up only +1.2%. Even within metropolitan Tokyo, areas where Korean visitors stay and sightsee diverged sharply from business and luxury-accommodation hubs.
| Area | Holiday Weekday ADR | Ordinary Weekday ADR | ADR Diff | Sold-out Diff | Properties |
|---|---|---|---|---|---|
| Nagasaki City | ¥29,500 | ¥27,400 | +7.9% | +2.9pt | 56 |
| Sasebo City | ¥24,700 | ¥24,100 | +2.8% | +2.2pt | 32 |
| Tsushima City | ¥20,200 | ¥20,000 | +0.9% | +0.6pt | 12 |
| Fukuoka City | ¥28,700 | ¥29,200 | -1.8% | +1.3pt | 167 |
| Kitakyushu City | ¥18,900 | ¥19,400 | -2.7% | -3.4pt | 48 |
| Shinjuku Ward | ¥44,000 | ¥40,100 | +9.6% | +3.4pt | 83 |
| Taito Ward | ¥32,800 | ¥31,200 | +5.4% | +3.5pt | 123 |
| Minato Ward | ¥55,200 | ¥54,600 | +1.2% | +1.9pt | 99 |
Source: MetroEngines Research, compiled by HotelBank Editorial Team / N=620 properties
The sold-out ratio differences also deserve attention. The areas where the gap between holiday weekdays and ordinary weekdays moved most were Shinjuku Ward (+3.4pt), Taito Ward (+3.5pt), Nagasaki City (+2.9pt), and Sasebo City (+2.2pt). Conversely, Kitakyushu City was at -3.4pt—holiday weekdays actually had looser inventory. Price movements and sold-out movements line up consistently, confirming the demand skew from the supply side as well.
What Separates Areas That Caught the Lift From Those That Didn’t
Lining up the areas this way, two clear poles emerge: “destination/stay-type areas” that captured the lift, and “business/transit areas” that did not. Shinjuku Ward, Taito Ward, Nagasaki City, and Sasebo City are all places where staying overnight is itself a purpose of the trip. Fukuoka City and Kitakyushu City, on the other hand, are business hubs within Kyushu, and for Korean visitors they tend to function as transit points between Fukuoka Airport / Kokura and the Hakata–Tenjin hub.
Minato Ward’s modest lift fits the same logic. Akasaka does host a sizable Korean community, but room rates cluster around ¥55,000—outside the core range for holiday travelers—and the customer mix tilts toward business travelers and high-income individuals. Holiday tourists pour in at more accessible rate ranges where “sightseeing and street-walking” are integrated, namely Shinjuku and Ueno.
Tsushima City’s pattern is suggestive in a different way. Daily average ADR is stable around ¥20,000 and the holiday lift is just +0.9%. With only 12 sample properties and unique factors in current Korea–Tsushima ferry conditions, this is a market better evaluated by year-round occupancy stability than by price movements.
How Far Does Empirical Data Support the “Routinization” Thesis?
Aun Consulting’s report of February 13, 2026, characterizes Korean inbound travel as “an ultra-high-repeat market with over 90% repeat visitors,” “settled into a routine that feels closer to domestic travel than to overseas travel,” and “weekend Japan trips and purpose-driven micro-trips have become standard practice.” Korean visitors to Japan in 2025 totaled 9.45 million, up +7.3% (+640,000) year-on-year.
Our empirical data supports this thesis with caveats. It is true that during the short June 3–7 holiday, in metropolitan tourism centers where Korean inflows and stays are likely (Shinjuku, Ueno) and in Kyushu’s heritage destinations (Nagasaki, Sasebo), prices rose +5% to +10% over ordinary June weekdays. The supply side has clearly raised pricing for the holiday, and prices move precisely because demand is anticipated.
On the other hand, Fukuoka City—Korea’s main gateway—and its business backyard Kitakyushu show no holiday lift. The reading: even if “routinized inbound travel” and “micro-holiday demand” are real, the effect is clearly skewed to destinations. The intuitive notion that “Fukuoka grows because it’s the closest city to Korea” is not, at least, supported by movements in publicly listed prices.
In other words, the routinization of inbound travel is not the phenomenon of “Korean visitors casually going anywhere in Japan.” It is the phenomenon of “repeat visitors with a narrowed-down list of destinations returning frequently to specific sightseeing and experiential areas.” Aun Consulting’s own term “purpose-driven” precisely captures this skew.
Pre-Holiday Surge in the Sold-out Ratio
Reorganizing the sold-out ratio movements around the start and end of the holiday—against the backdrop of Korea-side departure timing—reveals another suggestive pattern. Below is the daily progression of sold-out ratios across the eight target areas.
Source: MetroEngines Research, compiled by HotelBank Editorial Team
If Korean visitors travel around the holiday, they would likely arrive in Japan on a Friday June 5 evening flight, stay through the weekend, and return on Sunday June 7 or Monday June 8. Indeed, Shinjuku Ward’s sold-out ratio rose to 36.6% on June 5 and 44.9% on June 6—1.7 times the level of ordinary June weekdays (25.8%). Nagasaki City and Sasebo City on June 6 were also 2–3 percentage points higher than the same weekday in ordinary weeks. The pattern reads as final-weekend holiday demand stacked on top of natural Saturday lift.
By contrast, Fukuoka City’s June 6 sold-out ratio of 39.7% is roughly on par with the ordinary weekend peak (June 13, 37.5%). This suggests Fukuoka is moving on “ordinary Saturday demand” rather than “Korean holiday surge.” As Kyushu’s gateway, its hub function paradoxically becomes a transit corridor, with overnight stays flowing instead to sightseeing destinations further south.
REIT Monthly Data Reinforces the Regional Divide
Monthly operational results also show temperature differences across regions. Looking at March 2026 results from major REITs holding properties in Kyushu and metropolitan Tokyo: Japan Hotel REIT Investment Corporation reported occupancy of 85.1% (+3.1pt YoY), ADR of about ¥20,800 (+5.0%), and RevPAR of about ¥17,700 (+9.0%)—growth on every front. Nippon Hotel & Residential Investment Corporation reported occupancy of 88.7%, ADR of about ¥30,900, and RevPAR of about ¥27,800, with its metropolitan-centric, high-rate portfolio steadily holding high levels.
Cross-referencing these transaction-based monthly operational results against listing-price-based daily OTA data reveals a two-tier structure: “macro: still inbound-led growth momentum” and “micro: specific holiday events generate skewed demand in specific areas.” On an annual scale, ADR rises; on a monthly scale, occupancy is thick; but on a daily scale, areas that capture the lift and areas that do not separate sharply. Revenue management’s unit of analysis is becoming ever more granular. For an analysis decomposing this regional ADR uplift by visitor nationality, see May 2026 Inbound Booking Trends: Western and Southeast Asian Travelers Lifting Regional ADR.
2026’s New Trend: Micro-Demand Moves Regional ADR
Drawing on this analysis, the contours of “micro-demand” in 2026 come into sharp focus. It is the phenomenon of small overseas holidays moving the listing prices of specific Japanese sightseeing destinations—limited in scope, but reliably. Nagasaki City’s +7.9% is far from negligible as a 3-to-5-day price lift. If this synchronizes with the Korean calendar multiple times a year, the implications for revenue management are significant.
Three points are worth flagging. First, the lift is skewed to destination/experiential areas. It barely reaches Kyushu’s gateway cities of Fukuoka and Kitakyushu, flowing instead to stay-destinations like Nagasaki and Sasebo. Second, micro-demand amplifies when combined with day of the week. On the holiday’s final Saturday (6/6), sold-out ratios exceed those of ordinary weekends as demand stacks layer-by-layer. Third, in metropolitan Tokyo too, the lift reaches sightseeing clusters (Shinjuku, Ueno) but barely touches business / high-rate areas (Akasaka). Even within “areas with many Korean visitors,” responses are not uniform.
The implication for operators is clear. By incorporating overseas holiday calendars into the characteristics of one’s own area, it becomes possible to capture multiple “small peaks” through the year. Korea’s local-election day, Memorial Day, Liberation Day, National Foundation Day, Hangul Day. Taiwan’s Peace Memorial Day, Qingming, Dragon Boat Festival, Ghost Festival. None of these dates appeared on the conventional Japanese revenue management calendar, yet they are real units around which the ultra-high-repeat short-haul Asian market plans itineraries. We have run similar verification on the China side; for how the May Labour Day holiday moved Japanese hotel pricing even amid an inbound downturn, see China’s Labour Day 5/1–5/5 Holiday: Will “Labour Day Bookings” Rise Despite -60% Inbound? An OTA-Price Verification.
2026 will be a year in which demand forecasting that incorporates these overseas micro-holidays by area becomes a differentiator. Watching only the traditional big peaks—Golden Week, Obon, year-end / New Year—means missing the dozen-plus “small peaks of a few days each” that occur every year. The data already shows: those small peaks are reliably observable in regional sightseeing destinations.
Summary
Using Korea’s June 3–7, 2026 holiday as a hook, we analyzed the listing prices and sold-out ratios of 620 properties across five Kyushu areas and three metropolitan Tokyo areas. Aun Consulting’s “routinization of inbound travel” and “normalization of micro-trips” theses were empirically supported with caveats. Holiday-weekday ADR lifts were clearly observed in destination/experiential areas: Nagasaki City +7.9%, Shinjuku Ward +9.6%, Taito Ward +5.4%.
By contrast, Fukuoka City, Kitakyushu City, and Minato Ward showed essentially no response or slight negatives, demonstrating that the lift effect depends strongly on area characteristics. Lift to regional cities does exist, but it concentrates not on “the closest city to Korean visitors” but on “the destinations where Korean visitors want to stay.”
Revenue management in 2026 has entered a phase of reading overseas micro-holiday calendars in conjunction with each area’s tourism potential. Whether one can visualize this “micro-demand” feeds directly into ADR.
⚠ Note on Future-Date ADR: The ADR figures in this article represent the average of listing prices on OTAs at the time of survey, and they fluctuate as check-in dates approach. Prices set high now may drop with last-minute discounts, while those set low now may be raised. Please use this data with that caveat in mind.
Related Reading
- China’s Labour Day 5/1–5/5 Holiday: Will “Labour Day Bookings” Rise Despite -60% Inbound? An OTA-Price Verification
- Tokyo, Nagoya, Osaka, Fukuoka — Weekday ADR Deep-Dive: Visualizing the Recovery of Business Demand
- Osaka Expo’s Impact on Hotel ADR: Verified with REIT and OTA Data
- Silver Week 2026 — First in 11 Years: ADR Analysis and Booking Curve Reading the Pricing Strategy of the 9-Day Break
- Hotels Around Hydrangea Sightseeing Spots: ADR Analysis of the Hidden High-Rate Window of the Rainy Season
- May 2026 Inbound Booking Trends: Western and Southeast Asian Travelers Lifting Regional ADR
External references: Aun Consulting, “2025 Annual Inbound Trends and 2026 Outlook” / Japan Tourism Agency, “Overnight Travel Statistics Survey” / JNTO, “Japan Tourism Statistics Data”