

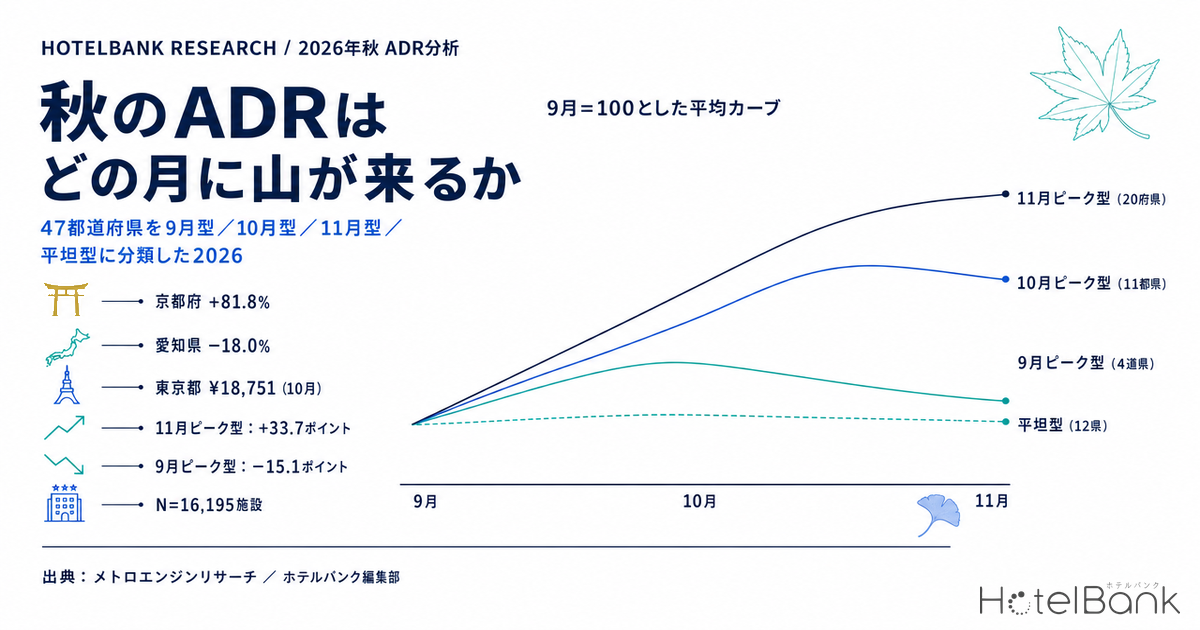
Autumn lodging demand in Japan tends to be discussed as a single block spanning September, October and November — but the month in which room rates actually peak differs sharply from prefecture to prefecture. We pulled MetroEngines Research estimated settled ADR for all 47 prefectures and classified each one by which of September, October and November 2026 carries its highest rate, producing four patterns: September-peak, October-peak, November-peak and Flat. The result: 20 prefectures are November-peak, 12 are Flat, 11 are October-peak and 4 are September-peak. Within the same “autumn selling season,” the deadline for early-bird rates and the pace at which inventory is released need to be shifted by one to two months depending on the prefecture.
Metric Definitions Used in This Article
- ADR (average daily rate): an estimated settled rate (tax-exclusive equivalent) derived by applying category-specific adjustment coefficients to the lowest publicly listed plan rate each property publishes on booking channels (double occupancy, per-room, tax-inclusive). Cross-checked against property-level results disclosed by listed hotel REITs, the median error is approximately 7%. These are estimates and differ from each property’s actual transacted rates or accounting figures. Area-level ADR is the median across the target properties — the level of a typical property in that area.
- Peak month: the highest of the September, October and November 2026 estimated settled ADR figures. Prefectures where the gap between the three-month maximum and minimum is under 3% are treated separately as “Flat.”
- Properties (N): the number of properties included in the estimated settled ADR calculation, covering the verified categories of business hotel, city hotel, resort, ryokan and capsule.
- Data source: MetroEngines Research
- — 20 prefectures November-peak, 12 Flat, 11 October-peak, 4 September-peak — “autumn really means November” holds for just over 40% of the country.
- — Kyoto rises +81.8% from September to November, the largest gain nationwide. Others move the opposite way — Aichi -18.0% and Hokkaido -17.9% — leaving a spread of roughly 100 points between top and bottom.
- — Peak months split by category within the same prefecture — in Aichi, business hotels peak in September (-20.4%, N=299 properties) while ryokan peak in November (+4.7%, N=133 properties), exactly opposite directions.
- — The classification is sensitive to the November level. A uniform -2% shift in November estimated settled ADR is enough to make October-peak the most common pattern; at +2%, November-peak expands from 20 to 30 prefectures.
- — All three months are forward-looking estimates. November covers about 12% fewer properties than September (16,195 to 14,288), so both levels and curve shapes can move as more listings appear.
Defining the Four Patterns — Autumn Curves Converge on Four Shapes
The classification rule is simple. We lined up the estimated settled ADR for September, October and November 2026 and designated the month carrying the highest figure as that prefecture’s peak month. Prefectures where the three-month swing — the gap between maximum and minimum — is under 3% are separated out as “Flat,” on the basis that there is no meaningful month-to-month difference in level. The dataset covers 16,195 properties as of September (47 prefectures combined; 14,288 in November), and every figure is a forward-month estimate based on listing conditions at the time of the survey.
Plotting average curves for representative prefectures in each pattern, indexed to September = 100, makes the differences in shape unmistakable. November-peak prefectures build up +33.7 points from September to November, while September-peak prefectures erode in the opposite direction by -15.1 points. October-peak prefectures show a plateau: the level steps up in October and is then largely held through November. Flat prefectures stay within ±1 point across all three months.
Source: MetroEngines Research; compiled by the HotelBank Editorial Team
What matters here is that the four patterns are not merely a way of slicing numbers — they mark when the pricing battle is actually fought. In a November-peak prefecture, September is a run-up and the revenue peak concentrates into three weeks in November. In a September-peak prefecture the reverse holds: how much you capture in September determines the whole autumn. Even within the same national chain, there is no reason for a property in a November-peak prefecture and one in a September-peak prefecture to set their early-bird cut-off on the same date.
National Map — November-Peak Clusters in Western and Pacific-Side Japan; September-Peak Is Scattered Across Hokkaido, Okinawa and the Chukyo Region
Colour-coding the 47 prefectures by pattern on a map reveals a geographic skew. November-peak prefectures (20) are concentrated in the Kansai region — Kyoto, Nara, Hyogo and Osaka — in northern Kyushu with Fukuoka, Saga and Oita, and across the San’in and San’yo areas with Shimane, Tottori and Hiroshima. September-peak prefectures (4), by contrast, are not clustered in the north: they are scattered across four regions of quite different character — Hokkaido, Okinawa, Aichi and Mie. October-peak prefectures (11) mix inland areas where autumn foliage arrives early, such as Tochigi, Gifu and Aomori, with the Tokyo metropolitan area.
Source: MetroEngines Research; compiled by the HotelBank Editorial Team
All 47 Prefectures — Estimated Settled ADR and Property Counts for September, October and November
The table below lists estimated settled ADR, pattern, the September-to-November rate of change and monthly property counts for all 47 prefectures, with the peak-month cell shaded. Property counts fall from 16,195 to 14,288 nationwide between September and November, a decline of about 12%, because listings for more distant months are not yet fully posted. Prefecture by prefecture, no prefecture’s three-month counts drop below 60% of its median, so all three months remain comparable on a like-for-like basis in every prefecture.
| Prefecture | Pattern | Sep ADR | Oct ADR | Nov ADR | Peak | Sep→Nov | Properties Sep/Oct/Nov |
|---|---|---|---|---|---|---|---|
| Hokkaido | September-peak | ¥13,968 | ¥12,614 | ¥11,461 | Sep | -17.9% | 890 / 846 / 773 |
| Aomori | October-peak | ¥12,663 | ¥15,026 | ¥10,812 | Oct | -14.6% | 173 / 162 / 154 |
| Iwate | October-peak | ¥10,165 | ¥10,307 | ¥9,775 | Oct | -3.8% | 240 / 230 / 218 |
| Miyagi | October-peak | ¥12,004 | ¥12,300 | ¥11,931 | Oct | -0.6% | 286 / 276 / 265 |
| Akita | October-peak | ¥12,376 | ¥12,430 | ¥11,894 | Oct | -3.9% | 166 / 156 / 143 |
| Yamagata | October-peak | ¥12,768 | ¥12,894 | ¥12,430 | Oct | -2.6% | 270 / 250 / 224 |
| Fukushima | Flat | ¥11,018 | ¥10,839 | ¥10,970 | — | -0.4% | 400 / 366 / 334 |
| Ibaraki | October-peak | ¥9,863 | ¥10,520 | ¥10,476 | Oct | +6.2% | 293 / 270 / 255 |
| Tochigi | October-peak | ¥12,407 | ¥13,976 | ¥13,951 | Oct | +12.4% | 374 / 348 / 325 |
| Gunma | Flat | ¥13,834 | ¥13,976 | ¥13,814 | — | -0.1% | 414 / 385 / 331 |
| Saitama | Flat | ¥10,613 | ¥10,812 | ¥10,718 | — | +1.0% | 205 / 196 / 182 |
| Chiba | Flat | ¥12,228 | ¥12,204 | ¥12,513 | — | +2.3% | 392 / 369 / 339 |
| Tokyo | October-peak | ¥14,867 | ¥18,751 | ¥18,734 | Oct | +26.0% | 1,093 / 1,046 / 1,009 |
| Kanagawa | November-peak | ¥15,456 | ¥16,079 | ¥16,322 | Nov | +5.6% | 548 / 513 / 479 |
| Niigata | Flat | ¥12,224 | ¥12,220 | ¥12,064 | — | -1.3% | 391 / 368 / 340 |
| Toyama | October-peak | ¥11,516 | ¥11,558 | ¥11,210 | Oct | -2.7% | 159 / 152 / 141 |
| Ishikawa | November-peak | ¥13,621 | ¥14,542 | ¥14,771 | Nov | +8.4% | 235 / 223 / 219 |
| Fukui | November-peak | ¥11,886 | ¥12,262 | ¥13,759 | Nov | +15.8% | 205 / 184 / 164 |
| Yamanashi | November-peak | ¥13,514 | ¥13,761 | ¥14,194 | Nov | +5.0% | 282 / 263 / 233 |
| Nagano | Flat | ¥14,048 | ¥14,375 | ¥14,047 | — | -0.0% | 762 / 725 / 663 |
| Gifu | October-peak | ¥13,556 | ¥14,923 | ¥14,854 | Oct | +9.6% | 363 / 331 / 302 |
| Shizuoka | November-peak | ¥13,706 | ¥13,516 | ¥14,095 | Nov | +2.8% | 829 / 774 / 707 |
| Aichi | September-peak | ¥14,044 | ¥13,238 | ¥11,510 | Sep | -18.0% | 476 / 452 / 418 |
| Mie | September-peak | ¥13,121 | ¥12,814 | ¥12,728 | Sep | -3.0% | 342 / 311 / 285 |
| Shiga | November-peak | ¥11,167 | ¥11,390 | ¥12,454 | Nov | +11.5% | 149 / 138 / 129 |
| Kyoto | November-peak | ¥14,158 | ¥21,478 | ¥25,743 | Nov | +81.8% | 566 / 543 / 515 |
| Osaka | November-peak | ¥10,097 | ¥11,609 | ¥11,762 | Nov | +16.5% | 630 / 612 / 598 |
| Hyogo | November-peak | ¥13,786 | ¥14,486 | ¥15,510 | Nov | +12.5% | 518 / 500 / 461 |
| Nara | November-peak | ¥13,114 | ¥15,847 | ¥17,808 | Nov | +35.8% | 128 / 120 / 112 |
| Wakayama | November-peak | ¥11,096 | ¥11,333 | ¥11,927 | Nov | +7.5% | 206 / 193 / 178 |
| Tottori | November-peak | ¥10,744 | ¥11,105 | ¥11,586 | Nov | +7.8% | 140 / 130 / 116 |
| Shimane | November-peak | ¥12,995 | ¥13,656 | ¥14,896 | Nov | +14.6% | 169 / 163 / 156 |
| Okayama | Flat | ¥11,400 | ¥11,471 | ¥11,599 | — | +1.7% | 181 / 174 / 160 |
| Hiroshima | November-peak | ¥11,937 | ¥12,275 | ¥12,610 | Nov | +5.6% | 284 / 263 / 248 |
| Yamaguchi | November-peak | ¥10,537 | ¥10,833 | ¥10,984 | Nov | +4.2% | 189 / 181 / 174 |
| Tokushima | November-peak | ¥9,341 | ¥9,638 | ¥9,798 | Nov | +4.9% | 128 / 116 / 99 |
| Kagawa | Flat | ¥10,576 | ¥10,612 | ¥10,537 | — | -0.4% | 156 / 149 / 138 |
| Ehime | Flat | ¥9,761 | ¥9,934 | ¥10,049 | — | +3.0% | 201 / 191 / 183 |
| Kochi | November-peak | ¥10,586 | ¥11,378 | ¥11,661 | Nov | +10.2% | 114 / 108 / 99 |
| Fukuoka | November-peak | ¥13,089 | ¥14,662 | ¥14,890 | Nov | +13.8% | 457 / 447 / 430 |
| Saga | November-peak | ¥14,091 | ¥14,478 | ¥15,762 | Nov | +11.9% | 151 / 142 / 136 |
| Nagasaki | October-peak | ¥10,833 | ¥11,741 | ¥11,179 | Oct | +3.2% | 247 / 234 / 217 |
| Kumamoto | Flat | ¥13,213 | ¥12,991 | ¥13,038 | — | -1.3% | 384 / 365 / 339 |
| Oita | November-peak | ¥15,266 | ¥16,586 | ¥16,782 | Nov | +9.9% | 446 / 422 / 394 |
| Miyazaki | Flat | ¥9,803 | ¥9,810 | ¥9,862 | — | +0.6% | 157 / 148 / 136 |
| Kagoshima | Flat | ¥9,717 | ¥9,539 | ¥9,753 | — | +0.4% | 305 / 299 / 281 |
| Okinawa | September-peak | ¥12,863 | ¥12,586 | ¥11,667 | Sep | -9.3% | 501 / 495 / 486 |
Source: MetroEngines Research; compiled by the HotelBank Editorial Team
Demand Drivers by Pattern (Hypotheses)
What follows are hypotheses drawn from the shape of the data, not established causal explanations. Reading the calendar factors alongside the event factors offers a way to judge which pattern your own property’s monthly curve most resembles.
September-peak (Hokkaido, Aichi, Okinawa, Mie) — September 2026 is the first year in eleven that Silver Week forms a full five-day holiday run, from Saturday 19 September through Wednesday 23 September. In resort destinations where summer demand still lingers, that five-day run is very likely pulling demand toward the September side. Hokkaido falls -17.9%, from ¥13,968 in September to ¥11,461 in November, and Okinawa -9.3%, from ¥12,863 to ¥11,667; both decline as autumn progresses. Aichi shows the steepest decay in the country at -18.0%, from ¥14,044 in September to ¥11,510 in November. The prefecture is scheduled to host the Asian Games from 19 September to 4 October, and the fact that the first half of the event falls inside September may be lifting the September level. We have not, however, isolated and tested the effect of the games themselves — this remains an inference from the overlap in dates.
October-peak (Tokyo, Tochigi, Gifu, Aomori and 11 prefectures in total) — October carries a three-day weekend from Saturday 10 October through Monday 12 October (Sports Day), and it is when autumn foliage begins inland. Tochigi jumps sharply in October, from ¥12,407 in September to ¥13,976 (+12.6%), then holds nearly the same level in November at ¥13,951. Aomori spikes to ¥15,026 in October, +18.7% against September, before falling back to ¥10,812 in November — a shape consistent with the regional characteristic that foliage season at Towada and Oirase concentrates in mid-to-late October. Tokyo is all but tied between the two months, ¥18,751 in October and ¥18,734 in November (a 0.1% difference), so in practice it reads more accurately as a twin-peak plateau across October and November.
November-peak (Kyoto, Nara, Fukuoka, Kanagawa and 20 prefectures in total) — the largest group, mixing regions where foliage peaks in mid-to-late November with cities where the autumn conference and exhibition season overlaps. Kyoto posts by far the largest gain in the country, +81.8%, from ¥14,158 in September to ¥25,743 in November. Nara follows at +35.8%, pointing to a structure in which Kansai foliage demand concentrates almost entirely into November. On the urban side, Fukuoka is +13.8%, Osaka +16.5% and Kanagawa +5.6%. November does contain a three-day weekend from Saturday 21 November through Monday 23 November (Labour Thanksgiving Day), but the size of these gains cannot be explained by the holiday alone, and weekday demand is likely contributing to the lift.
Flat (Nagano, Chiba, Gunma and 12 prefectures in total) — prefectures whose three-month swing stays under 3%. Nagano runs ¥14,048 in September, ¥14,375 in October and ¥14,047 in November: there is a slight rise in October, but the swing is only 2.3%. In prefectures with large elevation differences, foliage season is spread over a long window, from the alpine zone in late September down to the foothills in November, so the prefecture-wide monthly average tends to even out. Gunma, Fukushima and Niigata share the same structure. In Chiba and Saitama, year-round stability in urban and theme-park demand is the likely reason for the uniform curve.
Swing Rankings — Top 10 Gains and Top 10 Declines
Ranking by rate of change from September to November, the top of the table runs Kyoto +81.8%, Nara +35.8% and Tokyo +26.0%. The bottom runs Aichi -18.0%, Hokkaido -17.9%, Aomori -14.6% and Okinawa -9.3%. The gap between top and bottom reaches roughly 100 points, showing that the general assumption that “autumn is the season when rates rise” does not hold uniformly across the country. Within-month dispersion — how much rates move from one day to the next inside the same month — is examined from a daily-range perspective in Japan Autumn 2026 Hotel Price Range: 3.3x CV Gap Across 47 Prefectures.
Source: MetroEngines Research; compiled by the HotelBank Editorial Team
The presence of Tohoku and Hokkaido among the steepest declines likely reflects a seasonal structure: the shoulder period before the snow season begins. Akita at -3.9%, Iwate at -3.8% and Yamagata at -2.6% are all modestly negative, and in these prefectures autumn needs to be planned with December onward — when the ski season starts — in view. This article’s analysis window, however, extends only to November 2026, within five months of the survey date; listings for December and beyond are not yet sufficiently posted and are therefore out of scope here.
Peak Months Differ by Category Within the Same Prefecture
A prefecture-level pattern describes the movement of a typical property in that prefecture, but splitting by category frequently reveals conflicting peak months inside the same prefecture. The chart below shows the September-to-November rate of change across four categories — business hotel, city hotel, resort and ryokan — for eight major prefectures.
Source: MetroEngines Research; compiled by the HotelBank Editorial Team
Aichi is the standout case. The prefecture as a whole is September-peak (-18.0%), but that shape arises because business hotels (-20.4%, N=299 properties) account for the bulk of the mix; take the ryokan segment alone and it moves in exactly the opposite direction, peaking in November (+4.7%, N=133 properties). Within a single prefecture, urban business properties are looking at September demand while hot-spring ryokan are looking at November foliage demand.
Okinawa splits by category in much the same way. Resorts peak in September and fall steeply at -14.3% (N=276 properties), while business hotels are nearly flat at -1.8% (N=191 properties) and city hotels peak in October at +2.0% (N=14 properties). The prefecture’s September-peak face is simply the shape of its resort segment showing through as the shape of the prefecture.
Conversely, some prefectures point the same way across every category. In Kyoto, business hotels are +96.9%, city hotels +78.9%, ryokan +47.2% and resorts +14.3% — all four peak in November. Fukuoka likewise aligns on a November peak across all four categories. In prefectures like these, rates across the whole market move at the same time regardless of category, so competitors’ price movements tend to be synchronised as well.
| Prefecture | Prefecture-wide pattern | Business | City | Resort | Ryokan |
|---|---|---|---|---|---|
| Hokkaido | September-peak | Sep -20.3% / N=391 | Sep -20.9% / N=75 | Sep -10.6% / N=144 | Sep -8.7% / N=276 |
| Aichi | September-peak | Sep -20.4% / N=299 | Oct -8.2% / N=30 | Flat +0.4% / N=11 | Nov +4.7% / N=133 |
| Okinawa | September-peak | Flat -1.8% / N=191 | Oct +2.0% / N=14 | Sep -14.3% / N=276 | Flat -1.5% / N=17 |
| Nagano | Flat | Oct -2.8% / N=156 | Oct -4.7% / N=16 | Oct -2.4% / N=114 | Flat +2.0% / N=476 |
| Tokyo | October-peak | Nov +27.1% / N=890 | Oct +26.7% / N=106 | Nov +4.9% / N=21 | Oct +3.8% / N=49 |
| Osaka | November-peak | Nov +16.3% / N=487 | Oct +11.2% / N=97 | Oct -1.3% / N=6 | Oct +37.8% / N=35 |
| Fukuoka | November-peak | Nov +15.1% / N=330 | Nov +9.2% / N=40 | Nov +1.6% / N=14 | Nov +6.7% / N=69 |
| Kyoto | November-peak | Nov +96.9% / N=311 | Nov +78.9% / N=58 | Nov +14.3% / N=13 | Nov +47.2% / N=181 |
Each cell: peak month / September-to-November rate of change / property count as of September. Source: MetroEngines Research; compiled by the HotelBank Editorial Team
We have confirmed that a property-count-weighted average of the four category-level estimated settled ADR figures produces a curve whose shape matches the prefecture-wide figure. In Kyoto, for example, the weighted value runs ¥15,561 in September to ¥26,712 in November against a prefecture-wide ¥14,158 to ¥25,743 — different levels, but both peaking in November. Because the unfiltered aggregate and the category-level aggregates cover different sets of properties, these should be read as a comparison of shape rather than a direct comparison of levels.
Practical Takeaways — An Autumn Revenue Management Calendar by Pattern
When the peak month differs, so do the early-bird cut-off, the pace of inventory release and the timing of promotions on booking channels. The table below condenses a September-to-November design approach for each pattern onto a single page. These are general principles derived from the shape of the overall market, and are meant to be adjusted against your own property’s booking pace.
| Pattern | September | October | November |
|---|---|---|---|
| September-peak 4 prefectures |
The peak. Lock in high-rate allocations across the five-day holiday run early and design so that no room is left for last-minute discounting. Extend summer peak-season inventory control straight through. | A declining phase. Soften the drop in rate with value-added multi-night and extended-stay plans. | Close to the trough. Bring winter advance sales forward and use November vacancy as the entry point for capturing winter early-bird bookings. |
| October-peak 11 prefectures |
The run-up. Close early-bird rates for the October three-day weekend by early September, then leave room to raise prices in stages. | The peak. Dual demand from the three-day weekend and the start of foliage season. Release inventory from mid-October in small increments and step prices up accordingly. | The back half of the plateau. October levels tend to hold, so carry October pricing through rather than cutting it lightly. |
| November-peak 20 prefectures |
The lowest month. Treat it as a month for building occupancy and set up funnels into November’s high-rate allocations, such as multi-night and repeat-guest benefits. | Mid-climb. Set the November early-bird cut-off for mid-October, then switch to staged increases. | The peak. One of the strongest revenue opportunities of the year. Release inventory for peak-foliage weeks in small increments right to the end, and consider setting a minimum length of stay. |
| Flat 12 prefectures |
With no monthly peak, design by day of week and by event rather than by month. Price consistency across the three months is what tells in competitive comparison. | As at left. Focus on designing the gap between holiday weeks and weekdays. | As at left. There is upside in developing long-stay and weekday demand. |
Source: MetroEngines Research; compiled by the HotelBank Editorial Team
Robustness of the Classification — Sensitivity to the Threshold and to the November Level
The four patterns rest on two judgement calls: the swing threshold used to carve out “Flat” (3% in this article), and the level of November estimated settled ADR itself. As noted above, November covers about 12% fewer properties than September, so its level can move as listings fill in. Using the 47-prefecture figures from the table above exactly as they stand, we recalculated how far the distribution of patterns shifts when these two inputs are varied. Everything below is a reclassification of the data presented in this article; no new measured values are introduced.
| Threshold scenario | September-peak | October-peak | November-peak | Flat | Most common |
|---|---|---|---|---|---|
| Strict (1.5%) | 6 | 13 | 24 | 4 | November-peak |
| Base (3.0%) | 4 | 11 | 20 | 12 | November-peak |
| Loose (5.0%) | 3 | 7 | 17 | 20 | Flat |
Source: MetroEngines Research; compiled by the HotelBank Editorial Team
Tightening the threshold to 1.5% cuts Flat from 12 prefectures to 4, most of which are absorbed into November-peak (20 to 24). Loosening it to 5.0% swells Flat to 20 prefectures, overtaking November-peak (17) and changing which pattern is most common. Up to 4.0%, however, November-peak retains the top position, so the conclusion that November-peak is the most common pattern is reasonably robust to the choice of threshold.
| Threshold \ Nov adjustment | -4% | -2% | +0% | +2% | +4% |
|---|---|---|---|---|---|
| 1.0% | 9 | 13 | 24 | 34 | 40 |
| 2.0% | 9 | 13 | 23 | 32 | 38 |
| 3.0% | 9 | 11 | 20 | 30 | 37 |
| 4.0% | 7 | 10 | 20 | 27 | 32 |
| 5.0% | 7 | 10 | 17 | 25 | 30 |
Source: MetroEngines Research; compiled by the HotelBank Editorial Team
It is the horizontal axis that really governs the conclusion. Holding the threshold at 3%, a uniform +2% shift in November estimated settled ADR raises November-peak from 20 prefectures to 30; at +4% it reaches 37, roughly 80% of the country. In the other direction, -2% drops it to 11 and hands the most-common position to October-peak (19). At -4% the gap widens further: October-peak stands at 24 against just 9 for November-peak. A shift of only a few percent changes the national picture of which month carries the autumn peak. Whether November is the real event is therefore not a settled fact but a provisional shape, contingent on how listings fill in. In planning your own autumn, the realistic approach is to treat the prefecture’s pattern as provisional rather than fixed, and to prepare inventory and pricing plans for both an upside and a downside November.
Conclusion
Lining up estimated settled ADR for autumn 2026 across all 47 prefectures yields 20 November-peak, 12 Flat, 11 October-peak and 4 September-peak. November-peak is the largest group, but at just over 40% of the country the remaining nearly 60% either peak in September or October or have no peak at all. Building a single nationwide calendar on the assumption that autumn really means November would miss the peak in more than half of Japan’s prefectures.
The prefecture-level picture also changes once categories are separated. Internal divergence is common: Aichi is September-peak overall yet November-peak for ryokan alone, and in Okinawa only resorts peak in September while other categories are flat. In planning your own property, there is room to take the prefecture’s pattern as a starting point and then go further, checking which month competitors in the same category and price band build their peak.
Finally, September through November are all forward months, and the figures are estimates based on listing conditions at the time of the survey. November in particular covers about 12% fewer properties than September, so both levels and shapes may move as further listings appear. Tracking the change in shape at fixed intervals will also reveal whether any prefectures shift from one pattern to another.
⚠ Note on ADR for future dates: The estimated settled ADR in this article is based on rates publicly listed on booking channels as of the survey date (early August 2026) and will shift as check-in approaches, through the addition of new plans and price adjustments. September, October and November are all future months, so present levels are not final figures. November in particular covers about 12% fewer properties than September, and both levels and curve shapes may change as further listings are posted.
Related Reading
- Japan Autumn 2026 Hotel Price Range: 3.3x CV Gap Across 47 Prefectures
- 493 Medical Conferences in Japan: 75.7% of Nights Fall Wed-Fri
- Double Ten x Sports Day: Japan’s Oct 9-12 Capacity at 76 Days Out
- Shichi-Go-San Weekend: 22 Private-Dining Ryokan, ¥57,500 vs ¥71,000
- Fiscal Half-End Weekday Demand? 5 Business Cities Show No Lift
- Yamaguchi DC 2026: Hagi ADR +39.6% vs Yamaguchi City +3.1%
References and Sources
■ Data sources
Prefecture-level estimated settled ADR from MetroEngines Research was collected for all 47 prefectures across three months — September, October and November 2026. Property counts are 16,195 as of September, 15,329 as of October and 14,288 as of November. The category breakdown comprises four segments: business hotel, city hotel, resort and ryokan. Calendar and event dates are drawn from the published sources listed under “Calendar and events” below.
■ Calculation assumptions
The peak month is the month carrying the highest of the September, October and November estimated settled ADR figures; prefectures where the gap between the three-month maximum and minimum is under 3% of the minimum are treated separately as “Flat.” Rates of change are November against a September base. The sensitivity testing in the robustness section varies the flat-classification threshold across a 1.0-5.0% range and applies uniform adjustments of -4% to +4% to November estimated settled ADR, then reapplies the same classification rule. It is a reclassification using only the 47-prefecture figures presented in this article; no new measured values or forecasting models are used.
■ Limitations and caveats
September through November 2026 are all future months, and the figures are estimates based on listing conditions at the time of the survey (early August 2026). Property counts fall by about 12% nationwide between September and November, so both levels and shapes may vary as listings fill in. Statements about demand drivers are hypotheses derived from the shape of the monthly curves; the contribution of individual factors has not been isolated and tested. A prefecture-level pattern represents the level of a typical property in that prefecture and does not indicate optimal pricing for any individual property.
■ Market data
- MetroEngines Research — prefecture-level estimated settled ADR (September-November 2026, 47 prefectures, N=16,195 properties as of September / N=14,288 as of November) and category-level estimated settled ADR (business hotel, city hotel, resort, ryokan)
■ Calendar and events
- 2026 Asian Games (Aichi-Nagoya, 19 September – 4 October 2026)
- City of Nagoya city-promotion site: “The Asian Games and Asian Para Games will be held in Aichi-Nagoya”
- Public holiday calendar for Silver Week 2026 (the five-day run from 19 to 23 September)
- Japan Tourism Agency, Overnight Travel Statistics Survey
- Japan National Tourism Organization (JNTO), Foreign Visitor Statistics