

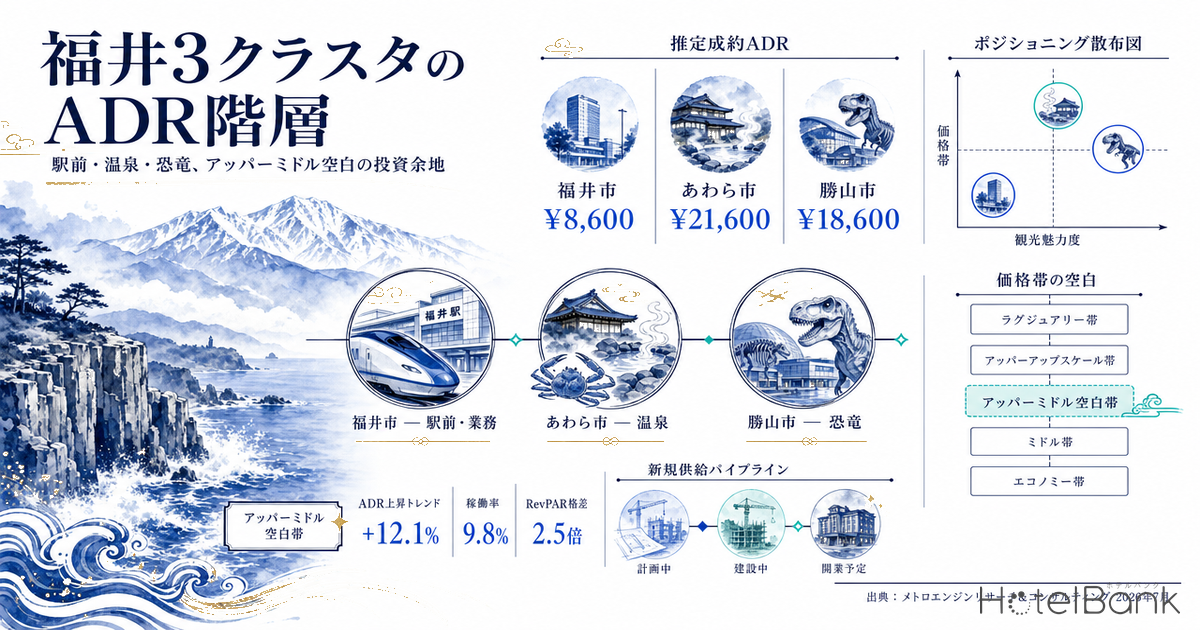
More than two years have passed since the Hokuriku Shinkansen was extended to Tsuruga. Fukui’s accommodation market tends to be discussed under the single blanket phrase “the Shinkansen effect,” but when MetroEngines Research data is broken down to the municipal level, three demand cores with completely different characteristics become visible, coexisting within the same prefecture: Fukui City, which carries business demand and station-front Shinkansen demand; Awara City, a long-established cluster of hot spring ryokan; and Katsuyama City, which depends on a single tourism core — the Dinosaur Museum. This article tracks the estimated settled ADR hierarchy of these three clusters on a monthly basis and quantifies where the price-band whitespace remains.
Metric Definitions Used in This Article
- ADR (Average Daily Rate): An estimated settled rate (tax-exclusive equivalent) calculated by applying category-specific adjustment coefficients to the lowest published plan level each property lists on OTAs and other channels (double occupancy, per-room rate, tax-inclusive). Cross-checked against property-level actuals disclosed by listed hotel REITs (91 properties, most recent 3 months), the median error is approximately 7%. These are estimates and differ from each property’s actual transaction prices or accounting figures. Area-level ADR is the monthly average of the median for the covered properties (the level of a typical property in that area).
- Published price: The average of all plans listed on OTAs and other channels (double occupancy, per-room rate, tax-inclusive). Used only where this article explicitly states “published price,” and distinguished from ADR.
- Coverage: MetroEngines Research tracks approximately 168,000 properties in Japan, of which approximately 27,000 properties and 1.26 million rooms with confirmed OTA activity are included in the analysis. Ryokan, minshuku, and simple lodging businesses not listed on OTAs are excluded. In Fukui, 308–359 properties were confirmed listed per month, of which 206–216 properties fall within the scope of estimated settled ADR calculation (the verified business hotel, city hotel, resort, ryokan, and capsule categories).
- Data source: MetroEngines Research & Consulting
- — Within a single prefecture, Fukui’s estimated settled ADR is stratified by a factor of 2.5. Trailing 12-month averages are approximately ¥8,600 for Fukui City (N=35–38 properties), approximately ¥18,600 for Katsuyama City (N=4–5 properties), and approximately ¥21,600 for Awara City (N=21–22 properties). The single prefectural average of ¥11,600 conceals the mixed structure of three distinct markets.
- — The effect of the Shinkansen extension is concentrated at the station front. Against the 2023 average, Fukui City is up 12.1%, while Awara City is up just 1.4% — essentially flat. The benefit of transport infrastructure flows into station-front rates but does not reach the rates of hot spring districts farther away.
- — The largest whitespace is the above-¥14,000 band in front of Fukui Station. Of the 2,746 rooms within a 2 km radius, only 2 properties and 269 rooms (9.8%) sit in that band, and only one property effectively offers a 100-room-class upper-mid product.
- — The supply pipeline, once deduplicated, amounts to a single project of roughly 170 rooms. Candeo Hotels Fukui, reported in the press as “a separate project of approximately 120 rooms,” is the same property as the hotel tower of the Minamidori district redevelopment. The above-¥14,000 band therefore grows only from 269 rooms to approximately 440 rooms (+63%).
- — On feasibility, the select-service upper-tier model is the most robust. At 120 rooms, an ADR of ¥18,000 and 75% occupancy, the GOP yield is 9.3%, and it holds at 7.8% even in the combined case of a 10% ADR decline and a 5-point occupancy decline (simplified estimate).
Executive Summary — A 2.5x Price Hierarchy Within One Prefecture
According to MetroEngines Research data, average estimated settled ADR over the trailing 12 months (July 2025 to June 2026) was approximately ¥8,600 in Fukui City, approximately ¥21,600 in Awara City, and approximately ¥18,600 in Katsuyama City. Within the same prefecture, Awara City runs roughly 2.5 times Fukui City and Katsuyama City roughly 2.2 times, forming a clear price hierarchy (see also our four-city ADR comparison of Fukui, Tsuruga, Komatsu and Kanazawa). Fukui Prefecture’s overall estimated settled ADR is approximately ¥11,600 — and looking only at that single prefectural figure hides the fact that three markets of genuinely different character are mixed together.
Growth has been equally uneven. Compared with the 2023 average — the year before the Hokuriku Shinkansen extension to Tsuruga (March 16, 2024) — Fukui City clearly stepped up by 12.1%, while Awara City rose only 1.4%, essentially flat. The benefit of Shinkansen transport infrastructure is working on room rates in front of the station, but it is not reaching rates in hot spring districts away from the station directly. This is precisely why different levers are required in different areas.
Monthly ADR Hierarchy Across the Three Clusters — Entirely Different Seasonal Shapes
* For 2026, only the confirmed basis for January–June is shown. July onward is an estimate based on currently published rate levels and is excluded from seasonal comparison.
Placing the two charts side by side reveals that the shape of seasonality is entirely different. Apart from a single peak in August, Fukui City is nearly flat throughout the year, with monthly swings contained within roughly ¥7,700 to ¥9,900. This is a textbook business-demand rate profile, and it suggests a structure in which weekday occupancy forms the foundation of price formation.
Awara City, by contrast, builds a clear peak from December through February. This is a seasonal structure in which the winter food demand common to Hokuriku hot spring districts (centered on Echizen crab) pushes rates up: estimated settled ADR in December 2025 reached approximately ¥28,600, roughly 1.6 times the approximately ¥17,900 recorded in June of the same year. Rather than smoothing occupancy across the year, this is the ryokan model of concentrating rate into specific seasons to generate revenue — and it shows up directly in the price data.
Viewed by annual average, the ranking of the hierarchy itself has not moved across the four years. Awara City at the top, Katsuyama City in the middle and Fukui City at the bottom is a fixed structure; what changes is the rate of growth within each tier. Most notable is Fukui City’s consistent climb, stepping up roughly 12% from approximately ¥7,700 in 2023 to approximately ¥8,600 over the trailing 12 months.
On data precision for Katsuyama City: Katsuyama City has only 4–5 properties per month within the scope of estimated settled ADR calculation, so a change in the sales policy of a single property moves the overall median substantially. This article does not comment on Katsuyama City’s fine-grained monthly movements and refers only to the annual average level. The discussion of the city is supplemented later using the Dinosaur Museum as a tourism core and the distribution of properties within a 12 km radius.
In Front of Fukui Station — Shinkansen Demand Riding on a Business Base
What underpins accommodation demand in front of Fukui Station is, first and foremost, a thick business base. Within a 1 km radius there are 2,325 establishments and 20,809 employees, of whom 5,773 (27.7%) are office-based. This is a standard composition for the central district of a prefectural capital, and this segment generates stable weekday occupancy. What the Shinkansen extension added was mixed tourism and business-travel demand riding on top of that existing business demand.
Usage of the Shinkansen at Fukui Station averages 3,600 passengers per day (first year after the extension), which ranks second among the prefecture’s four stations behind Tsuruga Station’s 7,700. On the other hand, passengers on the Kanazawa–Fukui section reached 8.161 million per year, up 25% versus the previous limited express service. In other words, Fukui Station functions not as a “terminus with mass inflow” but as a “relay hub with thicker traffic to and from the Kansai and Hokuriku regions.” That gradual increase in demand offers a consistent explanation for why room rates stepped up moderately, but steadily, by 12.1%.
Plotting room count on the horizontal axis and estimated settled ADR on the vertical axis makes the structure of the station-front market immediately clear. Sixteen properties with 1,805 rooms are packed into the ¥5,000–¥10,000 band, accounting for 65.7% of the total 2,746 rooms. Next comes the ¥10,000–¥14,000 band with 4 properties and 672 rooms (24.5%). And in the band above ¥14,000 there are only 2 properties and 269 rooms (9.8%).
| Estimated Settled ADR Band | Properties | Rooms | Room Share | Character of the Market |
|---|---|---|---|---|
| ¥20,000 and above | 1 | 252 | 9.2% | Formed single-handedly by a foreign-affiliated brand |
| ¥14,000–¥19,999 | 1 | 17 | 0.6% | Only one small-scale boutique property |
| ¥10,000–¥13,999 | 4 | 672 | 24.5% | Mainly select-service hotels with large hot spring baths |
| ¥8,000–¥9,999 | 5 | 750 | 27.3% | National chain business hotels |
| Under ¥8,000 | 11 | 1,055 | 38.4% | Local business hotels and ryokan |
The implication of this distribution is unambiguous. The area in front of Fukui Station is a market where “select-service properties around ¥8,000 form a thick layer, while above ¥14,000 there are effectively only two properties.” Moreover, one of those two has just 17 rooms, so the 100-room-class upper-mid product is effectively limited to a single property. For the station front of a prefectural capital, the upper price band is still thin — and that is where headroom remains.
| Property | Rooms | Estimated Settled ADR | Review Score | Notes |
|---|---|---|---|---|
| Courtyard by Marriott Fukui (コートヤード・バイ・マリオット福井) | 252 | ¥20,400 | 4.43 | Opened March 2024; the prefecture’s only foreign-affiliated brand |
| 9STAY Fukui Ekimae (9STAY福井駅前) | 17 | ¥14,000 | 4.24 | Opened June 2025; small-scale boutique format |
| Onyado Nono Fukui Natural Hot Spring Echizen no Yu (天然温泉 越前の湯 御宿 野乃福井) | 152 | ¥13,700 | — | Opened February 2026; with a large hot spring bath |
| Dormy Inn PREMIUM Fukui Natural Hot Spring Habutae no Yu (天然温泉 羽二重の湯 ドーミーインPREMIUM福井) | 189 | ¥13,700 | 3.97 | Upper-grade format with a large hot spring bath |
| Hotel Riverge Akebono (ホテル リバージュアケボノ) | 142 | ¥11,100 | 4.42 | Along the Asuwa River; local full-service format |
| Fukui Manten Hotel Ekimae (福井マンテンホテル駅前) | 189 | ¥10,300 | 4.20 | Station-front location with a large public bath |
The upper band is composed of one foreign-affiliated brand plus upper-tier select-service formats that use large hot spring baths as their differentiator. All of them earn high review scores, so demand that supports rates of ¥13,000–¥20,000 in front of the station clearly exists. The issue is not whether demand exists, but the depth of choice available.
Awara Onsen — A Wide Hot Spring Band, With Room to Add Depth in the Middle
Awara City’s estimated settled ADR averages ¥21,600 over the trailing 12 months, roughly 2.5 times that of Fukui City. But that median merely marks the center of an extremely wide price distribution. Broken down by property, the gap between the top and the bottom exceeds twelve times.
| Property | Rooms | Estimated Settled ADR | Review Score |
|---|---|---|---|
| Beniya Kofu Yuho, Awara Onsen (あわら温泉 光風湯圃 べにや) | 24 | ¥94,100 | 4.88 |
| Tsuruya, Echizen Awara Onsen (越前あわら温泉 つるや) | 25 | ¥48,300 | 4.56 |
| Hotel Yagi, Awara Onsen (あわら温泉 ホテル八木) | 72 | ¥44,100 | 4.57 |
| Grandia Housen (グランディア芳泉) | 111 | ¥40,900 | 4.55 |
| Seifuso, Awara Onsen (あわら温泉 清風荘) | 170 | ¥38,400 | 4.34 |
| Haiya (伝統旅館のぬくもり 灰屋) | 55 | ¥36,000 | 4.46 |
| Gekka (月香) | 20 | ¥33,300 | 4.71 |
| Matsuya Sensen (まつや千千) | 120 | ¥30,700 | 4.60 |
What stands out is that all eight of the top properties secure an overall review score of 4.3 or higher. From a 24-room, high-rate format (¥94,100) to a 170-room large ryokan (¥38,400), high rates and high ratings coexist regardless of scale. Awara Onsen is “a market where the product strength to command high rates has already been proven,” and in that respect its starting conditions differ from those in front of Fukui Station.
On the other hand, the middle of the distribution — specifically the ¥20,000–¥30,000 band — has few properties. Eight properties line up in the upper band (above ¥30,000) and several exist below ¥20,000, yet the price band in between is thin. Nationally, this band corresponds to the volume zone of leisure demand: roughly ¥20,000 per person with two meals included. Behind Awara Onsen’s failure to capture the Shinkansen benefit in its rates (+1.4% versus 2023), one reading is that there is room to expand the product line that reaches a demand segment different from the station front.
Katsuyama — Accommodation Supply Is Only Now Catching Up With a 1.3 Million-Visitor Tourism Core
Katsuyama City’s demand structure differs fundamentally from the other two clusters. A single tourist facility — the Fukui Prefectural Dinosaur Museum — defines almost all of its demand. The museum recorded 1,298,975 visitors in fiscal 2025, up 2.7% from 1,264,541 in the previous fiscal year and setting a record high for the second consecutive year. Looking at web ticket sales by region, the Kansai region accounts for 29.9% and the Kanto region 23.2%, meaning out-of-prefecture, long-distance visitors make up the majority.
Against a tourism core capable of drawing 1.3 million visitors a year, surrounding accommodation supply is limited. Within the scope MetroEngines Research covers, Katsuyama City has only 4–5 properties per month within the estimated settled ADR calculation scope. Even widening the radius to 12 km from the Dinosaur Museum, there are 47 registrations in the property master, but most are small ryokan and pensions with fewer than 10 rooms.
| Property | Rooms | Estimated Settled ADR | Notes |
|---|---|---|---|
| Amago no Yado (あまごの宿) | 9 | ¥22,200 | Small property built around mountain-stream cuisine |
| Katsuyama New Hotel (勝山ニューホテル) | 103 | ¥14,800 | The largest hotel within the radius |
| HOTEL Sunrea 21 (HOTEL サンレア21) | 27 | ¥11,500 | — |
| Itajin Ryotei Ryokan (料亭旅館板甚) | 12 | ¥8,700 | — |
| Tawaraya Ryokan (俵屋旅館) | 10 | ¥8,500 | — |
| Ogiya Ryokan (旅館 扇屋) | 13 | ¥6,700 | — |
| Yayoi Ryokan (旅館 弥生) | 7 | ¥6,600 | — |
| Asahi Ryokan (阿さひ旅館) | 8 | ¥4,700 | — |
What this distribution shows is a structure in which, apart from one 100-room-class hotel, virtually everything is a small property of around 10 rooms. Mid to upper-mid band products that families visiting from Kansai and Kanto could book as a set with the museum have simply not existed in this market. Relative to an annual draw of 1.3 million visitors, the capacity to receive them is only now beginning to gain depth.
Supply Pipeline — What the Data Shows, and What Press Reports Must Supplement
| Property | Rooms | Date |
|---|---|---|
| Hotel Route-Inn Ohi Takahama (ホテルルートイン大飯高浜) | 219 | 2023/09 |
| Mikuni Ocean Resort & Hotel (三国オーシャンリゾート&ホテル) | 97 | 2023/06 |
| Courtyard by Marriott Fukui (コートヤード・バイ・マリオット福井) | 252 | 2024/03 |
| Comfort Inn Fukui (コンフォートイン福井) | 96 | 2024/08 |
| Dormy Inn Tsuruga Natural Hot Spring Wakasa no Yu (天然温泉若狭の湯ドーミーイン敦賀) | 199 | 2025/07 |
| AB Hotel Echizen Takefu (ABホテル越前武生) | 121 | 2025/09 |
| Onyado Nono Fukui Natural Hot Spring Echizen no Yu (天然温泉 越前の湯 御宿 野乃福井) | 152 | 2026/02 |
| JAM Fukui Katsuyama Tokyu Hotel & Resorts (JAM福井勝山東急ホテル&リゾーツ) | 100 | 2026/04 |
On an OTA listing-confirmed basis, Fukui Prefecture recorded 13 openings with 358 rooms in 2023, 19 openings with 430 rooms in 2024, 19 openings with 388 rooms in 2025, and 9 openings with 321 rooms confirmed so far in 2026. Courtyard by Marriott Fukui (252 rooms), which opened in 2024, launched on March 15 — the day before the Shinkansen extension — and is a representative example of supply that priced in the extension.
Here we should make the limits of the data explicit. When we queried our building-plan data (based on building confirmation applications under MLIT’s “Building Construction Dynamics Statistics Survey”) for Fukui Prefecture, a search with no lower bound on room count and a cap of 200 records returned zero hits. Confirmation applications are normally filed one to two years before opening, so future years are structurally undercounted — but even allowing for that, nothing has yet surfaced on the official statistics side. The pipeline below is therefore limited to projects confirmable through press reporting.
| Project | Location | Rooms | Scheduled Opening | Notes |
|---|---|---|---|---|
| Fukui Station Minamidori District Urban Redevelopment, Hotel Tower (Operator: Candeo Hospitality Management / “Candeo Hotels Fukui”) | 1-chome Chuo, Fukui City (south side of Happiring) | approx. 170 | 2027 (within the fiscal year) | A 15-story mixed-use complex with total project cost of approximately ¥17.0 billion. Open-air observation bath and sauna on the top floor |
| Risonare Fukui (リゾナーレ福井) | Katsuyama City (Katsuyama Dinosaur Forest Park) | 100 | Autumn 2027 | Public-private partnership using Park-PFI; targeting 80% occupancy within three years of opening |
The direction these two projects indicate is clear. In front of Fukui Station, an upper-band product of approximately 170 rooms is expected to be added, equivalent to roughly a 63% increase over the current above-¥14,000 band within 2 km (2 properties, 269 rooms). Note that “Candeo Hotels Fukui,” initially reported as “11 stories, approximately 120 rooms,” refers to the operating brand of this Minamidori district redevelopment hotel tower (revised to 15 stories and approximately 170 rooms) and is not a separate project. Adding up press-stage information at face value is a textbook way to overestimate supply; pipelines must be deduplicated on an operator and location basis. In Katsuyama, a 100-room resort will rise inside the Dinosaur Forest Park, creating capacity in the mid to upper-mid band that has been absent until now. The market is moving to fill its own whitespace.
Price-Band Whitespace Map — The Gaps Differ Across the Three Clusters
Saturated Fukui Station Front ¥5,000–¥10,000
16 properties / 1,805 rooms (65.7%)
National chains and local business hotels form a thick layer. A mature price band competing for weekday business demand, where new entry means head-on competition with incumbents.
Whitespace 1 Fukui Station Front ¥14,000–¥25,000
Currently 2 properties / 269 rooms (9.8%)
The band with the greatest headroom for a prefectural capital’s station front. Even with the approximately 170-room redevelopment hotel tower added in 2027, the band reaches only about 440 rooms (+63%).
Whitespace 2 Katsuyama ¥15,000–¥30,000
Currently only one 100-room-class property
Capacity to serve a tourism core drawing 1.3 million visitors a year. The 100-room resort due in autumn 2027 will be the first substantial supply.
What the three clusters share is a structure of “a thin upper band sitting on top of a dense band.” But the location and character of the whitespace differ. The gap in front of Fukui Station is about capturing higher value from business demand (an upward shift in the rates business travelers pay), while Katsuyama’s gap is about capturing the volume zone of leisure demand. For Awara Onsen, the upper band is already thickly formed; there is instead room to expand the product line in the ¥20,000–¥30,000 mid band.
Backing Out Feasibility — Three Simplified Scenarios
Let us work backward from published benchmarks to test whether the upper-mid whitespace “stands up as an investment target.” Construction costs are presented in two stages.
Stage 1 (2025 actuals basis): Per-tsubo construction cost is ¥2.405 million for steel-frame (S) construction and ¥2.026 million for reinforced concrete (RC) construction (archi-book 2025 edition compilation).
Stage 2 (pricing in inflation during the construction period): Turner & Townsend forecasts construction cost inflation of +5.3% in 2026 and +5.0% in 2027. Assuming an opening around 2027, it is reasonable to allow for roughly +5% of upward drift by the midpoint of construction. In the estimates below, Stage 2 (post-inflation) figures are treated as the primary numbers.
| Item | A. Station Front, Select-Service Upper Recommended | B. Station Front, Upper-Mid | C. Hot Spring District, Upper-Band Repositioning |
|---|---|---|---|
| Rooms | 120 | 120 | 40 |
| Average room size | 20 m² | 25 m² | 30 m² |
| Assumed gross floor area | 3,529 m² | 4,839 m² | 2,182 m² |
| Assumed ADR | ¥18,000 | ¥22,000 | ¥40,000 |
| Assumed occupancy | 75% | 70% | 65% |
| Assumed GOP margin | 45% | 38% | 25% |
| Annual revenue | ¥591M | ¥675M | ¥380M |
| Annual GOP | ¥266M | ¥256M | ¥95M |
| Construction cost (2025 actuals basis) | ¥2.56B | ¥3.66B | ¥790M |
| Construction cost (post-inflation) | ¥2.69B | ¥3.84B | ¥830M |
| Total investment (incl. land) | ¥2.86B | ¥4.01B | ¥830M |
| GOP yield | 9.3% | 6.4% | 11.4% |
| Simple payback period | 10.7 years | 15.6 years | 8.8 years |
The select-service upper model (Scenario A) delivers a GOP yield of 9.3% and a payback period of 10.7 years. It holds room size down to compress construction costs while setting ADR at the midpoint of the current station-front upper band (¥13,700–¥20,400). The full-service upper-mid model (Scenario B) has a gross floor area more than 30% larger, so its yield settles at 6.4% — but this configuration is easier to make work when land costs can be apportioned as part of a mixed-use complex, as in the Fukui Station Minamidori district redevelopment.
Scenario C, repositioning an existing hot spring ryokan into the upper band, requires no land acquisition and keeps renovation costs to around ¥1.2 million per tsubo, giving the highest investment efficiency at an 11.4% yield. In Awara Onsen, the top eight properties already combine ADRs above ¥30,000 with review scores of 4.3 or higher, proving that this level is accepted by the market. There is ample basis for lifting properties up from the mid band.
| Scenario | Base case | ADR −10% | Occupancy −5pt | Both |
|---|---|---|---|---|
| A. Station Front, Select-Service Upper | 9.3% | 8.4% | 8.7% | 7.8% |
| B. Station Front, Upper-Mid | 6.4% | 5.8% | 5.9% | 5.3% |
Scenario A holds at 7.8% even in the combined case where ADR falls 10% and occupancy drops 5 points. For a select-service property in a regional city, that is a reasonable level of resilience. Scenario B, by contrast, falls to 5.3% in the combined case, so structuring it as part of a redevelopment project is more realistic than standalone development.
| ADR \ Occupancy | 65% | 70% | 75% | 80% | 85% |
|---|---|---|---|---|---|
| ¥15,000 | 6.7% | 7.2% | 7.8% | 8.3% | 8.8% |
| ¥16,500 | 7.4% | 8.0% | 8.5% | 9.1% | 9.7% |
| ¥18,000 | 8.1% | 8.7% | 9.3% | 9.9% | 10.5% |
| ¥19,500 | 8.7% | 9.4% | 10.1% | 10.8% | 11.4% |
| ¥21,000 | 9.4% | 10.1% | 10.9% | 11.6% | 12.3% |
Viewed on two axes, Scenario A only falls into the 6% range at an ADR of ¥15,000 combined with occupancy of 70% or below — a combination that sits beneath the floor of the current station-front upper band (¥13,700–¥20,400). Conversely, an ADR of ¥19,500 with 80% occupancy would exceed 10%. The structure secures around 8% even if either ADR or occupancy misses plan, provided the other holds at its assumed level, and this breadth of resilience is the basis for recommending the select-service scenario.
Assumptions and Caveats
| Point | Detail |
|---|---|
| A demand plateau | After surging in the first year of the extension, Fukui Prefecture’s total overnight stays fell back by 4.0% year on year in the second year (Japan Tourism Agency “Overnight Travel Statistics Survey,” final figures). The opening effect itself is being sustained, but building a business plan on the first-year level tends to overestimate the market. |
| Inbound share | Foreign visitors accounted for 2.9% of overnight guests in the prefecture in fiscal 2025, far below the national average of 27.2% (Hokuriku Local Finance Bureau, Fukui Finance Office). Conversely, capturing inbound demand remains as future upside. |
| Supply concentration | The only station-front project confirmable through press reporting is the Minamidori district redevelopment hotel tower (approx. 170 rooms), which takes the above-¥14,000 band from 269 rooms to approximately 440 rooms (+63%). Candeo Hotels Fukui, initially reported as “a separate project of approximately 120 rooms,” is the same property, and simply summing reported figures leads to overestimating supply. For those seeking first-mover advantage, pulling the opening date forward is effective. |
| Demographics | The resident population within 1.5 km of Fukui Station is estimated at 32,053 in 2025 and projected at 27,723 in 2040 (−18.1%). Business design must assume visitor demand from outside the prefecture and abroad, not local demand. |
| Rising construction costs | Per-tsubo costs are on an upward trend. While this squeezes feasibility, it also acts as a brake on new supply. Conditions favoring renovation of existing properties (Scenario C) relatively are likely to persist. |
| Data coverage | This analysis is limited to properties with confirmed activity on OTAs and excludes ryokan, minshuku and simple lodging businesses not listed on OTAs. Katsuyama City in particular has only 4–5 properties per month in the calculation scope, so it is referenced only for a sense of level. |
Note on ADR for future dates: The cluster-level ADR comparisons in this article are based on confirmed data through June 2026. Months from July 2026 onward are estimates based on selling prices published on OTAs at the time of the survey and will fluctuate as check-in dates approach. July 2026 onward is excluded from the charts and from the calculation of annual averages.
Conclusion
Telling the story of Fukui’s accommodation market through the single narrative of “the Shinkansen effect” misses the changes actually taking place. Broken down to the municipal level, the data reveals a 2.5x price hierarchy coexisting across Fukui City (¥8,600), Katsuyama City (¥18,600) and Awara City (¥21,600) — each with different sources of demand, different seasonality and different growth rates.
From an investment standpoint, the clearest opening is the ¥14,000–¥25,000 band in front of Fukui Station. Today that band holds only 2 properties and 269 rooms, just 9.8% of total rooms. Even with the roughly 170-room redevelopment hotel tower added in 2027, the band is projected to reach only about 440 rooms (+63%). Modeled as a select-service upper product, it delivers a 9.3% GOP yield even after pricing in construction cost inflation, and secures 7.8% in the combined case of a 10% ADR shortfall and a 5-point occupancy shortfall.
In Katsuyama, a 100-room resort will launch in autumn 2027 against a tourism core drawing 1.3 million visitors a year, creating a mid to upper-mid band that has not existed before. In Awara Onsen, the product strength of the upper band is already proven, and thickening the mid-band product line leaves room to capture a demand segment different from the station front. The three clusters each carry a different whitespace, and each awaits a different move.
Related Reading
References and Sources
■ Data sources
Estimated settled ADR is an estimate produced by applying category-specific adjustment coefficients to MetroEngines Research & Consulting’s history of OTA published prices. For Fukui Prefecture, 206–216 properties fall within the calculation scope out of 308–359 listed per month (January 2023 – June 2026). By municipality: Fukui City N=35–38 properties/month, Awara City N=21–22 properties/month, Katsuyama City N=4–5 properties/month. Property-level ADR covers 22 properties within 2 km of Fukui Station, 19 properties in Awara Onsen, and 8 properties within 12 km of the Dinosaur Museum. New openings are on an OTA listing-confirmed basis; building-plan data is from MLIT’s “Building Construction Dynamics Statistics Survey” (zero hits for Fukui Prefecture).
■ Estimation assumptions
Per-tsubo construction cost is from the archi-book 2025 edition compilation (S construction ¥2.405M / RC construction ¥2.026M); construction inflation prices in roughly +5% through the midpoint of construction based on Turner & Townsend forecasts (+5.3% in 2026 / +5.0% in 2027). GOP margins reference disclosed results from Invincible Investment Corporation (38.9% across 91 managed properties, fiscal period ended December 2024) and general ranges by property type, set at 45% for Scenario A, 38% for B and 25% for C. Land is 1,000 m² at ¥167,000/m² for A and B (2025 Official Land Price Survey, Fukui City commercial land average); C excludes land acquisition as it assumes renovation of an existing building. ADR assumptions are set from the estimated settled ADR distribution in this article. The two-axis sensitivity grid is calculated as GOP yield = (ADR × 120 rooms × occupancy × 365 days × 45% GOP margin) ÷ total investment of ¥2.86 billion.
■ Limitations and caveats
(1) Estimated settled ADR is an estimate with a median error of approximately 7% when cross-checked against property-level disclosures by listed hotel REITs (91 properties, most recent 3 months), and differs from each property’s actual transaction prices or accounting figures. (2) The analysis is limited to properties with confirmed activity on OTAs and excludes ryokan, minshuku and simple lodging businesses not listed on OTAs. (3) Katsuyama City has only 4–5 properties per month in the calculation scope, and a change in the sales policy of a single property moves the median substantially, so it is referenced only for a sense of level. (4) Months from July 2026 onward are estimates based on published prices and are excluded from the charts and annual average calculations. (5) The supply pipeline is on a press-confirmed basis and does not cover all plans in the prefecture. Because the same property is often reported multiple times under different names and planning stages, figures are aggregated after deduplication by operator and location. (6) The feasibility estimates are simplified calculations backed out from published benchmarks; actual investment decisions require a detailed feasibility study.
■ Market data
- MetroEngines Research & Consulting — estimated settled ADR (Fukui Prefecture: 308–359 properties listed per month / 206–216 within calculation scope), property-level ADR, new openings (OTA listing-confirmed basis), building-plan data query
■ Government statistics and public data
- MLIT National Land Numerical Information (station passenger counts; future population projections by 250 m mesh)
- Ministry of Internal Affairs and Communications / Ministry of Economy, Trade and Industry, “Economic Census for Business Activity” (establishment and employee counts)
- MLIT “Building Construction Dynamics Statistics Survey” (building-plan data; zero hits for Fukui Prefecture)
- MLIT “Official Land Price Survey” 2025 (Fukui City commercial land average ¥167,000/m²)
- Japan Tourism Agency “Overnight Travel Statistics Survey” (total overnight stays in Fukui Prefecture)
- Fukui Prefecture, “Conditions Following the Opening of the Hokuriku Shinkansen Fukui–Tsuruga Section”
- Ministry of Finance, Hokuriku Local Finance Bureau, Fukui Finance Office, “Economic Conditions in Fukui Prefecture” (June 2026)
■ Investment benchmarks
- archi-book 2025 edition — per-tsubo construction cost by structure (S construction ¥2.405M / RC construction ¥2.026M)
- Turner & Townsend, “International Construction Market Survey” — construction cost inflation forecasts
- Invincible Investment Corporation disclosure materials — 38.9% GOP margin across 91 managed properties (fiscal period ended December 2024)
■ News and press releases
- Groundbreaking ceremony held for the Fukui Station front urban redevelopment; hotel to be completed first in FY2027 (Nikkei)
- Second year of the Shinkansen extension: ¥42.7 billion economic ripple effect for Fukui Prefecture, estimated by DBJ (Nikkei)
- Fukui Prefectural Dinosaur Museum sets a record high for visitors for the second straight year: 1.29 million in FY2025 (Fukui Shimbun)
- Integrated development of condominiums, hotel, retail and parking on Minamidori in front of Fukui Station (Impress Watch)
- Courtyard by Marriott Fukui opens March 15, 2024 with 252 rooms (Marriott International press release)
- Eight hotel developments under way in Fukui Prefecture; Risonare Fukui to open in Katsuyama in autumn 2027 (Fukui TV)
- Hotel Harvest Ski Jam Katsuyama rebrands as “JAM Fukui Katsuyama Tokyu Hotel & Resorts,” opening April 1, 2026 (Ski Jam Katsuyama)
- Groundbreaking for “Risonare Fukui,” adjacent to the Dinosaur Museum (Travel Vision)