

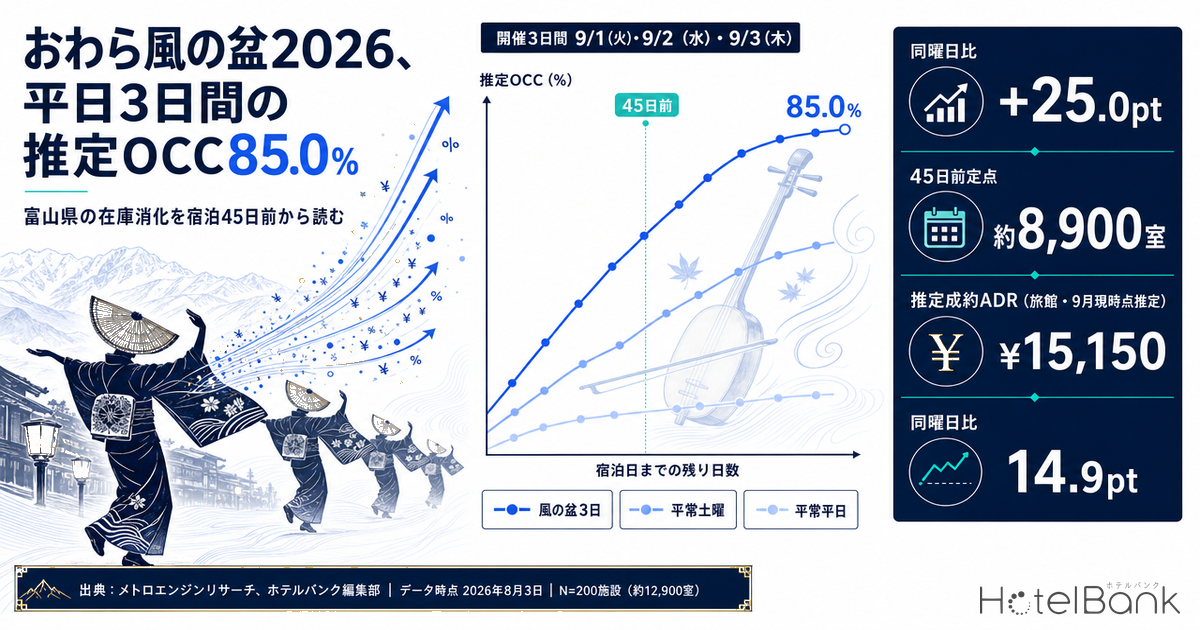
Tracking inventory depletion from 45 days before the stay date across 200 properties of all types in Toyama Prefecture (approximately 12,900 rooms), the estimated OCC (based on OTA-listed inventory) for the three days of the Etchu Yatsuo Owara Kaze no Bon festival — September 1 (Tue), 2 (Wed) and 3 (Thu), 2026 — had reached 84.7%, 86.6% and 83.6% (three-day average 85.0%) as observed on August 2, 2026. That is 15.6pt above the 69.4% average of three ordinary Saturdays in the same period (Aug 29, Sep 5, Sep 12), and 20.5 to 25.0pt above the same weekdays in the following week (Sep 8 Tue, Sep 9 Wed, Sep 10 Thu, averaging 62.0%). More importantly, roughly 15pt of that gap already existed 45 days out, and the incremental gain after the 45-day mark is almost identical to that of ordinary days. The deadline for deciding “switch to weekend-style pricing for a weekday event” falls earlier than most hotels assume.
Scope: Toyama Prefecture, all property types, N=200 properties (approx. 12,900 rooms). Price metrics in this article are estimated settled ADR (the transacted price level estimated from OTA and other sales data, tax-exclusive equivalent); occupancy is an estimate based on OTA-listed inventory. Definitions for both are at the end of the article. Data as of: August 3, 2026.
- — Estimated OCC 85.0% (observed as of August 2, 2026; average of the three festival days / Toyama Prefecture, all property types, N=198-200 properties). Sep 1 (Tue) 84.7%, Sep 2 (Wed) 86.6%, Sep 3 (Thu) 83.6%.
- — That is 15.6pt above the 69.4% average of three ordinary Saturdays, and 20.5 to 25.0pt above the 62.0% average of the same three weekdays in the following week. Three full weekdays have become the tightest dates in the prefecture.
- — The gap was already 14.9pt at the 45-day starting point (festival days 82.6% vs ordinary Saturdays 67.7%). The high occupancy was formed before the observation window even opened.
- — Over the common window from 45 to 41 days out, the incremental gain averaged +0.4pt on festival days and +1.0pt on ordinary weekdays — no meaningful difference. The pricing decision deadline sits earlier than 45 days out.
- — In room terms, roughly 8,900 more rooms were absorbed across the three days than on the same weekdays of the following week (total prefectural room count approx. 12,900 rooms). The pre-festival events (Aug 20-30) will not be held, so demand concentrates into the three days.
The 2026 edition runs three days, September 1-3, with no pre-festival events
First, let us fix the dates against official sources. According to the official website of the Owara Kaze no Bon Event Organizing Committee, the 2026 schedule is “September 1 (Tue) and 2 (Wed): 17:00-23:00” and “September 3 (Thu): 19:00-23:00.” The Etchu Yatsuo Tourism Association page states the same: “September 1 (Tue) 17:00-23:00,” “September 2 (Wed) 17:00-23:00,” “September 3 (Thu) 19:00-23:00.” The venue is the Yatsuo district of Toyama City.
From a revenue management standpoint, the most easily overlooked item is the treatment of the pre-festival events. The Etchu Yatsuo Tourism Association page explicitly states “The pre-festival events (Aug 20-30) will not be held.” In other words, in 2026 there is no vessel to absorb demand spread across late August, and lodging demand concentrates into the three days from September 1 to 3. In fact, August 29 (Sat), which would have fallen within the pre-festival period, stood at an estimated OCC of only 71.1% as observed on August 2 (27 days before the stay date).
Note that these three days are Tuesday, Wednesday and Thursday — full weekdays. A property that builds pricing off the day-of-week calendar alone will take the peak of demand at weekday rates. Below we confirm with data how large that gap is and when it forms.
Already about 15pt above ordinary Saturdays at the 45-day mark
The chart below shows the trajectory of estimated OCC from 45 days before the stay date through the latest observation (August 2, 2026). Overlaid on the three festival days (Sep 1, 2, 3) are an ordinary Wednesday (Sep 9) and an ordinary Saturday (Aug 29) for comparison.
Source: MetroEngines Research; compiled by the HotelBank Editorial Team
The three solid lines (festival days) already sit at 81.5-83.5% at the 45-day starting point. At the same point, ordinary Saturday August 29 was at 67.2% and ordinary Wednesday September 9 at 60.4%. The three festival days averaged 82.6% at 45 days out against 67.7% for the three ordinary Saturdays — a gap of 14.9pt. As early as 45 days before the event, three weekdays had become the tightest inventory dates in the prefecture.
Following through to the latest observation (August 2), the festival days moved to 84.7%, 86.6% and 83.6%, while the ordinary Saturdays moved to 71.1%, 70.4% and 66.6%. The gap has not narrowed. September 2 (Wed) in particular reached 86.6%, meaning close to 90% of listed inventory across the prefecture has been absorbed.
Matched by day of week, the gap is 20.5-25.0pt — about 8,900 rooms over three days
To strip out the day-of-week factor, we match each festival day one-to-one against the same weekday in the following week: September 1 (Tue) against September 8 (Tue), September 2 (Wed) against September 9 (Wed), and September 3 (Thu) against September 10 (Thu).
Source: MetroEngines Research; compiled by the HotelBank Editorial Team
As of the latest observation (August 2), the estimated OCC gaps are +23.4pt on Tuesday (84.7% vs 61.3%), +25.0pt on Wednesday (86.6% vs 61.6%) and +20.5pt on Thursday (83.6% vs 63.1%). Converted into listed room counts, September 1 absorbed roughly 3,000 more rooms than the same weekday the following week, September 2 roughly 3,200 more and September 3 roughly 2,600 more — about 8,900 rooms in total across the three days (all estimates, prefecture-wide basis). Given that the prefecture holds approximately 12,900 rooms in total, that means a volume equivalent to just under 70% of the prefecture’s entire inventory moved beyond what an ordinary week would absorb. On the question of which yardstick to use when measuring the gap between event days and ordinary days, the inventory progress at Awaodori 2026, where the four main dance-arena days had reached 98.8% at 45 days out, is also worth reading alongside this.
The table below lines up all nine stay dates at three fixed points: 45 days out, 41 days out and the latest observation. The three groups — festival days, ordinary Saturdays and ordinary weekdays — separate cleanly.
| Stay date | 45 days out est. OCC |
41 days out est. OCC |
Latest obs. est. OCC |
Days remaining at latest obs. |
Gain from 45 days out to latest |
Sold-out property rate at latest obs. |
|---|---|---|---|---|---|---|
| Sep 1 (Tue) Kaze no Bon | 81.5% | 82.0% | 84.7% | 30 days | +3.2pt | 31.0% |
| Sep 2 (Wed) Kaze no Bon | 83.5% | 84.8% | 86.6% | 31 days | +3.1pt | 33.2% |
| Sep 3 (Thu) Kaze no Bon | 82.8% | 82.3% | 83.6% | 32 days | +0.8pt | 26.6% |
| Aug 29 (Sat) | 67.2% | 67.8% | 71.1% | 27 days | +3.9pt | 26.3% |
| Sep 5 (Sat) | 70.0% | 68.9% | 70.4% | 34 days | +0.4pt | 23.7% |
| Sep 12 (Sat) | 65.9% | 66.6% | 66.6% | 41 days | +0.7pt | 20.7% |
| Sep 8 (Tue) ordinary | 59.7% | 60.8% | 61.3% | 37 days | +1.6pt | 17.0% |
| Sep 9 (Wed) ordinary | 60.4% | 61.3% | 61.6% | 38 days | +1.2pt | 21.6% |
| Sep 10 (Thu) ordinary | 62.0% | 63.0% | 63.1% | 39 days | +1.1pt | 18.6% |
Toyama Prefecture, all property types, N=198-200 properties (approx. 12,900 rooms). The number of observed properties per cell ranges from 133 to 193. Latest observation is August 2, 2026. Sold-out property rate = the share of properties for which no listed inventory can be confirmed on OTAs and similar channels (estimate).
Source: MetroEngines Research; compiled by the HotelBank Editorial Team
The build-up is decided before 45 days out — inside the window it matches ordinary days
This is the finding with the most operational bite. That festival days show high estimated OCC is easy to imagine; when that height was built is a separate question. Comparing the incremental gain over the common four-day window from 45 to 41 days out gives the following.
Among the festival days, September 1 gained +0.5pt, September 2 +1.3pt and September 3 -0.5pt. By contrast, ordinary weekdays gained +1.1pt on September 8, +0.9pt on September 9 and +1.0pt on September 10, while ordinary Saturdays gained +0.6pt on August 29, -1.1pt on September 5 and +0.7pt on September 12. Within this window, the pace of build-up on festival days is virtually indistinguishable from ordinary days. The reason festival days appear as +3.2pt / +3.1pt / +0.8pt in the “gain from 45 days out to latest” column of the table is largely that they can be tracked over more days than ordinary days (down to 30-32 days remaining).
| Group (three days each) | 45 days out avg. est. OCC |
41 days out avg. est. OCC |
Gain over common window (45 to 41 days out) |
Latest obs. avg. est. OCC |
Avg. sold-out property rate at latest obs. |
Gap vs festival days (latest obs.) |
|---|---|---|---|---|---|---|
| Festival days (Sep 1, 2, 3) | 82.6% | 83.0% | +0.4pt | 85.0% | 30.3% | — |
| Ordinary Saturdays (Aug 29, Sep 5, Sep 12) | 67.7% | 67.8% | +0.1pt | 69.4% | 23.6% | -15.6pt |
| Ordinary weekdays (Sep 8, 9, 10) | 60.7% | 61.7% | +1.0pt | 62.0% | 19.1% | -23.0pt |
Simple average of the three days in each group. The gain over the common window is the difference across the observation window shared by all nine dates — 45 days out and 41 days out — which removes the apparent difference caused by unequal numbers of observable days.
Source: MetroEngines Research; compiled by the HotelBank Editorial Team
Put differently, the 15-25pt gap between September 1-3 and ordinary days was already priced in at the 45-day starting point. For a nationally known annual event such as Owara Kaze no Bon, lodging demand sets before the 45-day mark. Moving after that point — “bookings are climbing, so let us raise rates” — runs into a market whose inventory is already tight, leaving limited material to work with. The same structure shows up at large events in other prefectures: in the booking curve for Aomori Nebuta 2026, inventory for the six festival days was essentially settled at 45 days out as well.
Estimated settled ADR in Toyama — year-on-year for confirmed months, and the current estimate for September
The price side is worth checking too. Below is a year-over-year overlay of estimated settled ADR for the ryokan category in Toyama Prefecture. Solid lines are confirmed figures; dotted lines are estimates based on current selling conditions (August and September 2026).
Toyama Prefecture, ryokan, N=69-75 properties. Source: MetroEngines Research; compiled by the HotelBank Editorial Team
Comparing July 2026, the most recent confirmed month, against the same month a year earlier: ryokan came in at ¥11,500 (July 2025: ¥12,200) for -5.7%, city hotels at ¥7,000 (vs ¥7,100) for -1.7%, business hotels at ¥6,500 (vs ¥6,300) for +3.1% and resort hotels at ¥11,900 (vs ¥12,000) for -1.0%. Direction differs by property type, but this was not a month in which the prefecture-wide level moved substantially.
| Category | July 2025 confirmed |
July 2026 confirmed |
YoY (confirmed vs confirmed) |
September 2026 current estimate |
|---|---|---|---|---|
| City hotel | ¥7,114 N=16 | ¥6,992 N=16 | -1.7% | ¥10,454 N=16 |
| Business hotel | ¥6,270 N=66 | ¥6,462 N=72 | +3.1% | ¥10,130 N=68 |
| Ryokan | ¥12,210 N=74 | ¥11,520 N=75 | -5.7% | ¥15,150 N=69 |
| Resort hotel | ¥12,013 N=6 | ¥11,891 N=7 | -1.0% | ¥15,122 N=6 |
Confirmed figures (past months) and current estimates (future months) rest on different calculation bases, so the two should not be subtracted from each other directly. A simple comparison against confirmed figures should wait for month-end confirmation.
Source: MetroEngines Research; compiled by the HotelBank Editorial Team
The current estimates for September 2026 are ¥10,500 for city hotels, ¥10,100 for business hotels, ¥15,200 for ryokan and ¥15,100 for resort hotels (all rounded to the nearest ¥100). These are monthly figures and do not represent the level for the three days of September 1-3 alone. That said, since they are estimates for a month in which a 15-25pt demand peak stands at the very start across the prefecture, it is worth checking where your own September settings sit relative to that range.
For revenue managers running hotels and ryokan in Toyama — implications and an action plan
(a) Insights from an operating perspective
1. There is one week a year when “weekday equals base rate” calendar operation breaks down. In Toyama Prefecture, the Tuesday, Wednesday and Thursday of September 1-3 sit at 84.7-86.6%, well above ordinary Saturdays (66.6-71.1% at the latest observation). If pricing is built off day-of-week codes, these three days will automatically open at weekday rates. It is worth opening your own rate calendar and visually confirming whether these three days are being treated as weekend-equivalent.
2. The decision deadline sits earlier than 45 days out. Over the common window from 45 to 41 days out, the gain was -0.5 to +1.3pt on festival days and -1.1 to +1.1pt on ordinary days. There is no meaningful difference between the two. Market demand was already priced in at the 45-day starting point. An operating rhythm of “think about it once bookings climb” is therefore structurally late. Looking to next year and beyond, placing the decision point on the pricing-revision calendar earlier than 45 days out is worth considering.
3. In a year with no pre-festival events, there are only three days to absorb demand. Just as the official announcement states that “the pre-festival events (Aug 20-30) will not be held,” there is no room for demand to spread across late August. The fact that August 29, the Saturday within the pre-festival period, stands at only 71.1% can be read as the flip side of that. How you absorb demand concentrated into three days will largely determine early-September results.
4. A high-occupancy market does not mean your property has the same shape. The estimated OCC in this article aggregates listed inventory across the prefecture; the shape at each property varies with location, room count and distribution-channel mix. When you overlay your own booking pace on the market curve, whether you were already below the market at 45 days out or fell behind only after that point calls for entirely different next moves. A good starting point is to redraw your booking trajectory for those three days alongside the same weekdays of an ordinary week.
(b) Action plan
| Time horizon | Action | Decision trigger (tied to figures in this article) | Objective |
|---|---|---|---|
| Today to this week | Move September 1-3 out of the “weekday” bucket and reset them under a weekend-equivalent rate class | If your settings for those three days remain at or below what you have set for ordinary Saturdays (Aug 29, Sep 5, Sep 12) | Avoid taking days that run at 84.7-86.6% market occupancy at weekday rates |
| Redesign minimum-stay and cancellation conditions for the three days separately from an ordinary week | If the sold-out property rate for the three days keeps running at 26.6-33.2%, above ordinary weekdays (17.0-21.6%) | Room to build a structure that does not miss multi-night demand across the three days through one-night-at-a-time bookings | |
| Within two weeks | Visualize your booking trajectory for those three days alongside the same weekdays of the following week (Sep 8, 9, 10) | If the market shows a +20.5 to +25.0pt gap on matched weekdays while your own gap falls well short of that | Separate a pricing problem from a visibility or inventory-allocation problem |
| Check your settings for September as a whole against the monthly estimated settled ADR range | If your September settings remain below the current estimate for your property type (city ¥10,454 / business ¥10,130 / ryokan ¥15,150) | Confirm your positioning across the whole month, not just the three days | |
| Looking to next month | Take stock of annual events and event dates as a “demand calendar” decoupled from the day of week | If you accept the structure in which the gain from 45 to 41 days out shows no difference between festival days (-0.5 to +1.3pt) and ordinary days (-1.1 to +1.1pt) | Shift toward a setup that can decide before demand sets |
| For the same period next year, place the pricing-revision decision point earlier than 45 days out | If you take into account that the gap already stood at 82.6% for festival days versus 67.7% for ordinary Saturdays (both three-day averages) at the 45-day starting point | Room to structurally reduce decision lag from a “move once it climbs” operating rhythm |
Source: MetroEngines Research; compiled by the HotelBank Editorial Team
Summary — three yardsticks for reading a weekday event
Yardstick 1: Look at the matched-weekday gap, not the day of week. Comparing whether festival-day estimated OCC is high against ordinary Saturdays is weak as decision material. How many points separate a festival day from the same weekday in the following week, one to one (here, +20.5 to +25.0pt), is the true strength of demand that event carries. For an example of the same yardstick applied to a single-day event, see the analysis comparing inventory depletion on the day of the Omagari Fireworks against an ordinary weekend.
Yardstick 2: Break down when the gap formed. Whether the gap already existed at the 45-day starting point or opened after 45 days out leads to entirely different available moves. In the Owara Kaze no Bon case it is the former: the gain over the window from 45 to 41 days out matched ordinary days. It works as a concrete example of the general rule that demand for nationally known annual events sets early.
Yardstick 3: Translate into room counts to grasp the scale. Points of estimated OCC alone are hard to convey in a management meeting. In this case, roughly 8,900 rooms of listed inventory were absorbed across the three days beyond what the same weekdays of the following week took. Set alongside the prefecture’s total of approximately 12,900 rooms, the size of the demand peak becomes immediately shareable.
About the data
| Definition of estimated OCC | Occupancy based on OTA-listed inventory = 100 – 100 x rooms remaining listed on OTAs / total rooms. It is an estimate based on how listed inventory is being absorbed and is defined differently from actual room occupancy (it reads higher). This article labels it “estimated OCC (based on OTA-listed inventory).” Scope is stay dates in August and September 2026. |
| Booking curve | Based on observations from 45 days before the stay date through the latest observation. The latest observation is August 2, 2026. |
| Definition of estimated settled ADR | The transacted price level (tax-exclusive equivalent) estimated from OTA and other sales data (lowest-plan level x property-type coefficient, ensembled across multiple channels). Past months are confirmed figures; the current and future months are estimates based on current selling conditions. Median error of 6.6% when reconciled against publicly disclosed operating results. Year-on-year comparisons are calculated only between confirmed months. |
| Breakdown of scope N | Booking curve: Toyama Prefecture, all property types, N=198-200 properties (total rooms approx. 12,871-12,902). The number of observed properties per table cell ranges from 133 to 193. Estimated settled ADR: Toyama Prefecture, city hotels N=16, business hotels N=66-72 (the current estimate for September 2026 is N=68), ryokan N=69-75, resort hotels N=6-7. |
| Data timing | Data as of August 3, 2026. Selling conditions and inventory move daily, so the figures in this article are a snapshot at the time of retrieval. |
References and sources
| Source | Content referenced |
|---|---|
| Owara Kaze no Bon Event Organizing Committee, official website | 2026 dates and times (September 1 and 2, 17:00-23:00; September 3, 19:00-23:00) |
| Etchu Yatsuo Tourism Association, “Owara Kaze no Bon” | Times for each day; announcement that the pre-festival events (Aug 20-30) will not be held |
| Toyama Tourism Navi (official Toyama Prefecture tourism site), “Etchu Yatsuo Owara Kaze no Bon” | Event outline and venue (Yatsuo district, Toyama City) |
■ Data sources
Inventory depletion: snapshots of OTA-listed inventory across all property types in Toyama Prefecture (daily observation from 45 days before the stay date through August 2, 2026; N=198-200 properties, total rooms approx. 12,871-12,902; the number of observed properties per table cell ranges from 133 to 193). Pricing: monthly series of estimated settled ADR by property type (city hotels N=16 / business hotels N=66-72 / ryokan N=69-75 / resort hotels N=6-7). Event dates, times and the treatment of the pre-festival events were referenced as primary information from the official pages of the Owara Kaze no Bon Event Organizing Committee, the Etchu Yatsuo Tourism Association and Toyama Tourism Navi.
■ Calculation assumptions
Estimated OCC = 100 – (rooms remaining listed on OTAs / total rooms) x 100. Group averages are simple averages of the three days in each group. Comparisons of incremental gain are made over the observation window shared by all nine dates — 45 days out and 41 days out — removing the apparent difference caused by unequal numbers of observable days. Room-count conversion is calculated as “matched-weekday estimated OCC gap x total rooms for that stay date,” rounded to the nearest hundred rooms. Year-on-year figures are calculated only between confirmed months (July 2025 and July 2026) and are not subtracted from the September 2026 figure, which is a current estimate.
■ Limitations and caveats
Estimated OCC is based on OTA-listed inventory and is defined differently from actual room occupancy (it reads higher). Properties that have withdrawn their listings may be counted as sold out, so the sold-out property rate carries error skewed to the upside. The number of observed properties varies from 133 to 193 by cross-section, and in thin cross-sections daily fluctuations can look larger than actual demand. Estimated settled ADR shows a median error of 6.6% when reconciled against publicly disclosed operating results. Monthly ADR represents the level for September as a whole and does not represent the rate for the three days of September 1-3 alone. All figures are a snapshot as of August 3, 2026 and will move with selling conditions.
Related reading
- Aomori Nebuta 2026: 97.4% Sold 45 Days Out, Post-Festival +14pt
- Awaodori 2026: 98.8% Sold 45 Days Out — 39.4pt Over Normal Weekends
- 94.5% Sold 45 Days Out: Omagari Fireworks vs a Normal Akita Weekend
- Yosakoi 2026: Kochi Aug 11 86.9% Sold Out at 45 Days, 45.0pt Gap
- Nagano Late-Summer Booking Curve 2026: Ryokan -11.8pt at 45 Days Out
- Tochigi Booking Curves by Type: Resort 81.1% at T-45, Only +2.6pt Left
- Hokkaido City Hotels: Only Aug 15 Trails at 78.7% OCC, 45 Days Out