

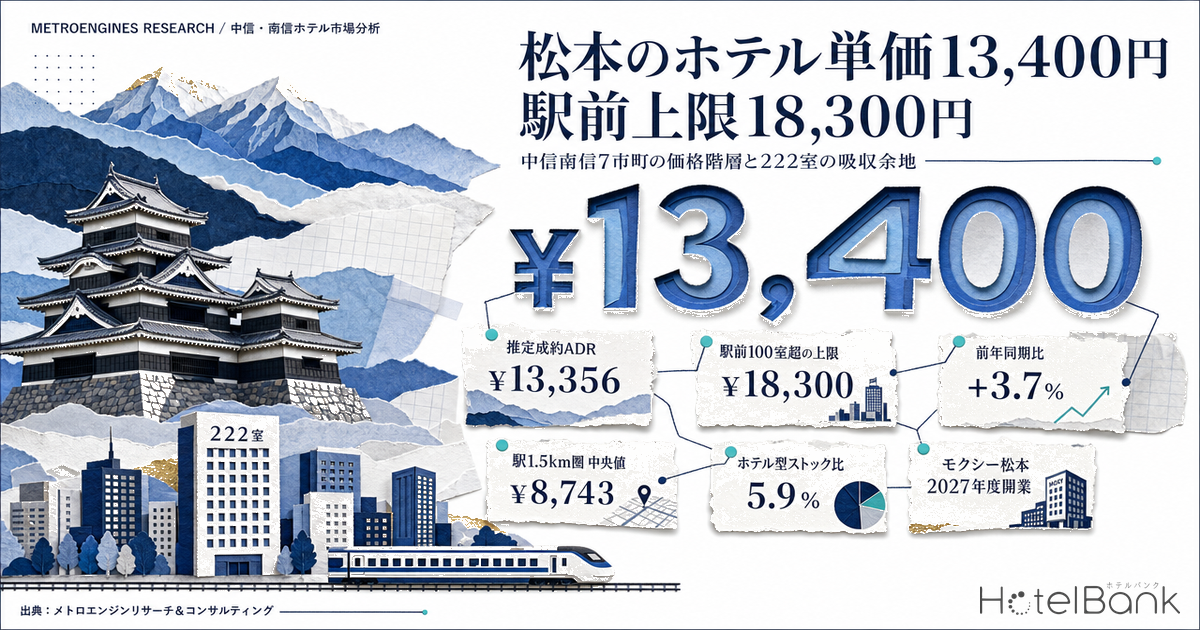
Investment analysis of Nagano Prefecture has long been skewed toward two narratives: the ski-resort story of Hakuba and Nozawa Onsen, and the summer-retreat story of Karuizawa and Shiga Kogen. Yet the thickest lodging demand in the prefecture sits neither in the prefectural capital nor in an internationally known resort. It is in Chushin and Nanshin — central and southern Nagano, centered on Matsumoto. Business demand and mountain-and-onsen tourism overlap in the same trade area, making this a somewhat unusual hybrid market for a Japanese regional city.
On 13 February 2026, Marriott International and MKK Corporation announced they had signed a contract to convert the former Inoue Department Store flagship — closed in March 2025 — into the 222-room “Moxy Matsumoto,” opening in fiscal 2027. It will be the first Marriott-family brand in Nagano Prefecture. Where does a property of that scale land in this market’s price tiers, and how much absorption capacity is there? This article quantifies the answer by cross-referencing MetroEngines Research estimated settled ADR, room-level inventory depletion data, and public statistics.
Metric Definitions Used in This Article
- ADR (average daily rate): an estimated settled rate (tax-excluded equivalent), derived by applying a segment-specific adjustment coefficient to the lowest publicly listed plan level each property posts on OTAs (two guests per room, per-room price, tax included). Cross-checked against property-level results disclosed by listed hotel REITs, the median deviation is 6.6% (scope: the verified categories of business, city, resort, ryokan, and capsule). These are estimates and differ from each property’s actual transacted rates and accounting figures. Area-level ADR is the median across covered properties (the level of a typical property in the area).
- Listed price: the average of all plans posted on OTAs and similar channels (two guests per room, per-room price, tax included). Because it spans room-only through meal-inclusive plans, it is on a different basis from the ADR above. The two are never mixed within the same table or chart.
- OCC (occupancy): sold rooms as a share of total rooms in the area (an estimate based on OTA-listed inventory; consistency checks against monthly REIT disclosures confirm accuracy of roughly a few points). Used only at the prefecture and municipality level; occupancy for individual properties is not calculated.
- LT (lead time): days remaining until check-in. LT0 = same day. Earliest sellout LT = the lead time at which remaining rooms first reached zero (a larger value means an earlier sellout). Sellout days observed = the cumulative number of days on which zero remaining rooms was observed. Both are determined on a room-count basis.
- Data source: MetroEngines Research & Consulting
- — Matsumoto’s estimated settled ADR is ¥13,356 (12-month average, August 2025-July 2026), up 3.7% year on year. Against Suwa at +17.3% and Shimosuwa at +16.9%, the largest market in the area is rising the most slowly.
- — The median across 28 properties and 3,335 rooms within 1.5km of the station is ¥8,743. The ¥19,000-¥25,000 band has zero properties, and the highest among the 14 properties with more than 100 rooms is ¥18,285 — a product combining scale and rate has yet to be introduced.
- — Estimated OCC for business hotels in Nagano Prefecture is 92.2% (July 2026), the highest of the four major segments, while their average listed price of ¥16,160 is the lowest. High occupancy at a low rate leaves the upside on the rate side.
- — 222 rooms equals 5.9% of Matsumoto’s 3,737 hotel-type rooms and 1.8% of the 12,301 rooms across the seven municipalities. At the same time, it single-handedly exceeds the six openings and 175 rooms added across Chushin and Nanshin in 2026.
- — At ¥20mn per room (¥4.44bn total), the ADR required for a 7% NOI yield is ¥12,300 (OCC 85%) — inside the market median. Depending on the ADR achieved, the yield swings between 4.7% and 10.4%.
Price Tiers Across the 7 Municipalities — the Largest Market Is Rising the Most Slowly
Start by drawing the price map. Looking at estimated settled ADR by municipality in Nagano Prefecture (12-month average, August 2025-July 2026), the seven Chushin and Nanshin municipalities are spread across a 2.3x range, from ¥6,370 to ¥14,400. Against Karuizawa (¥23,400), the prefecture’s highest, even Matsumoto sits 1.75x below.
The growth rates are the more interesting part. Compared with the same period a year earlier (August 2024-July 2025), the Suwa basin is posting double-digit gains — Suwa City at +17.3%, Shimosuwa at +16.9%, Okaya at +11.9%, and Chino at +9.3% — while Matsumoto, the largest market in the area, is up only 3.7%. Shiojiri is +1.0% and Azumino +3.4%.
This is not a story about weak demand in Matsumoto. As the later sections show, Matsumoto’s demand base is by far the thickest in the area. It is closer to reality to read this as a structure in which the ceiling of the price tier is held low, making the average hard to pull up. The largest headroom in the upper price bands in this area belongs to Matsumoto — that is the starting point of this article.
| Municipality | Estimated settled ADR Aug 2025-Jul 2026 | YoY | Listed properties monthly average | Properties in ADR calculation | Properties selling on OTAs / rooms |
|---|---|---|---|---|---|
| Shimosuwa | ¥14,370 | +16.9% | 11.1 | 10.2 | 14 properties / 115 rooms |
| Matsumoto | ¥13,356 | +3.7% | 154.6 | 101.2 | 195 properties / 6,166 rooms |
| Chino | ¥12,568 | +9.3% | 114.2 | 38.8 | 129 properties / 2,288 rooms |
| Suwa | ¥11,432 | +17.3% | 35.5 | 26.8 | 39 properties / 1,591 rooms |
| Azumino | ¥8,810 | +3.4% | 60.6 | 18.8 | 76 properties / 999 rooms |
| Shiojiri | ¥8,319 | +1.0% | 16.7 | 12.0 | 18 properties / 910 rooms |
| Okaya | ¥6,370 | +11.9% | 6.4 | 4.3 | 7 properties / 232 rooms |
| 7 municipalities, total | — | — | — | — | 478 properties / 12,301 rooms |
Listed property counts differ from the properties used in the ADR calculation because estimated settled ADR is limited to the five verified segments — business hotels, city hotels, resort hotels, ryokan, and capsule hotels. Pensions, vacation rentals, guesthouses and the like are counted among listed properties but fall outside the ADR population.
Matsumoto’s Positioning Map — Not a Single 100+ Room Property Above ¥18,300
Split Matsumoto into three sub-markets — the urban core within 1.5km of Matsumoto Station, the onsen districts about 6km out such as Asama Onsen and Utsukushigahara Onsen, and the mountain areas of Kamikochi, Shirahone Onsen and Norikura Kogen — and plot them on two axes, room count and estimated settled ADR. Matsumoto absorbed Kamikochi and Norikura into its municipal boundary through the mergers around 2005, so the city-wide ADR (¥13,400) is a blended figure across three different markets. That is worth keeping in mind.
Of the 60 properties with 25 or more rooms, 50 properties had a complete 12 months of estimated settled ADR. Of those, 28 properties and 3,335 rooms sit within 1.5km of the station, all classified as business or city hotels. The median estimated settled ADR across those 28 properties is ¥8,743, and the highest is ¥25,800 at a long-established 88-room hotel founded in 1887. On how far distance from the station carries into rate, Station Premium Ends at an 8-Minute Walk: 8 Stations, 1,012 Hotels measures the distance decay across eight major stations.
Two clear gaps stand out. The first is that the ¥19,000-¥25,000 band has zero properties within 1.5km of the station. The second is that of the 14 properties with 100 rooms or more, not one has an estimated settled ADR above ¥18,300. The top of the 100+ room group is a 168-room property with a large communal onsen bath (¥18,300), and two properties in the Kyoritsu Maintenance group, at 116 and 168 rooms, are what hold up the rate ceiling for station-area hotel-type product.
Meanwhile, setting aside the long-established station-area hotel (88 rooms, ¥25,800), everything above ¥22,500 is an onsen ryokan or resort, at 25 to 95 rooms and at least 3.7km from the station. No property in Matsumoto today satisfies all three conditions at once: walking distance from the station, more than 100 rooms, and above ¥18,300.
Dense The occupied space
¥5,000-¥18,300 x 30-333 rooms
27 of the 28 properties within 1.5km of the station sit in this band. Competition among room-only-led product is thickest here, and a new entrant would struggle to differentiate on price.
WS1 Station-area upper-midscale
¥19,000-¥25,000 x 100+ rooms
Zero properties. Despite a location able to capture both the area’s business demand and its mountain tourism, there is nothing to receive this price band.
WS2 Mid-scale lifestyle
Above ¥25,000 x 100+ rooms
Zero properties. Everything above ¥25,000 today is at 25-95 rooms, and apart from one long-established station-area hotel, all are onsen ryokan at least 3.7km from the station.
WS = white space. A gap in a price band does not mean demand is absent. The next section tests whether demand actually reaches that band, using the speed of inventory depletion.
Competitive Distribution and the Conversion Site — 14 Properties Within 1km, 10 of Them 100+ Rooms
The conversion site is at 2-3-1 Fukashi, Matsumoto — a four-minute walk from the east exit of Matsumoto Station and a one-minute walk from the Matsumoto Bus Terminal. According to MKK’s disclosure, the building was completed in March 1979 as a steel-reinforced concrete structure of seven floors above ground plus one basement, on a 2,781.98 sqm site with 13,594.67 sqm of gross floor area. Divided by 222 rooms, that is 61.2 sqm of gross floor area per room — a generous allocation for room-only-led product. Even allowing for the core and corridor losses involved in carving guest rooms out of deep department-store floor plates, it leaves room to secure public areas and amenities such as a bar or fitness facility.
What Supply and Demand Actually Look Like — Highest Occupancy of Any Segment, Inventory That Lingers to the Last Minute
A gap in a price band is not, on its own, grounds for an investment decision. Gaps arise both where “no one has offered it yet” and where “offering it would not sell.” So check the demand side from two angles.
The first is estimated occupancy. Breaking Nagano Prefecture down by segment for July 2026, estimated OCC for business hotels is 92.2% (July 2026; 142 properties, 13,315 rooms) — the highest of the four major segments of business, city, resort and ryokan. Ryokan are at 85.7% (July 2026; 334 properties, 7,947 rooms) and resort hotels at 90.5% (July 2026; 86 properties, 6,029 rooms). Yet in the same month, the average listed price for business hotels is ¥16,200, against ¥29,500 for ryokan and ¥43,500 for resort hotels — the lowest, not the highest. The prefecture’s hotel-type segment is running the highest occupancy at the lowest price.
The second angle is the speed of inventory depletion. Tracking remaining rooms on a room-count basis for the 2026 Obon peak (check-in 14 August), the median earliest sellout LT across 16 hotel-type properties (business and city) and 1,790 rooms in Matsumoto was 9 days, and even the fastest property was 42 days. For the 25 ryokan and 365 rooms in Matsumoto on the same date, the median was 26 days, and the fastest property reached zero of eight remaining rooms at LT78.
Suwa is more extreme still. Aggregating the four days from 13 to 16 August, the median average earliest sellout LT across 12 ryokan was 36.5 days, and the top property — a 26-room onsen ryokan — sold out at an average LT of 89 days on all four days (120 cumulative sellout days observed). The 78th Lake Suwa Fireworks Festival falls on 15 August, and for that single day the lakeside inventory disappears three months in advance. The five hotel-type properties in the same city, by contrast, have a median of 22.5 days.
Put together, peak demand in the area is locked up months ahead on the ryokan and resort side, while hotel-type product fills in the final two weeks. Even so, estimated OCC reaches 92.2% (July 2026, Nagano Prefecture business hotels). Rather than showing that hotel-type room supply is tight against demand, this indicates that hotel-type product has been fixed into the role of absorbing last-minute demand at a low rate. Put the other way: this urban core has yet to be offered a product that stacks bookings early and at a high rate. On how late-summer inventory is depleted across Nagano as a whole, Nagano Late-Summer Booking Curve 2026 tracks fixed-point movement by segment.
The Demand Base — 4.3x as Many Workers Within 1km of Matsumoto Station as in Suwa
The composition of demand itself differs between Matsumoto and Suwa. Aggregating a 1km radius from the Economic Census compiled by the Ministry of Internal Affairs and Communications and METI, the area around Matsumoto Station has 3,135 establishments and 30,317 workers, of which office-type activity accounts for 18.2%. Around Kamisuwa Station and the Lake Suwa shore, by contrast, there are 967 establishments and 7,125 workers (office-type 17.5%) — Matsumoto carries roughly 4.3x the depth on both establishments and workers.
Resident population tells the same story. Aggregating a 1.5km radius from MLIT National Land Numerical Information 250m mesh projections, the area around Matsumoto Station had 31,780 residents as of 2020, with a projected -9.4% by 2040. Around Kamisuwa Station the figure is 15,723 with a projected -21.0% by 2040, and a senior share of 36.8% (Matsumoto: 27.8%). On the medium-to-long-term demand base, Matsumoto’s decline is the most gradual in the area.
In other words, Matsumoto has a dual catchment: business demand on weekdays, and tourism demand on weekends and through the summer, anchored by Kamikochi, Utsukushigahara and Matsumoto Castle. Compared with a market dependent on a single tourism asset, this structure flattens seasonality more easily. Indeed, overlaying Matsumoto’s monthly estimated settled ADR year by year produces a clear August peak (¥17,200 in August 2025) while still holding ¥10,300-¥10,800 in the February trough. The peak-to-trough spread is about 1.6x, narrower than Suwa’s roughly 2.3x (¥18,000 in August 2025 / ¥7,718 in February 2025).
| Metric | Matsumoto Station area | Kamisuwa Station / Lake Suwa shore | Ratio |
|---|---|---|---|
| Establishments (1km radius) | 3,135 | 967 | 3.24x |
| Workers (1km radius) | 30,317 | 7,125 | 4.25x |
| Office-type share | 18.2% | 17.5% | — |
| Resident population 2020 (1.5km radius) | 31,780 | 15,723 | 2.02x |
| Projected population change by 2040 | -9.4% | -21.0% | — |
| Senior share (2025) | 27.8% | 36.8% | — |
The Supply Impact of 222 Rooms — Single-Handedly Larger Than the Area’s Entire 2026 New Supply
Next, the pressure on the supply side. Aggregating properties observed selling on OTAs between August and October 2026, Matsumoto’s room stock is 195 properties and 6,166 rooms. Of those, hotel-type product — business and city hotels — accounts for 34 properties and 3,737 rooms, and ryokan and resort hotels for 84 properties and 1,840 rooms. The 222 rooms equal 5.9% of hotel-type stock, 3.6% of the city total, and 1.8% of the 12,301 rooms across the seven Chushin and Nanshin municipalities.
For comparison, look at recent new supply. Nagano Prefecture had 55 lodging openings confirmed in 2026, sixth nationally (behind Hokkaido at 120, Okinawa at 82, Shizuoka at 76, Tokyo at 75, and Kyoto at 67). But aggregating the 50 for which room counts are known gives 812 rooms in total, with a median of one room, and only four properties at 100 rooms or more. Narrowing to the seven Chushin and Nanshin municipalities, 2026 brought six openings and 175 rooms (121 of them from a single property in Chino) — meaning this single 222-room project exceeds the area’s entire 2026 new supply.
| Municipality | Total rooms | Hotel-type business + city | Ryokan / resort | Hotel-type share | 222 rooms as a share of hotel-type |
|---|---|---|---|---|---|
| Matsumoto | 6,166 rooms | 3,737 rooms (34 properties) | 1,840 rooms (84 properties) | 60.6% | 5.9% |
| Chino | 2,288 rooms | 520 rooms (10 properties) | 1,110 rooms (30 properties) | 22.7% | — |
| Suwa | 1,591 rooms | 613 rooms (7 properties) | 802 rooms (21 properties) | 38.5% | — |
| Azumino | 999 rooms | 189 rooms (5 properties) | 338 rooms (17 properties) | 18.9% | — |
| Shiojiri | 910 rooms | 787 rooms (8 properties) | 48 rooms (4 properties) | 86.5% | — |
| Okaya | 232 rooms | 229 rooms (4 properties) | — | 98.7% | — |
| Shimosuwa | 115 rooms | 19 rooms (1 property) | 84 rooms (10 properties) | 16.5% | — |
| 7 municipalities, total | 12,301 rooms | 6,094 rooms (69 properties) | 4,222 rooms (166 properties) | 49.5% | 3.6% |
Note: opening counts are compiled on a listing-confirmation basis. Because listings appear several months before opening, counts for the most recent months may rise as further listings are added. Figures from the second half of 2026 onward should be read as current lower bounds.
The Economics of a Conversion — Required ADR Is ¥12,300 at ¥20mn per Room
Now translate these figures into terms a development decision can use. For a 222-room department-store conversion, we set investment (acquisition plus renovation) at three levels — ¥15mn, ¥20mn and ¥25mn per room — and back-solved the ADR required to meet NOI yields of 6% and 7%. The assumptions are a 40% GOP margin (set conservatively for a select-service format carrying ancillary F&B), NOI = GOP x 75% (a guide net of management fees, FF&E reserve and property taxes), and a rooms-revenue share of 82%.
| Investment (222 rooms) | Per room | ADR required for 6% NOI (OCC 85%) | ADR required for 7% NOI (OCC 85%) | ADR required for 7% NOI (OCC 80%) | Relation to market levels |
|---|---|---|---|---|---|
| ¥3.33bn | ¥15mn | ¥7,900 | ¥9,300 | ¥9,800 | Around the ¥8,743 median within 1.5km of the station |
| ¥4.44bn | ¥20mn | ¥10,600 | ¥12,300 | ¥13,100 | Below Matsumoto’s ¥13,356 median |
| ¥5.55bn | ¥25mn | ¥13,200 | ¥15,400 | ¥16,400 | Inside the ¥18,285 ceiling for station-area hotel-type product |
Here is how to read it. Even at ¥25mn per room (¥5.55bn in total), the ADR required for a 7% NOI is ¥15,400 — inside the current top of station-area hotel-type product (¥18,300). In other words, the economics work even without reaching the lower edge of the price-band white space (¥19,000). Conversely, whatever upside comes from placing product in the WS1 band of ¥19,000-¥25,000 flows straight through into investment capacity. On the framework for back-solving a “viable ADR” including the cost of capital, Policy Rate 1.00%: Break-Even ADR Across Japan’s 8 Hotel Markets sets this out across eight major trade areas.
Sensitivity is worth a look too. Holding the ¥20mn-per-room, ¥4.44bn case fixed and flexing ADR and OCC gives the following.
| Assumed ADR | OCC 70% | OCC 75% | OCC 80% | OCC 85% | OCC 90% | Where this ADR sits |
|---|---|---|---|---|---|---|
| ¥8,743 | 4.1% | 4.4% | 4.7% | 5.0% | 5.3% | Median of the 28 properties within 1.5km of the station |
| ¥13,400 | 6.3% | 6.7% | 7.2% | 7.6% | 8.1% | Matsumoto’s current median |
| ¥16,400 | 7.7% | 8.2% | 8.8% | 9.3% | 9.9% | Upper band for 100+ room station-area product |
| ¥18,285 | 8.5% | 9.2% | 9.8% | 10.4% | 11.0% | Current ceiling for station-area hotel-type product |
| ¥22,000 | 10.3% | 11.0% | 11.8% | 12.5% | 13.2% | Center of WS1 (¥19,000-¥25,000) |
Read across both axes and moving ADR up one step always beats lifting OCC by five points. Achieving 90% OCC at ¥13,400 yields 8.1%, but raising ADR to ¥16,400 reaches 8.2% at just 75% OCC. The range reachable by stacking occupancy and the range reachable by moving price band do not overlap.
Three scenarios — downside, base and upside
Keeping the same calculation frame (¥20mn per room, ¥4.44bn total, 40% GOP margin, NOI = GOP x 75%, rooms-revenue share of 82%, 365 days) and tying the achieved ADR to measured values from within the area gives the following range of investment outcomes. No assumptions are added; only the coefficients are flexed within the same model as the table above.
| Scenario | Assumed ADR | OCC | NOI yield | Basis for the ADR level |
|---|---|---|---|---|
| Downside | ¥8,743 | 80% | 4.7% | Pinned to the median of the existing 28 properties within 1.5km of the station — the white space is not captured and the product is absorbed into the current band |
| Base | ¥13,400 | 85% | 7.6% | The city-wide estimated settled ADR level (¥13,356) — the product lands in line with the market average |
| Upside | ¥18,285 | 85% | 10.4% | Matching the current ceiling for station-area hotel-type product (a 168-room property); still short of the ¥19,000 lower edge of WS1 |
The range spans 4.7% to 10.4% — 5.7 points. The driver of that swing is ADR, not OCC: flexing OCC between 80% and 85% moves the yield only 0.4-0.6 points, while moving ADR from ¥8,743 to ¥18,285 moves it more than 5 points. This project’s outcome is determined almost entirely by where the price band can be set, not by securing occupancy. Even the downside scenario secures 4.7%, but that is the level for a product absorbed into the existing low-rate band — thin justification for committing 222 rooms.
The risks are worth setting out as well. First, construction and renovation cost inflation: hotel construction cost (all-structure average) based on MLIT’s Building Construction Starts Statistics rose from ¥1.375mn per tsubo in 2023 to ¥1.952mn in 2025, up 42% in two years. A conversion reuses the frame, so its cost sensitivity is lower than new-build, but equipment renewal, seismic work and interiors carry heavy weight. Second, the durability of rate growth: Matsumoto’s estimated settled ADR is up 3.7% year on year, gentle by the area’s standards, so lifting the price band has to be engineered through product design rather than left to the market’s natural rise. Third, the 1979 vintage of the building: it was designed before the new seismic standard (June 1981), and the actual cost of retrofitting depends on individual assessment results.
That said, elevated construction costs also work to suppress new supply. The fact that only four of Nagano’s 55 openings in 2026 have 100 rooms or more is exactly that effect. In a market where large new-builds are hard to start, the ability to stand up 222 rooms at once using an existing frame is itself the structural advantage of this project format.
Conclusion — the Gap Is in the Price Ceiling
Viewing the seven Chushin and Nanshin municipalities as a single investment market, the structure that emerges comes down to five points.
| Issue | Data | Implication for an investment decision |
|---|---|---|
| Market size | 478 properties and 12,301 rooms across 7 municipalities. Matsumoto accounts for 50.1% with 195 properties and 6,166 rooms | Decisions within the area are governed by Matsumoto’s price tiers |
| Price tiers | Estimated settled ADR ranges from ¥6,370 in Okaya to ¥14,370 in Shimosuwa. Matsumoto is ¥13,356; the median within 1.5km of the station is ¥8,743 | The city-wide figure blends the urban core with the mountains. In practice the trade areas must be looked at separately |
| White space | Of the 28 properties within 1.5km of the station, zero sit in the ¥19,000-¥25,000 band. The highest among the 14 properties with 100+ rooms is ¥18,285 | Product combining scale and rate has yet to be introduced. A first mover can set the price ceiling |
| Supply and demand | Estimated OCC for Nagano business hotels is 92.2% (July 2026), the highest of the four major segments, while their average listed price of ¥16,160 is the lowest | High occupancy at a low rate. The upside remains on the rate side |
| Supply pressure | 222 rooms equals 5.9% of Matsumoto’s 3,737 hotel-type rooms and single-handedly exceeds the area’s 175 rooms of 2026 new supply | A temporary supply shock, but within a range the depth of the demand base can absorb |
Matsumoto’s rate is rising the most slowly in the area not because demand is weak, but because no product exists above the ¥18,300 ceiling. Place one thing above that ceiling and its price becomes the market’s reference point. A property of 222 rooms carries a power to create that reference point that a one-off high-rate boutique cannot.
And this is not only about Matsumoto. Estimated settled ADR in the Suwa basin is up 17.3% year on year because clear peak demand — the lake fireworks above all — is depleting ryokan inventory three months in advance. Demand that sells early and at a high rate already exists in this area. It simply has not been connected to hotel-type product. That is where Chushin and Nanshin stand today. When screening lodging investment in a regional core city, looking at where the top of the price distribution stops — rather than at the median — is the fastest way to find the gap.
Frequently Asked Questions
Q. Can Matsumoto’s estimated settled ADR of ¥13,356 be taken as the going rate for a business hotel near the station?
A. No. Because municipal mergers brought Kamikochi, Shirahone Onsen and Norikura Kogen inside the city boundary, the city-wide figure blends urban hotels with mountain resorts. Limited to the 28 properties and 3,335 rooms within a 1.5km radius of Matsumoto Station, the median estimated settled ADR is ¥8,743 — about 35% below the city-wide figure. To read actual conditions in the station trade area, the cut has to be by trade area, not by municipality.
Q. Isn’t the gap in the price band there because product does not sell at that price?
A. To rule that out, we check the demand side on two indicators. Estimated OCC for Nagano business hotels is 92.2% (July 2026), the highest of the four major segments (business, city, resort, ryokan), so the occupancy precondition for raising rate is already met. And on the ryokan side of the same trade area, properties were observed selling out at an average LT of 89 days over 13-16 August 2026, so high-rate, early-booking demand does exist within the area. It is more consistent to read the gap as “empty because no product has been introduced” than as “empty because it would not sell.”
Q. Isn’t 222 rooms excessive for the Matsumoto market?
A. It equals 5.9% of Matsumoto’s 3,737 hotel-type rooms (business and city), 3.6% of the city-wide 6,166 rooms, and 1.8% of the 12,301 rooms across the seven Chushin and Nanshin municipalities. As a single property it is among the largest additions in the area, but on a stock basis it stays in single digits. That said, 2026 brought only six openings and 175 rooms across Chushin and Nanshin, so the fact that one project exceeds the area’s annual new supply does need to be taken into account.
Q. How should the economics of a department-store conversion be viewed against a new build?
A. In this article’s simplified calculation, setting investment (acquisition plus renovation) at ¥20mn per room and ¥4.44bn in total, the ADR required for a 7% NOI is ¥12,300 at 85% occupancy — below Matsumoto’s current estimated settled ADR of ¥13,356. Even at ¥25mn per room and ¥5.55bn in total, the required ADR is ¥15,400, inside the current ¥18,285 ceiling for station-area hotel-type product. Reusing the frame lowers sensitivity to cost per tsubo relative to a new build, while the actual cost of equipment renewal and seismic retrofitting for a 1979 building depends on individual assessment. This is a simplified calculation assuming a 40% GOP margin and NOI = GOP x 75%; an actual investment decision requires a detailed feasibility study.
Related reading
- Nagano September: Wed 58.7% vs Holiday Sat 93.0%, 34pt Gap Holds
- Intra-Prefecture ADR Gaps 2026: Median 2.74x, Okinawa Widest at 5.86x
- 226k Hotel Rooms in 32 Regional Cities: 42.7% Built Before 1996
- Nagano Breakfast Premium: City +11.1% vs Resort +3.2% — 3x Segment Gap
- Snow as Cost or Asset: Winter RevPAR 53% vs Winter ADR 2.66x
- Hotel Supply Pressure Ranking 2026-2027: Ozu Kumamoto Tops at 30.8%
- Policy Rate 1.00%: Break-Even ADR Across Japan’s 8 Hotel Markets
- Station Premium Ends at an 8-Minute Walk: 8 Stations, 1,012 Hotels
- Nagano Late-Summer Booking Curve 2026: Ryokan -11.8pt at 45 Days Out
References and Sources
■ Data sources
Price and inventory data come from MetroEngines Research & Consulting: estimated settled ADR (monthly, by municipality and by property, August 2024-July 2026), listed prices, estimated OCC based on OTA-listed inventory, room-count-basis remaining-inventory movement and earliest sellout LT, and room-stock aggregation for properties observed selling on OTAs between August and October 2026. The demand base draws on the Economic Census for Business Activity (2021) and National Land Numerical Information projected future population by 250m mesh. Site conditions come from the 2026 Published Land Prices, and construction costs from the Building Construction Starts Statistics Survey. Project information comes from MKK Corporation’s release dated 13 February 2026.
■ Calculation assumptions
The economics are calculated holding 222 rooms, 365 operating days, a 40% GOP margin, NOI = GOP x 75%, and a rooms-revenue share of 82%. Investment (acquisition plus renovation) is set at three levels — ¥15mn, ¥20mn and ¥25mn per room — and OCC at two levels, 80% and 85%. The sensitivity analysis and the three scenarios hold investment fixed at ¥20mn per room and ¥4.44bn in total, flexing only ADR and OCC. All ADR figures are on the same basis as estimated settled ADR (tax-excluded equivalent). Area ADR is the median across covered properties, using only months on the verified-history basis across all 12 months.
■ Limitations and caveats
Estimated settled ADR is an estimate derived by applying segment coefficients to each property’s lowest listed plan level; cross-checked against property-level disclosures from listed hotel REITs, the median deviation is 6.6% (scope: the verified categories of business, city, resort, ryokan and capsule). It differs from actual transacted rates and accounting figures. Estimated OCC is an estimate based on the depletion of inventory sold on OTAs and is not a property’s overall actual occupancy. Municipality-level ADR blends different trade areas within the municipal boundary, and Matsumoto includes Kamikochi, Shirahone Onsen and Norikura Kogen. Opening counts are on a listing-confirmation basis, so recent months are lower bounds. The economics and scenarios are simplified calculations on fixed assumptions; an actual investment decision requires a detailed feasibility study. This article does not recommend any particular investment action.
■ Market data
- MetroEngines Research & Consulting — estimated settled ADR (by municipality and by property, August 2024-July 2026), listed prices, estimated OCC, room-count-basis remaining-inventory movement and earliest sellout LT, room-stock aggregation
■ Government statistics and public data
- Ministry of Internal Affairs and Communications / METI, “Economic Census for Business Activity” (2021); boundaries per the 2020 Population Census small areas (e-Stat Statistical GIS)
- MLIT National Land Numerical Information, “Projected Future Population by 250m Mesh” (based on the 2024 National Institute of Population and Social Security Research projection)
- MLIT, “Published Land Prices,” 2026 (Reiwa 8)
- MLIT, “Building Construction Starts Statistics Survey” — trend in hotel construction cost per tsubo
- Japan Tourism Agency, “Overnight Travel Statistics Survey”
■ Corporate disclosures and press releases
- MKK Corporation, “Report on the Signing of a Franchise Agreement with Marriott International” (13 February 2026)
- MKK Corporation NEWS (13 February 2026) — location, structure, site area, gross floor area
- Invincible Investment Corporation, Portfolio (Hotels) — benchmark for actual GOP margins
■ Media and other
- Travel Voice, “Marriott’s Moxy to open in Matsumoto, Nagano — renovating the former Inoue Department Store, 222 rooms in 2027” (17 February 2026)
- Travel Watch, “Nagano’s first Marriott ‘Moxy’ to open in front of Matsumoto Station” (February 2026)
- Land price and published land price data, Matsumoto (2026) — compilation of published land prices and standard-site information
- Lake Suwa Fireworks Festival official site — date of the 78th festival (15 August 2026)