

Hotel location has traditionally been measured on four yardsticks: demand (catchment, transport, events), supply (competing room count), land price, and disaster risk. This article quantifies a fifth axis — the operating cost that the climate itself generates every single year — using Japan Meteorological Agency (JMA) climate normals and MetroEngines Research room-rate data. Summer cooling costs have been discussed at length in recent years, but winter heating and snow removal, despite being recurring annual costs, are almost never put into numbers as an input to site selection.
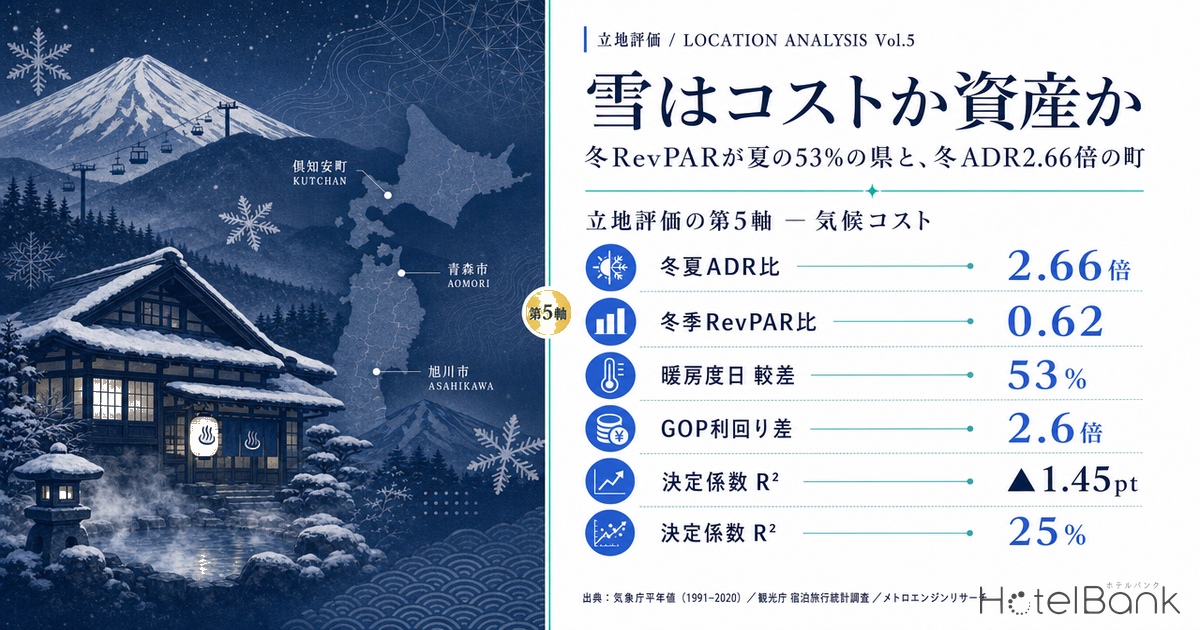
The conclusion first. Across 23 municipalities that lie within Japan’s designated heavy-snowfall zones, normal annual snowfall explains only a quarter of the variance in winter room rates. Within the same snowfall band, towns where the winter rate sinks to 0.62x the summer rate coexist with towns where it jumps to 2.66x. What separates GOP margin and yield is not how much snow falls, but whether the location is equipped to convert snow into revenue.
Metric Definitions Used in This Article
- ADR (average daily rate): an estimated transacted rate derived by applying a property-type correction factor to the lowest publicly listed plan level each property posts on OTAs and similar channels (double occupancy, per room, tax-included). Cross-checked against per-property results disclosed by listed hotel REITs (verified categories: business hotels, city hotels, resort hotels, ryokan, capsule hotels), the median error is 6.6%. It is an estimate and differs from each property’s actual transacted price or accounting figures. Area-level ADR is the median across the target properties (the level of a typical property in that area).
- Winter / Summer: winter = the four-month average of December 2025 to March 2026; summer = the three-month average of July to September 2025. For the prefecture-level analysis only, winter is defined as January to March plus December 2025, so that the series stays inside calendar year 2025 and aligns with the official statistics.
- Occupancy (OCC): the room occupancy rate published by the Japan Tourism Agency in its Accommodation Travel Statistics Survey, by prefecture and by accommodation type (2025). These are published actuals, not our estimates.
- RevPAR (estimated): a composite indicator obtained by multiplying the estimated transacted ADR above by the occupancy rate published by the Japan Tourism Agency. It combines two figures from different sources and is a reference value that differs from any individual property’s actual RevPAR.
- Heating degree days (HDD18) / Cooling degree days (CDD24): calculated from JMA monthly mean temperature normals (1991-2020). Heating degree days = the annual sum over each month of max(0, 18°C – monthly mean temperature) x days in that month. Cooling degree days use the same formula with a 24°C base. Both are standard indicators for comparing a building’s annual thermal load.
- Normal annual snowfall / normal maximum snow depth: total annual snowfall and maximum snow depth from JMA climate normals (1991-2020).
- Data sources: MetroEngines Research, Japan Meteorological Agency, Japan Tourism Agency
- — The winter/summer ADR ratio ranges from 0.62 to 2.66 — across 23 municipalities in heavy-snowfall zones, towns where the estimated transacted winter ADR falls nearly 40% below summer coexist with towns where it rises to 2.66x.
- — Snowfall explains only R-squared 0.25 — normal annual snowfall accounts for just a quarter of the variance in the winter/summer ADR ratio. What divides the sample is not snow volume but the presence of a demand engine that turns snow into rate.
- — Aomori Prefecture’s winter RevPAR is 0.53x its summer level — rate and occupancy sink together. The winter-summer occupancy gap for business hotels is 20.3 points, more than five times the national average of 3.7 points.
- — The spread in heating degree days is roughly 18x the spread in cooling degree days — 1,586 for Tokyo’s 23 wards against 4,101 for Asahikawa. On the question of location-to-location disparity, the winter side dominates, not the much-debated summer side.
- — Climate alone moves GOP yield by 1.45 points — modelled on a 150-room property. Across three scenarios with varied assumptions the gap stays within 1.06 to 1.84 points, and the ranking of locations never flips.
Snow as Cost or Asset — Defining the Fifth Axis of Location Assessment
According to Japan’s Ministry of Land, Infrastructure, Transport and Tourism (MLIT), the heavy-snowfall zones designated under the Act on Special Measures for Heavy Snowfall Areas account for roughly 51% of national land area and about 15% of the total population. Hotel investment in Japan therefore rests on the premise that, statistically, about half the country is a place where snow falls. Even so, winter operating cost is rarely treated as an independent variable in the investment decision process.
Location assessment already has a fourth axis in wide use: disaster risk, in which flood, tsunami and landslide hazard are folded into the investment decision. A hazard, however, is a one-off event that may or may not occur. The cost imposed by snow and cold is different in kind: it occurs every year without fail, and it concentrates in the season when revenue is thinnest. Because the nature of the exposure is so different, it needs to be treated as a separate axis.
Start by pinning the weight of snow to two numbers. The first is heating degree days (the annual accumulation of how far outside temperature falls below a base), the second is normal annual snowfall. The former governs the energy required for heating and hot water; the latter governs the physical workload of snow clearing, hauling and melting. Both can be computed mechanically from JMA climate normals, so anyone screening a site can obtain the same values.
Group A Locations that can sell snow
A winter demand engine — a ski resort, a snow-view onsen — sits inside the catchment, and the estimated transacted winter ADR exceeds the summer level. The increase in heating and snow-removal cost is recovered through rate. 11 of the 23 municipalities.
Group B Locations where snow is only cost
Demand is mainly business travel and winter ADR falls below summer. Climate cost rises while rate falls, so GOP margin is compressed from both sides. 12 of the 23 municipalities.
The split is not decided by snowfall
The correlation between normal annual snowfall and the winter/summer ADR ratio is +0.50, R-squared 0.25. Within the same snowfall band the ratio scatters across a 2.5x range. The dividing line is the presence of a demand engine, not the volume of snow.
Snowfall Explains Only 25% of the Variance in Winter Rates — Data from 23 Municipalities
We selected the 23 municipalities for which a weather station’s climate normals are available and for which we could compute an estimated transacted ADR from ten or more properties in both winter and summer. Plotting normal annual snowfall on the horizontal axis and “winter ADR divided by summer ADR” on the vertical, a gentle upward slope is visible. It is true that the snowier the location, the more likely winter rates are to run high.
But the correlation coefficient is only +0.50 and R-squared only 0.25. Three quarters of the variance in the winter/summer ratio is explained by something other than snowfall. In practice, the six municipalities with 900cm or more of snowfall span a 2.5x range, from Minakami at 1.06 to Kutchan at 2.66, and the six in the 400-700cm band span 2.6x, from Aomori City at 0.62 to Hakuba at 1.59.
Listing the municipalities individually makes the structure plain. At the top sit Kutchan (2.66), Hakuba (1.59), Yuzawa (1.53) and Yamagata City (1.41) — every one of them either an international ski destination or home to a large ski area. At the bottom sit Aomori City (0.62), Hakodate (0.64), Asahikawa (0.70) and Niigata Chuo Ward (0.73), the business centres of snow country.
Yamagata City deserves particular note. Its normal annual snowfall of 285cm ranks only 16th of the 23, yet its winter/summer ratio of 1.41 ranks 4th. The Zao demand engine converts a modest amount of snow into a high rate. Minakami runs the other way: with 1,152cm of normal annual snowfall it is among the snowiest places in Japan, yet its ratio stops at 1.06. The sheer volume of snow guarantees nothing about the efficiency with which it converts into revenue.
| Municipality | Prefecture | Normal snowfall (cm) | Normal max snow depth (cm) | Heating degree days | Winter ADR | Summer ADR | Winter/Summer | N |
|---|---|---|---|---|---|---|---|---|
| A Kutchan | Hokkaido | 921 | 183 | 4,044 | ¥47,554 | ¥17,850 | 2.66 | 20 |
| A Hakuba | Nagano | 655 | 100 | 3,313 | ¥19,130 | ¥12,046 | 1.59 | 40 |
| A Yuzawa | Niigata | 1,054 | 208 | 2,782 | ¥20,506 | ¥13,365 | 1.53 | 34 |
| A Yamagata City | Yamagata | 285 | 51 | 2,691 | ¥15,427 | ¥10,967 | 1.41 | 59 |
| A Yamanouchi | Nagano | 821 | 144 | 2,930 | ¥14,849 | ¥11,613 | 1.28 | 94 |
| A Nozawa Onsen | Nagano | 1,087 | 205 | 3,101 | ¥15,799 | ¥12,401 | 1.27 | 15 |
| A Myoko | Niigata | 1,061 | 204 | 2,688 | ¥12,408 | ¥9,796 | 1.27 | 36 |
| A Tokamachi | Niigata | 967 | 217 | 2,761 | ¥16,855 | ¥14,950 | 1.13 | 18 |
| A Minakami | Gunma | 1,152 | 207 | 3,411 | ¥18,806 | ¥17,755 | 1.06 | 46 |
| A Kusatsu | Gunma | 644 | 99 | 3,835 | ¥18,758 | ¥17,751 | 1.06 | 77 |
| A Nagano City | Nagano | 163 | 33 | 2,661 | ¥11,272 | ¥10,945 | 1.03 | 70 |
| B Fukui City | Fukui | 186 | 48 | 1,954 | ¥8,510 | ¥8,684 | 0.98 | 35 |
| B Takayama | Gifu | 305 | 55 | 2,867 | ¥16,582 | ¥16,999 | 0.98 | 120 |
| B Sapporo Chuo Ward | Hokkaido | 479 | 97 | 3,420 | ¥15,665 | ¥16,948 | 0.92 | 130 |
| B Fukushima City | Fukushima | 122 | 26 | 2,276 | ¥8,151 | ¥8,831 | 0.92 | 67 |
| B Joetsu | Niigata | 413 | 96 | 2,175 | ¥6,980 | ¥7,666 | 0.91 | 33 |
| B Toyama City | Toyama | 253 | 51 | 2,021 | ¥6,206 | ¥7,031 | 0.88 | 53 |
| B Kanazawa | Ishikawa | 157 | 32 | 1,866 | ¥8,897 | ¥10,174 | 0.87 | 113 |
| B Akita City | Akita | 273 | 37 | 2,671 | ¥6,686 | ¥8,050 | 0.83 | 29 |
| B Niigata Chuo Ward | Niigata | 139 | 32 | 2,164 | ¥5,764 | ¥7,892 | 0.73 | 44 |
| B Asahikawa | Hokkaido | 557 | 89 | 4,101 | ¥8,565 | ¥12,163 | 0.70 | 34 |
| B Hakodate | Hokkaido | 306 | 45 | 3,329 | ¥7,116 | ¥11,061 | 0.64 | 80 |
| B Aomori City | Aomori | 567 | 101 | 2,981 | ¥7,632 | ¥12,298 | 0.62 | 37 |
The Spread in Heating Degree Days Is 18x the Spread in Cooling Degree Days — Climate Cost Is Asymmetric
Next, look at thermal demand itself. Computing heating and cooling degree days from JMA monthly mean temperature normals shows how asymmetric Japan’s north-south spread really is.
Heating degree days run 1,586 for Tokyo’s 23 wards against 4,101 for Asahikawa — a gap of 2,515 degree-days, or 2.6x. Cooling degree days, by contrast, peak at 306 in Osaka City while Asahikawa, Sapporo and Aomori City all register zero, so the gap between the major cities of the Sea of Japan coast and northern Japan on one side and the Tokyo metropolitan area on the other is just 143 degree-days (Tokyo’s own value). The heating-side spread is on a scale roughly 18 times the cooling-side spread.
This asymmetry sits at odds with where the recent debate has placed its weight. Summer cooling costs have been covered repeatedly, and they matter. But on the question of location-to-location disparity, the contest is already settled on the winter side. Cooling costs converge to similar levels almost anywhere in Japan, whereas heating costs open up by more than a factor of two depending on where you build.
Snow adds physical workload on top of heat. Aomori City stood up a heavy-snowfall disaster response headquarters on 29 January 2026 and kept it in place until 25 March (per the city’s own announcement). The city’s fiscal 2025 snow-clearing budget reached a record scale of just over JPY 7.1 billion after supplementary appropriations, and Aomori Prefecture’s total snow-clearing expenditure of about JPY 9.07 billion set a record for the second consecutive year. Those are public-sector burdens, but private facilities operating under the same weather carry their own costs for on-site clearing, roof-snow handling and road heating.
At Prefecture Level, Winter RevPAR Runs 0.53x Summer — Rate and Occupancy Sink Together
At municipality level we could only look at rate. At prefecture level we can bring in the published occupancy rates from the Japan Tourism Agency’s Accommodation Travel Statistics Survey. For calendar 2025, we compare a composite RevPAR built by multiplying the estimated transacted ADR by published occupancy, for winter (January to March plus December) against summer (July to September).
The result is unambiguous. Aomori Prefecture’s winter/summer ratio is 0.53, Akita 0.58, Hokkaido 0.65, Toyama 0.65. Against that, Tokyo runs 1.07 and Fukuoka 1.03 — winter is in fact the stronger season. In snowy prefectures, rate and occupancy sink in winter together. That does more damage to revenue than either falling alone.
| Prefecture | Winter ADR | Summer ADR | Winter OCC | Summer OCC | Winter RevPAR | Summer RevPAR | Winter/Summer | N (ADR) |
|---|---|---|---|---|---|---|---|---|
| Aomori | ¥6,496 | ¥8,673 | 49.6% | 70.5% | ¥3,222 | ¥6,117 | 0.53 | 175 |
| Akita | ¥7,324 | ¥8,458 | 37.6% | 56.3% | ¥2,754 | ¥4,764 | 0.58 | 158 |
| Toyama | ¥6,956 | ¥7,870 | 44.6% | 61.0% | ¥3,104 | ¥4,801 | 0.65 | 156 |
| Hokkaido | ¥8,751 | ¥11,945 | 61.2% | 68.9% | ¥5,356 | ¥8,230 | 0.65 | 875 |
| Osaka | ¥10,058 | ¥13,287 | 74.4% | 79.7% | ¥7,480 | ¥10,585 | 0.71 | 627 |
| Nagano | ¥11,790 | ¥12,056 | 36.6% | 45.6% | ¥4,312 | ¥5,497 | 0.78 | 810 |
| Ishikawa | ¥10,132 | ¥11,227 | 50.9% | 57.5% | ¥5,155 | ¥6,459 | 0.80 | 228 |
| Fukushima | ¥7,244 | ¥7,558 | 44.8% | 52.6% | ¥3,245 | ¥3,978 | 0.82 | 426 |
| Niigata | ¥9,634 | ¥10,063 | 43.9% | 50.4% | ¥4,232 | ¥5,075 | 0.83 | 409 |
| Gifu | ¥10,577 | ¥11,446 | 52.3% | 57.8% | ¥5,529 | ¥6,620 | 0.84 | 352 |
| Yamagata | ¥9,341 | ¥9,255 | 45.7% | 54.5% | ¥4,271 | ¥5,047 | 0.85 | 278 |
| Gunma | ¥12,079 | ¥11,839 | 43.8% | 50.6% | ¥5,285 | ¥5,995 | 0.88 | 417 |
| Aichi | ¥8,251 | ¥8,665 | 66.8% | 69.6% | ¥5,516 | ¥6,031 | 0.91 | 495 |
| Fukui | ¥12,941 | ¥11,089 | 40.5% | 50.1% | ¥5,235 | ¥5,559 | 0.94 | 208 |
| Fukuoka | ¥11,062 | ¥10,994 | 71.5% | 70.0% | ¥7,915 | ¥7,692 | 1.03 | 460 |
| Tokyo | ¥14,082 | ¥13,232 | 75.2% | 74.8% | ¥10,596 | ¥9,902 | 1.07 | 1,074 |
Isolating occupancy by property type makes the gap starker still. Tracking business-hotel occupancy month by month through 2025, Aomori Prefecture runs 55.3% in January against 84.8% in August. The gap between the winter average (January to March plus December) of 62.1% and the summer average of 82.4% reaches 20.3 points. Akita follows at 19.9 points, Nagano at 17.7, Niigata at 17.6 and Toyama at 16.9 — the Sea of Japan coast, in order.
The national average seasonal gap, by contrast, is just 3.7 points, and in Tokyo winter actually runs 1.9 points higher than summer. Business hotels in snow country carry a seasonal swing more than five times the national average — and the trough coincides exactly with the period when heating and snow-removal costs peak.
Neighbouring Municipalities Reach Opposite Conclusions — Myoko vs Joetsu, Yuzawa vs Nagaoka
The structure shows up most sharply when adjacent municipalities in the same climate zone are placed side by side.
The Joetsu district of Niigata Prefecture. Myoko (proxy station Sekiyama, normal annual snowfall 1,061cm) has a winter/summer ADR ratio of 1.27. About 25km away in a straight line, in the same district, Joetsu (Takada, 413cm) sits at 0.91. Myoko gets 2.6 times the snow, and yet Myoko is the one where winter rates rise. The ski areas of the Myoko highlands generate winter demand, and snow converts into rate. On the Takada side demand is mainly business travel, and snow appears only as cost.
The Uonuma district of Niigata Prefecture. Yuzawa (1,054cm) at 1.53 against Nagaoka at 0.89. Northern Nagano: Yamanouchi 1.28 against Nagano City 1.03. Hokkaido: Kutchan (921cm) 2.66 against Asahikawa (557cm) 0.70. In every pair the climate zone is the same, and what splits the outcome is the presence of a demand engine, not the volume of snow.
| Myoko (1,061cm) | 1.27 |
| Joetsu (413cm) | 0.91 |
| Yuzawa (1,054cm) | 1.53 |
| Nagaoka | 0.89 |
| Kutchan (921cm) | 2.66 |
| Asahikawa (557cm) | 0.70 |
The Annual Cost Gap to Estimate at the Site-Selection Stage — A Modelling Framework
Here we translate the two yardsticks established so far — heating degree days and normal annual snowfall — into money. Actual amounts for any individual property move a great deal with equipment specification and contract terms, so what follows is a relative framework for comparing locations, intended to be used by substituting your own equipment specification and local quotations during due diligence.
Modelling assumptions
- Model property: a 150-room limited-service hotel in a regional city
- Estimated transacted ADR of JPY 8,500 and full-year room occupancy of 55% (close to the business-hotel level observed in this article for Sea of Japan coast prefectures), giving annual rooms revenue of JPY 255.96 million
- Utilities ratio: 6.5% of revenue (the Organization for Small & Medium Enterprises and Regional Innovation’s 2017 survey of small and medium ryokan businesses put ryokan utilities at 8.3% of revenue; limited-service hotels are set below that)
- Breakdown of utilities: 40% attributable to heating and hot water, 40% to cooling, and the remaining 20% a base load independent of season
- Heating cost is scaled to heating degree days and cooling cost to cooling degree days (the degree-day method). Tokyo’s 23 wards (heating degree days 1,586, cooling degree days 143) is the reference
- Annual outsourced cost of on-site snow clearing and melting: provisionally set at JPY 100 per room per year for each 1cm of normal annual snowfall (150 rooms at 567cm gives JPY 8.51 million a year). In practice, replace this with a local quotation
- GOP margin at the reference location is 35%, and the assumed acquisition price is JPY 1.2 billion (JPY 8 million per room). GOP yield = GOP / acquisition price
- ADR, occupancy, revenue mix and payroll are held identical across all locations; only climate-driven costs vary
On these assumptions, total climate-driven cost runs JPY 13.43 million a year at the reference location (equivalent to Tokyo’s 23 wards), JPY 25.56 million at an Asahikawa-equivalent location and JPY 30.78 million at a Kutchan-equivalent one. The important point here is the cooling-side rebate. In northern Japan cooling degree days fall to zero, so cooling cost disappears and offsets part of the increase in heating cost. After that offset, the net increase is JPY 12.13 million a year for the Asahikawa equivalent and JPY 17.35 million for the Kutchan equivalent.
| Location (climate conditions) | Heating degree days | Cooling degree days | Normal snowfall (cm) | Heating cost | Cooling cost | Snow-removal cost | Total climate cost | Change vs reference | GOP margin | GOP yield |
|---|---|---|---|---|---|---|---|---|---|---|
| Tokyo 23 Wards (reference) | 1,586 | 143 | 8 | 6.7 | 6.7 | 0.1 | 13.4 | +0.0 | 35.0% | 7.47% |
| Kanazawa | 1,866 | 158 | 157 | 7.8 | 7.4 | 2.4 | 17.5 | +4.1 | 33.4% | 7.12% |
| Joetsu (Takada) | 2,175 | 105 | 413 | 9.1 | 4.9 | 6.2 | 20.2 | +6.8 | 32.4% | 6.90% |
| Aomori City | 2,981 | 0 | 567 | 12.5 | 0.0 | 8.5 | 21.0 | +7.6 | 32.0% | 6.83% |
| Sapporo | 3,420 | 0 | 479 | 14.4 | 0.0 | 7.2 | 21.5 | +8.1 | 31.8% | 6.79% |
| Asahikawa | 4,101 | 0 | 557 | 17.2 | 0.0 | 8.4 | 25.6 | +12.1 | 30.3% | 6.45% |
| Kutchan | 4,044 | 0 | 921 | 17.0 | 0.0 | 13.8 | 30.8 | +17.4 | 28.2% | 6.02% |
Climate Alone Moves Yield by 1.45 Points — Sensitivity Analysis
With the same ADR, the same occupancy and the same acquisition price, climate-driven cost alone moves GOP margin from 35.0% to 28.2% — 6.8 points. Converted to GOP yield, that is a fall from 7.47% to 6.02%, or 1.45 points. Even an Asahikawa-equivalent location lands at 6.45%, 1.02 points below the reference.
In a market where cap rates sit in the 5% range, a yield gap of 1.0 to 1.5 points is large enough to flip an investment decision. And yet it is rarely set out explicitly in the acquisition pro forma. The reason is simple: heating and snow removal are buried inside a single “operating expenses” line rather than carved out as an attribute of the location.
From here one question follows that bears directly on the investment decision. By how much would winter ADR have to rise to recover the extra climate cost?
The model property’s winter rooms revenue (December to March, 121 days) is JPY 84.85 million. Recovering the Asahikawa-equivalent net increase of JPY 12.13 million requires lifting winter ADR by 14.3%. For the Kutchan-equivalent JPY 17.35 million, it is 20.5%.
The level required for recovery, and the distance to the market reality
Asahikawa: the winter rate increase required for recovery is +14.3%. The observed winter/summer ADR ratio is 0.70 (winter runs 30% below summer).
Kutchan: the increase required is +20.5%. The observed winter/summer ADR ratio is 2.66 (winter runs at 2.7x summer).
Both are in Hokkaido and both sit in the 4,000-degree-day heating class, and yet one falls far short of the level it needs while the other clears it by a wide margin.
The difference comes not from operating skill but from the demand structure the location holds. Even if the Asahikawa property tried to push through a 14% winter increase, winter demand volume already runs well below summer (business-hotel occupancy across Hokkaido is 74.5% in winter against 84.0% in summer), so lifting rate alone would simply cost more occupancy. In locations that cannot sell snow, climate cost is not something to pass through in price; it is something to compress through capital expenditure and operating design.
Read the other way, that leaves an earnings opportunity in Group B locations. Replacing heat sources for heating and hot water, upgrading insulation and optimising road-heating control all cut costs that concentrate in winter directly, and the payback case is easier to build than for cooling-side measures whose benefit is not seasonally concentrated. Where climate cost reaches 8-10% of revenue, cutting it by a fifth returns the equivalent of 1.6-2.0% of revenue to GOP.
The Ranking of Locations Survives Any Set of Assumptions — Three Scenarios and a Two-Axis Grid
Everything so far rests on two provisional figures: a utilities ratio of 6.5% and a snow-removal unit cost of JPY 100. We now move both at once to see how robust the conclusion is. ADR, occupancy, room count, assumed acquisition price and the reference location’s GOP margin are held constant; only climate-driven cost varies.
| Location | Metric | Optimistic | Central (as in text) | Pessimistic |
|---|---|---|---|---|
| Asahikawa-equivalent (HDD 4,101, CDD 0, normal snowfall 557cm) | Net increase in climate-driven cost vs reference location (JPY mn/yr) | +9.1 | +12.1 | +15.2 |
| GOP yield | 6.71% | 6.45% | 6.20% | |
| Yield gap vs reference location | -0.76pt | -1.01pt | -1.27pt | |
| Winter ADR increase needed to recover it | +10.7% | +14.3% | +17.9% | |
| Kutchan-equivalent (HDD 4,044, CDD 0, normal snowfall 921cm) | Net increase in climate-driven cost vs reference location (JPY mn/yr) | +12.7 | +17.4 | +22.0 |
| GOP yield | 6.41% | 6.02% | 5.63% | |
| Yield gap vs reference location | -1.06pt | -1.45pt | -1.84pt | |
| Winter ADR increase needed to recover it | +14.9% | +20.5% | +26.0% |
Under the optimistic, central and pessimistic cases alike, the order — reference location, then Asahikawa-equivalent, then Kutchan-equivalent — does not change. Even in the most generous case, the Kutchan-equivalent location sits 1.06 points below the reference. In a market with cap rates in the 5% range, a gap that size does not disappear with a different set of assumptions. The winter ADR increase required for recovery moves too, spanning +10.7% to +17.9% for the Asahikawa equivalent and +14.9% to +26.0% for the Kutchan equivalent, but the ratio between the two stays almost flat at 1.39-1.45x. The relative magnitude of climate cost is invariant to the assumptions; only the absolute values move.
Next we decompose how the two inputs — heating degree days and normal annual snowfall — each contribute to yield. Each row’s heating degree days is paired with the cooling degree days that locations at that level actually record.
| Heating degree days (cooling degree days) \ Normal snowfall | 8cm | 157cm | 413cm | 567cm | 921cm |
|---|---|---|---|---|---|
| 1,586 (143) | 7.47% | 7.28% | 6.96% | 6.77% | 6.32% |
| 1,866 (158) | 7.31% | 7.12% | 6.80% | 6.61% | 6.17% |
| 2,175 (105) | 7.41% | 7.22% | 6.90% | 6.71% | 6.27% |
| 2,981 (0) | 7.53% | 7.35% | 7.03% | 6.83% | 6.39% |
| 4,101 (0) | 7.14% | 6.95% | 6.63% | 6.44% | 6.00% |
Read the grid across, and within a single heating-degree-day row, moving from 8cm to 921cm of normal annual snowfall alone drops yield by 1.15 points. Read down, the fall from 1,586 to 4,101 heating degree days is only 0.33 points. What mainly drives the yield decline in Group B is not heating cost but snow-removal cost. In many locations, scrutinising the snow-clearing contract terms and the site geometry pays off more than moving straight to an energy-efficiency capex study.
A reversal also appears: the 2,981 heating-degree-day row beats the reference row (1,586) at 7.53% against 7.47% in the 8cm snowfall column. Where cooling degree days fall to zero, cooling cost disappears and more than offsets the rise in heating cost. Because the reference location splits utilities 40% heating and 40% cooling in equal measure, the reversal holds by construction until heating degree days reach twice the reference, or 3,172. Aomori City (2,981) and Joetsu (2,175) sit inside that boundary; Sapporo (3,420) and Asahikawa (4,101) sit outside it. This is, however, a consequence of the 40/40 split assumption, and the boundary moves if the heat-source mix differs. In practice you would derive the split from your own properties’ actual utility bills and substitute it in.
45 Listed Hotel REIT Properties and 7,314 Rooms Sit in the 12 Heavy-Snowfall Prefectures
This climate cost is already embedded in institutional portfolios. Checking our ownership master for the seven listed hotel REITs (300 domestic properties), the holdings located in the 12 prefectures that contain heavy-snowfall zones — Hokkaido, Aomori, Akita, Yamagata, Niigata, Toyama, Ishikawa, Fukui, Nagano, Gifu, Fukushima and Gunma — come to 45 properties and 7,314 rooms. Of these, 23 properties are in Hokkaido, with three each in Aomori, Niigata, Ishikawa and Gunma.
By sponsor, Invincible Investment Corporation stands out with 26 properties. These are mainly larger limited-service hotels located in the cities this article classifies as Group B: Art Hotel Aomori (211 rooms), Art Hotel Asahikawa (265 rooms), Art Hotel Niigata Station (304 rooms), Hotel MyStays Premier Kanazawa (244 rooms) and others. Ichigo Hotel REIT Investment Corporation holds six properties, Hoshino Resorts REIT five, and Japan Hotel REIT Investment Corporation and Nippon Hotel & Residential Investment Corporation four each.
Verifying this climate cost from the outside, however, is currently difficult. Monthly disclosure by listed hotel REITs centres on revenue-side indicators such as occupancy, ADR and RevPAR; per-property utilities and snow-removal costs are outside the disclosure scope. Invincible Investment Corporation’s published results for June 2026 across 101 domestic hotels show occupancy of 82.7% (down 0.1 points year on year), ADR of JPY 12,412 (down 3.9%) and RevPAR of JPY 10,264 (down 4.0%) — but these are portfolio-wide figures, and the cost structure of the heavy-snowfall properties alone cannot be read out of them.
Which is precisely why estimating climate cost yourself, at the location-assessment stage, is worth doing. Since it cannot be backed out of disclosure, the only option is to model it in-house at the time of acquisition review, using heating degree days and normal annual snowfall as inputs. Fortunately, anyone can obtain identical values for both from JMA climate normals.
A Site-Selection Checklist — Five Things to Look At on the Climate Axis
1. Pull the heating degree days first
Compute heating degree days from JMA climate normals and compare against the average of your existing portfolio. If the site exceeds 1.5x your reference location, add heat-source specification and insulation performance to the mandatory due-diligence list.
2. Measure workload with normal annual snowfall
Combine it with site area, parking area and roof geometry, and pin the annual outsourced cost of snow clearing and melting with a local quotation. Normal maximum snow depth drives roof snow load and the frequency of one-off hauling.
3. Judge recoverability from the winter/summer ADR ratio
If the catchment’s winter/summer ADR ratio is below 1.0, build the model on the premise that climate cost cannot be passed through in price. If it is above 1.0, put a number on the gap between the increase required and the observed level.
4. Do not forget the cooling-side rebate
Stacking up heating cost alone overstates the burden. In northern Japan cooling cost all but disappears and offsets part of the heating increase. Only by treating both symmetrically in degree-day terms do you get the net difference.
5. Build the payback case for energy capex on the winter side
Where climate cost reaches 8-10% of revenue, heat-source replacement and insulation upgrades deliver larger savings and a clearer payback horizon. In some cases they should rank ahead of summer-side measures.
Summary
Comparing estimated transacted ADR between winter and summer across 23 municipalities in heavy-snowfall zones, the correlation between normal annual snowfall and the winter/summer ADR ratio came to +0.50, with R-squared of 0.25. Snow volume explains only a quarter of the variance in winter rates. Within the same snowfall band the ratio scatters across a roughly 2.5x range, from 0.62 in Aomori City to 2.66 in Kutchan.
At prefecture level we confirmed a structure in which rate and occupancy sink together. Aomori Prefecture’s winter RevPAR is 0.53x its summer level, Akita’s 0.58x. Measured on business-hotel occupancy, Aomori’s winter-summer gap is 20.3 points, more than five times the national average of 3.7 points.
The spread in thermal demand is asymmetric. Heating degree days open up by 2,515 between Tokyo’s 23 wards at 1,586 and Asahikawa at 4,101, while the cooling-degree-day spread stops at 143. The heating-side spread is on a scale roughly 18 times the cooling side, and on the question of location-to-location disparity the winter side dominates.
In the 150-room model, climate-driven cost alone moved GOP margin by 6.8 points and GOP yield by 1.45 points. Recovering that increment through winter rate would require a 14.3% increase at the Asahikawa equivalent, whereas the observed winter ADR runs at 0.70x summer. Kutchan, by contrast, needs +20.5% and posts 2.66x — recovery with room to spare.
That is the case for putting a fifth axis into location assessment. Climate cannot be changed, but the cost climate generates can be quantified before acquisition. Feed in two public datasets — heating degree days and normal annual snowfall — and even a model holding ADR and occupancy constant shows, in advance, that yield moves by more than a point depending on where you build. And whether a location can absorb that gap through rate turns out to differ even between neighbouring municipalities.
Frequently Asked Questions
How do I calculate heating degree days?
Take the JMA’s published monthly mean temperature normals (1991-2020), compute “max(0, 18°C – monthly mean temperature) x days in that month” for each month, and sum the twelve months. Every heating-degree-day figure in this article is calculated that way. Cooling degree days use a 24°C base and sum “max(0, monthly mean temperature – 24°C) x days in that month” over the year. Where a municipality has no weather station, use the nearest station in the same district as a proxy.
If snowier locations command higher winter rates, can we simply treat snow as an asset?
The tendency holds, but R-squared stops at 0.25. Even among the six municipalities with 900cm or more of snowfall, the winter/summer ADR ratio spans a 2.5x range from 1.06 to 2.66, and Minakami, with 1,152cm of normal annual snowfall, manages only 1.06. Yamagata City, at 285cm, records 1.41. Snow becomes an asset only where a demand engine — a ski area, a snow-view onsen — sits inside the catchment. Making an investment decision on snowfall alone will lead you astray.
If heating costs rise in winter but cooling costs fall in summer, doesn’t it net out to zero?
An offset does occur, but it does not reach zero. The spread in heating degree days (2,515, between Tokyo’s 23 wards at 1,586 and Asahikawa at 4,101) is on a scale roughly 18 times the spread in cooling degree days (143, between Tokyo’s 23 wards and the zero recorded by northern Japan’s major cities). Even after the cooling-side rebate is built into our model, an Asahikawa-equivalent location is left with a net increase of JPY 12.13 million a year. On top of that, snow clearing and melting have no offsetting term at all.
Can I apply this model to my own property as it stands?
Please do not. The figures here are a framework for comparing locations, built on the assumptions set out under “Modelling assumptions”; actual amounts vary widely with heat-source type (electricity, city gas, LPG, kerosene, heavy fuel oil A), insulation performance, the presence of a large communal bath, site geometry and snow-removal contract terms. The practical approach is to derive unit rates by matching heating degree days and normal annual snowfall against the actual utility and snow-removal costs of your existing properties, then apply those unit rates to the degree days and snowfall of the site under review.
Why do the winter and summer windows differ between the municipality-level and prefecture-level analyses?
The municipality-level analysis uses our data only, so it compares the most recent winter (December 2025 to March 2026) against the most recent summer (July to September 2025). The prefecture-level analysis brings in published occupancy from the Japan Tourism Agency’s Accommodation Travel Statistics Survey; to avoid the effect of that survey changing its stratification basis from employee count to room count with the January 2026 data, we keep the series inside calendar 2025 (winter = January to March plus December, summer = July to September), entirely within the pre-change basis.
Related Reading
- Niigata Hotel Investment Map: Niigata City, Yuzawa & Sado in 3 Layers
- Station Premium Ends at an 8-Minute Walk: 8 Stations, 1,012 Hotels
- 2026 Electricity Price Surge: Supply-Side Cost Impact Analysis for Hotel Operations
References and Sources
Data sources
Estimated transacted ADR by municipality and by prefecture is compiled by MetroEngines Research & Consulting (municipality level: winter = December 2025 to March 2026, summer = July to September 2025; prefecture level: within calendar 2025, winter = January to March plus December, summer = July to September). We used the 23 municipalities with ten or more properties in the ADR calculation in both winter and summer, and no month in the covered period has thin coverage. Occupancy rates are published actuals from the Japan Tourism Agency’s Accommodation Travel Statistics Survey 2025, by prefecture and accommodation type. Heating and cooling degree days, normal annual snowfall and normal maximum snow depth are calculated from Japan Meteorological Agency climate normals (1991-2020). Listed hotel REIT holdings come from our own ownership master (300 domestic properties).
Modelling assumptions
A simplified model holding 150 rooms, an estimated transacted ADR of JPY 8,500, full-year occupancy of 55%, an assumed acquisition price of JPY 1.2 billion and a reference-location GOP margin of 35% constant across all locations, varying only climate-driven costs (heating, cooling and snow removal). Utilities are set at 6.5% of revenue, split 40% heating, 40% cooling and 20% season-independent base load. Heating cost scales with heating degree days and cooling cost with cooling degree days, while snow-removal cost is provisionally set at JPY 100 per room per year for each 1cm of normal annual snowfall. Sensitivity was checked across three scenarios spanning a utilities ratio of 5.5-7.5% and a snow-removal unit cost of JPY 70-130. Full detail is under “Modelling assumptions” in the body.
Limitations and caveats
The estimated transacted ADR is an estimate and differs from each property’s actual transacted price or accounting figures. Because the model holds everything other than climate-driven cost (payroll, repairs, insurance, taxes and public dues) identical across locations, it does not represent the full difference in actual economics between locations. Amounts vary widely with heat-source type (electricity, city gas, LPG, kerosene, heavy fuel oil A), insulation performance, the presence of a large communal bath, site geometry and snow-removal contract terms, so they should be treated as relative values for comparing locations. Where a municipality has no weather station, the normals of the nearest station in the same district are used as a proxy (Yamanouchi = Iiyama, Myoko = Sekiyama, Minakami = Fujiwara). Monthly disclosure by listed hotel REITs centres on revenue-side indicators and excludes per-property utilities and snow-removal costs, so the climate costs discussed here cannot be verified directly against disclosed results.
Market data
- MetroEngines Research & Consulting — estimated transacted ADR (by municipality and prefecture, January 2025 to March 2026), REIT ownership master (300 domestic properties)
Weather and climate data
- Japan Meteorological Agency, Past Weather Data Search — climate normals (1991-2020) — monthly mean temperature, total annual snowfall, maximum snow depth
Government statistics and public data
- Japan Tourism Agency, Accommodation Travel Statistics Survey — room occupancy by prefecture and accommodation type, monthly time series
- MLIT, Promotion of Measures for Heavy Snowfall Areas — designation status of heavy-snowfall and special heavy-snowfall zones (about 51% of national land area, about 15% of the population)
- MLIT, Published Land Prices — published residential land price for Kutchan (2026)
- Aomori City, response status following the establishment of the FY2025 heavy-snowfall disaster response headquarters — headquarters established 29 January 2026 and dissolved 25 March 2026
- Organization for Small & Medium Enterprises and Regional Innovation, Survey of Management Conditions in Small and Medium Ryokan Businesses (March 2017) — utilities as a share of revenue for ryokan
- Agency for Natural Resources and Energy, Overview of the Benchmark System for the Hotel Industry — approach to energy consumption intensity in the accommodation sector
REIT and corporate disclosure
- Invincible Investment Corporation, “Operating Results for June 2026” — occupancy, ADR and RevPAR across 101 domestic hotels
News coverage
Note on the modelling: the cost, GOP and yield figures in this article are a simplified illustration based on the assumptions set out under “Modelling assumptions”. Any actual investment decision requires a detailed feasibility study reflecting the specific equipment specification, contract terms and local quotations for the property in question.