

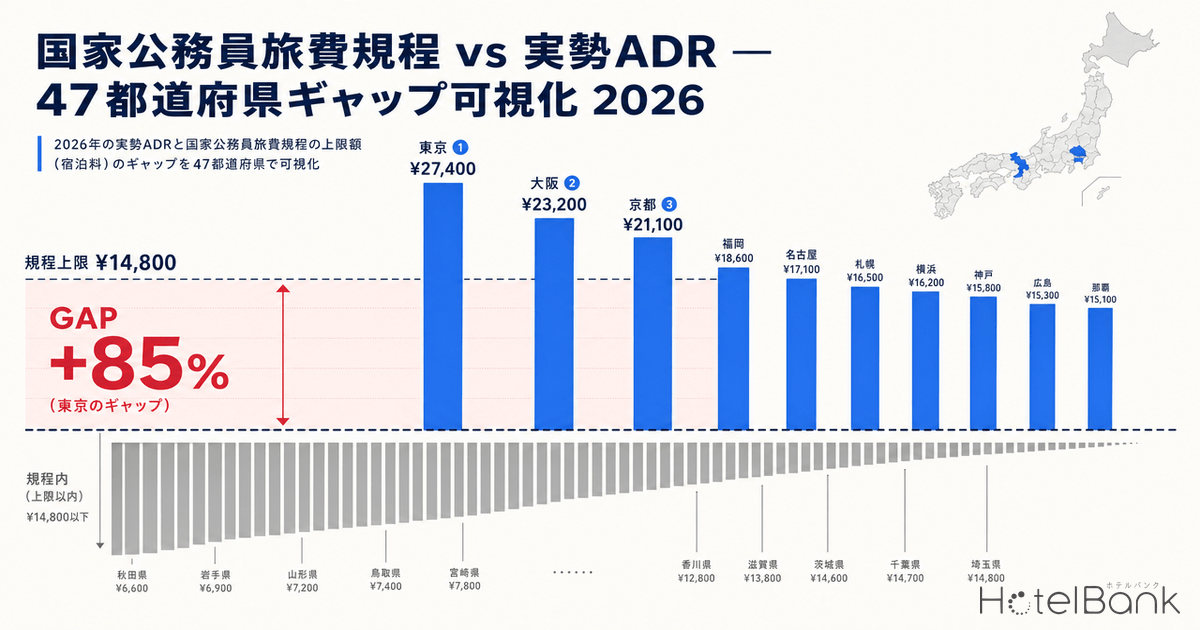

The amended Travel Expenses Act, which took effect in April 2025, fundamentally restructured lodging allowances for national civil servants into a “12-tier prefecture-based capped actual-cost reimbursement” system. As corporate HR and accounting teams grapple with how to revise their own travel expense regulations, comparison against actual market rates has become indispensable. In this article, we lay the post-amendment per-prefecture lodging allowance limits (general staff) side-by-side with the market single-occupancy ADR for business hotels across all 47 prefectures, as compiled by MetroEngines Research, and visualize the gaps. To preview the conclusion: while the regulatory caps in major cities sit comfortably above market rates, in tourism-driven regional areas an inversion is emerging where market rates exceed the caps.
Metric Definitions Used in This Article
- ADR (Average Daily Rate): Average of advertised prices published on OTAs and similar channels. Differs from actual transacted rates. Per-room rate (tax included) for double-occupancy use, averaged across all plans (room-only through meals-included).
- Data source: MetroEngines Research
What Changed Under the Amended Travel Expenses Act
Before the amendment, the National Civil Servant Travel Expense Regulations paid lodging on a fixed-rate basis using a three-tier classification (“Region A / Region B / Region C”). As inbound tourism expanded and labor and construction costs pushed hotel rates higher, the divergence between the fixed allowances and actual market prices became increasingly visible, and out-of-pocket payments by traveling employees turned into the norm — a problem widely flagged.
The April 2025 amendment scrapped this three-tier system and shifted to a “12-tier capped actual-cost reimbursement” framework with a separate cap for each of the 47 prefectures. The structure is also stratified into three job-grade layers; for general staff (those at job grade 10 or below), the highest cap is ¥19,000 for Saitama, Tokyo, and Kyoto, while the lowest is ¥8,000 for Fukushima, Tottori, and Yamaguchi. With a market-reflective framework now in place, blanket nationwide application has become a thing of the past.
| Cap Amount | Applicable Prefectures | Count |
|---|---|---|
| ¥19,000 | Saitama, Tokyo, Kyoto | 3 |
| ¥18,000 | Fukuoka | 1 |
| ¥17,000 | Chiba | 1 |
| ¥16,000 | Kanagawa, Niigata | 2 |
| ¥15,000 | Kagawa | 1 |
| ¥14,000 | Kumamoto | 1 |
| ¥13,000 | Hokkaido, Gifu, Osaka, Hiroshima | 4 |
| ¥12,000 | Yamanashi, Hyogo, Miyazaki, Kagoshima | 4 |
| ¥11,000 | Aomori, Akita, Ibaraki, Toyama, Nagano, Aichi, Shiga, Nara, Wakayama, Kochi, Saga, Nagasaki, Oita, Okinawa | 14 |
| ¥10,000 | Miyagi, Yamagata, Tochigi, Gunma, Fukui, Okayama, Tokushima, Ehime | 8 |
| ¥9,000 | Iwate, Ishikawa, Shizuoka, Mie, Shimane | 5 |
| ¥8,000 | Fukushima, Tottori, Yamaguchi | 3 |
Source: Ministry of Finance, “Travel Allowance Regulations for National Civil Servants,” Appended Table 2 (job grade 10 or below); compiled by HotelBank Editorial Team
What stands out is the stride between tiers. The gap between the highest cap of ¥19,000 and the lowest of ¥8,000 reaches ¥11,000 — a roughly 2.4x spread. Even granted that the new mechanism reflects regional market realities, this differential carries enough weight to fundamentally change how travel regulations are administered. Applied to the travel policies of private companies that currently set a single nationwide lodging cap, this means caps must be reviewed location by location — otherwise both employee out-of-pocket exposure and over-reimbursement risk will arise.
Market Single ADR Across 47 Prefectures: February-March 2026 Reality
Next, we turn to the actual market single-occupancy ADRs for business hotels in February-March 2026, as compiled by MetroEngines Research. To align units with corporate travel regulations, this analysis is restricted to the business hotel category and single-occupancy use (single-room equivalent). Coverage spans all 47 prefectures, N=88,200 plans, with roughly 350-900 properties per prefecture.
Source: MetroEngines Research; compiled by HotelBank Editorial Team
Tokyo tops the country at ¥15,562, more than double the lowest figure — Tokushima at ¥7,294. Kyoto (¥13,943), Okinawa (¥13,140), and Kanagawa (¥12,693) follow, painting a picture in which the upper rankings are dominated by cities that combine tourism and business demand, alongside regional tourism hubs. Conversely, parts of Tohoku, Shikoku, and Chugoku still hold market ADRs in the high ¥7,000s to low ¥8,000s, meaning room-only stays for business travel remain in an affordable price band.
Regulation vs Market Gap: Visualizing Within-Cap and Over-Cap Prefectures
This is the core analysis of the article. For each of the 47 prefectures, we calculated the difference and the percentage overage between the amended Travel Expenses Act lodging cap (general staff) and the market single-occupancy ADR.
Source: Ministry of Finance “Travel Allowance Regulations for National Civil Servants” and MetroEngines Research; compiled by HotelBank Editorial Team
The result is unexpected. Of the 47 prefectures, only 7 saw market ADR exceed the regulatory cap. The remaining 40 fell within the cap. The largest overage is Okinawa at +19.5%, followed by Okayama at +10.8% and Tottori at +9.4% — all regional cities where market rates have been pushed up by tourism-led demand concentration.
Conversely, prefectures expected to show large overages — Tokyo (market ¥15,562 vs cap ¥19,000, -18.1%), Osaka (¥10,644 vs ¥13,000, -18.1%), and Fukuoka (¥9,590 vs ¥18,000, -46.7%) — actually sit comfortably within the cap with significant headroom. This can be read as the effect of the 2025 amendment, which raised metropolitan caps in one decisive move.
A 4-Zone Map of the 47 Prefectures
We classified the regulation-vs-market gap into the following four zones.
| Zone | Definition | Count | Main Prefectures |
|---|---|---|---|
| Zone 1 | Within cap (market ADR ≤ cap) | 40 | Tokyo, Osaka, Kyoto, Fukuoka, Chiba, Kanagawa, Hokkaido, etc. |
| Zone 2 | Overage ≤ 20% | 7 | Okinawa, Okayama, Tottori, Shizuoka, Ishikawa, Nara, Shimane |
| Zone 3 | Overage 20-50% | 0 | None |
| Zone 4 | Overage > 50% | 0 | None |
Source: Ministry of Finance “Travel Allowance Regulations for National Civil Servants” and MetroEngines Research; compiled by HotelBank Editorial Team
Source: Ministry of Finance “Travel Allowance Regulations for National Civil Servants” and MetroEngines Research; compiled by HotelBank Editorial Team
The fact that the majority of prefectures land within the cap suggests the amended Travel Expenses Act carefully reflected market reality. There is, however, an important caveat. The market ADRs in this article are averages of “advertised prices,” and in high-demand windows the actual transacted rates often run higher. On weekends, holidays, and major event dates, prices commonly run 1.5x to 2x weekday levels, so even prefectures nominally within the cap can absolutely exceed it on peak days.
The 7 Over-Cap Prefectures: Tourism Demand Pushing Up Regional ADRs
What do the 7 over-cap prefectures have in common? The table below details them in order of overage rate.
| Prefecture | Cap | Market ADR | Difference | Overage | YoY |
|---|---|---|---|---|---|
| Okinawa | ¥11,000 | ¥13,100 | +¥2,100 | +19.5% | +16.3% |
| Okayama | ¥10,000 | ¥11,100 | +¥1,100 | +10.8% | +51.0% |
| Tottori | ¥8,000 | ¥8,800 | +¥800 | +9.4% | +3.9% |
| Shizuoka | ¥9,000 | ¥9,300 | +¥300 | +3.6% | -8.5% |
| Ishikawa | ¥9,000 | ¥9,300 | +¥300 | +3.3% | +0.6% |
| Nara | ¥11,000 | ¥11,200 | +¥200 | +1.7% | +13.7% |
| Shimane | ¥9,000 | ¥9,100 | +¥100 | +1.4% | +7.1% |
Source: Ministry of Finance “Travel Allowance Regulations for National Civil Servants” and MetroEngines Research; compiled by HotelBank Editorial Team
Okinawa is the textbook case. Its ¥11,000 cap sits in the same bracket as Aomori and Akita, yet its market single-occupancy ADR of ¥13,140 places it within the top 5 nationally. Because resort and business demand compete in the same lodging supply pool, price levels are pulled up even within the business hotel category. With YoY growth of +16.3% — well above the national average of +6.1% — the gap with the regulatory cap is likely to widen further.
Okayama’s +51.0% YoY stands out. This suggests that the prior-year sample contained many low-priced offerings, while in February-March 2026, concentrated event and tourism demand drove a higher share of upper-band plans into the market. The ¥10,000 cap is failing to keep pace with market dynamics, and companies that frequently send travelers to Okayama need to be operationally cautious.
The other 5 over-cap prefectures (Tottori, Shizuoka, Ishikawa, Nara, Shimane) sit at modest overages of 1-10%, but all overlap with tourism demand, and peak-season market rates tend to push higher still. For corporations with frequent travel to these destinations, locking in caps via annual corporate-rate contracts is a realistic option.
Major Cities Have Cap Headroom: Operations Must Prevent “Spending to the Cap”
Another important finding is the wide gap between regulatory caps and market rates in major cities. The chart below shows the differential for the 10 prefectures with the highest caps.
Source: Ministry of Finance “Travel Allowance Regulations for National Civil Servants” and MetroEngines Research; compiled by HotelBank Editorial Team
Saitama (cap ¥19,000 vs market ¥9,789, -48.5%) and Fukuoka (¥18,000 vs ¥9,590, -46.7%) show the most pronounced headroom. Niigata also runs -45.9% under cap, and Kagawa and Kumamoto exceed 30% headroom as well. The pattern: high caps were assigned to major cities and regional core cities, but the market single-occupancy ADRs in the business hotel category have not caught up.
For corporate travel-policy operations, this “headroom” is a double-edged sword. On one hand, employees can book within the cap with peace of mind. On the other, the structure can encourage “spending to the cap” — booking near the upper limit. The regulatory framework actually creates an incentive to deliberately pick plans nearly twice as expensive as market rates. HR and accounting departments should monitor market ADRs and, where appropriate, codify an internal guideline that “excessively high-priced plans should be avoided.”
ADR Uptrend: Cap Headroom May Shrink Going Forward
Looking at the single-ADR change between February-March 2025 and February-March 2026, the national average is up +6.1% YoY. The amended Travel Expenses Act framework was calibrated to the market reality at the time of its April 2025 enactment, but ADRs have continued to climb in the year since — a development that warrants attention.
Source: MetroEngines Research; compiled by HotelBank Editorial Team
The most pronounced increases come from regional tourism areas: Okayama (+51.0%), Okinawa (+16.3%), Nara (+13.7%), Yamanashi (+11.4%), and Kagawa (+11.1%). Prices in these regions are rising faster than the benchmarks set in April 2025, and the possibility cannot be ruled out that this will trigger framework-revision debates within 2026. Conversely, in places that benefited from large events the prior year — Osaka (-6.3%), Hokkaido (-5.5%), Shizuoka (-8.5%) — pullbacks are evident. These are important signals for judging when to revisit corporate travel regulations.
Four Response Strategies for Corporations
The 12-tier prefecture-based system in the amended Travel Expenses Act is a public-sector rule, but a growing number of private companies are using it as a reference benchmark for their own travel policies. This section organizes four practical responses for HR and accounting teams to consider.
Response 1: Revise Internal Caps to Match Market Rates
The most direct response is to raise internal cap amounts in line with market rates. The data in this article shows market ADRs rising rapidly in regional tourism destinations — Okinawa, Nara, Yamanashi, and others — and a static cap will normalize employee out-of-pocket payments. A practical approach is to adopt the prefecture-based caps under the amended Travel Expenses Act as a benchmark and revise them progressively, starting with the regions of heaviest travel volume. Note, however, that policy changes require coordination with HR and an assessment of expense-budget impact, so execution typically takes several months.
Response 2: Negotiated Discounts (Corporate Rates, Annual Contracts)
For high-frequency travel destinations, securing corporate rates through annual contracts with specific hotel chains is highly effective. Many business-hotel chains offer corporate discounts of 10-30%, allowing stable bookings within the regulatory cap. Where travel concentrates on individual properties — Okinawa, Fukuoka, and similar markets — direct contracts with local hotel chains are also viable. The benefit grows with the predictability of annual booking volume.
Response 3: Adopt a BTM (Business Travel Management) Service
A growing number of companies are adopting Business Travel Management (BTM) services. BTM providers can often secure rates lower than individual booking by aggregating across multiple hotel contracts. They also centralize travel data, enabling internal benchmarks of regional ADRs that can serve as evidence for policy revisions. The Japan Tourism Agency’s “Sustainable Tourism Indicators” (KPIs) and similar regional market-rate datasets provide useful complementary information.
Response 4: Flat-Rate Schemes / Travel Allowances as Alternatives
Companies that prefer simple operations over policy granularity sometimes adopt schemes such as a “uniform travel stipend” or a “flat allowance bundled into per-diem.” These simplify expense processing, but cannot reflect regional differences, leaving employees in regional tourism destinations exposed to out-of-pocket costs. They also run counter to the broader shift the amended Travel Expenses Act represents — from flat-rate to actual-cost reimbursement — so the impact on younger employees’ motivation and on competitive positioning in the talent market warrants careful judgment.
Conclusion: Continuous Monitoring of Regulation vs Market Is the Key
The implications of the analysis are clear. First, the April 2025 amended Travel Expenses Act carefully reflects market reality, with 40 of 47 prefectures showing market single ADR within the cap. Second, while only 7 prefectures exceed the cap, all are regional cities pushed up by tourism demand, and the overage gap will likely expand. Third, in major cities the gap between cap and market rate is wide, and operational guidelines are needed to steer employee booking behavior.
For corporate HR and accounting teams, the most important point is to treat the relationship between regulation and market rates not as “set once and done,” but with the discipline of “monitoring on a continuous basis.” Market datasets like the ones cited here (MetroEngines Research) are updated monthly and quarterly; embedding them as internal KPIs makes them effective inputs for timing-revision decisions and cost-optimization analyses. Treating the amended Travel Expenses Act framework not as a “civil-service rule” but as a strategic reference point in your own travel-policy design will become the new standard for corporate travel management.