

When the industry talks about new supply pressure, the common currency has long been “how many rooms are being added.” Yet the same 10,000 rooms mean very different things depending on their vintage. A market where most of that stock was built after 2015 poses a completely different question to investors than one where more than half dates from before 1996. In the former, the question is whether there is room for a new entrant. In the latter, it is how to rebuild what already exists.
This report cuts the hotel stock of 32 cities (4,868 properties, 225,764 rooms) — prefectural capitals, central wards of government-designated cities, and major core cities outside the three largest metropolitan areas — not by volume but by year of opening. It then overlays the forward construction pipeline and estimated settled ADR to quantify where the “renewal headroom that volume alone cannot reveal” has accumulated most thickly.
Metric Definitions Used in This Article
- ADR (average daily rate): an estimated settled rate (tax-excluded equivalent), derived by applying a segment-specific adjustment coefficient to the lowest publicly listed plan level each property posts on OTAs (two guests per room, per-room price, tax included). Cross-checked against property-level disclosures from a listed hotel REIT (Invincible Investment Corporation) — across 184 property-months in April–May 2026, the median deviation was 7.5% (6.0% for business and city hotels). These are estimates and differ from each property’s actual transacted rates and accounting figures. City-level ADR in this report is the 12-month average for July 2025–June 2026 (all segments, median basis across covered properties).
- Vintage mix: the room-weighted share of three brackets — “2015 or later,” “1997–2014,” and “pre-1996” — based on each property’s opening year. The denominator is the room count of properties whose opening year could be identified.
- Opening-year coverage: the share of covered properties in a city whose opening year could be identified (property-count basis).
- Renewal headroom index: a simple in-house indicator defined as “share of rooms opened pre-1996 (%) − forward pipeline as a share of existing rooms (%).” The older the existing stock and the thinner the new supply, the higher the value.
- Data source: MetroEngines Research & Consulting
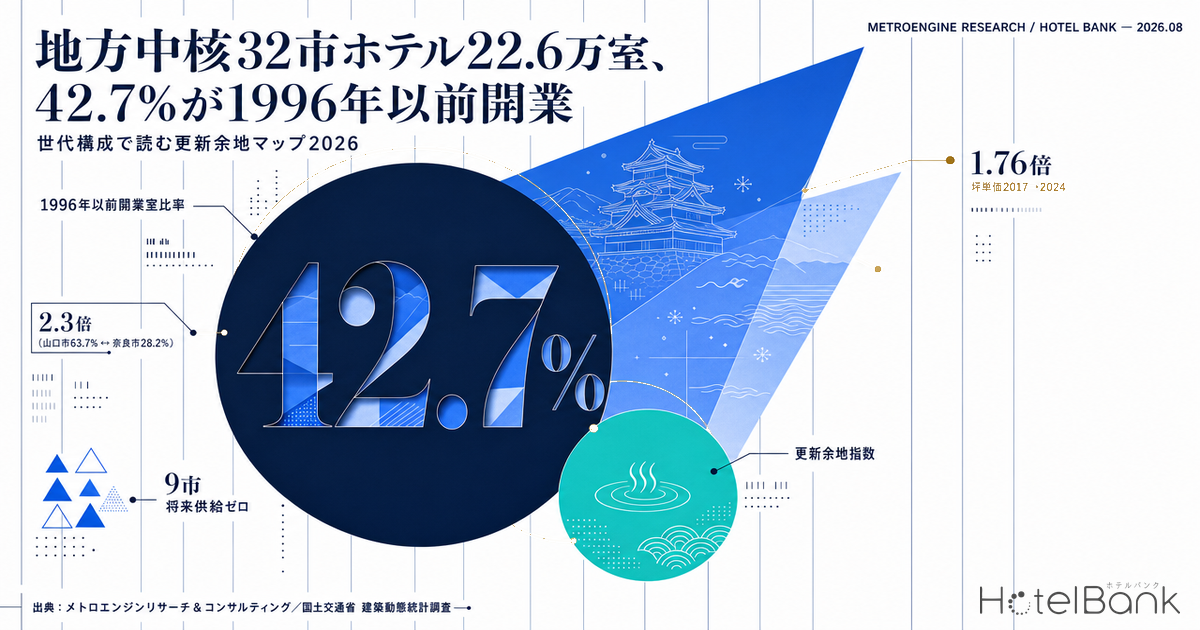
- — Of the 225,800 rooms across 32 regional core cities, 42.7% opened before 1996. Even at comparable room counts, the depth of renewal headroom ranges from 63.7% in Yamaguchi to 27.4% in Wakayama — a 2.3x spread.
- — In 9 of the 26 core cities (Yamaguchi, Matsumoto, Morioka, Kofu, Tsu, Matsue, Aomori, Gifu and Oita) no forward construction plans could be identified, so new-build replacement is not arriving for the time being.
- — Matsumoto is 54.8% pre-1996 yet posts an estimated settled ADR of ¥13,415, the highest of the 26 core cities. “Old stock plus rate power” is the combination in which the economics of renewal stand up most readily.
- — Construction cost per tsubo for lodging buildings is 1.76x its 2017 level (approx. ¥1.96M in 2024). A higher new-build hurdle is lifting the relative value of existing stock.
- — The top four renewal-headroom cities hold their classification even if unfiled pipeline is assumed to add up to 3 percentage points, but all four drop out at +4 points. That is where the robustness boundary sits.
The same “10,000 rooms” are not the same inside — cutting 32 cities by vintage
The scope covers 32 cities including Kanazawa, Matsuyama, Kagoshima, Miyazaki, Nagasaki, Toyama, Takamatsu, Utsunomiya, Matsumoto, Hakodate and Aoba Ward in Sendai. Extracting operating properties with a known room count, within the range MetroEngines Research covers, yields 4,868 properties and 225,764 rooms. Of that, opening year could be identified for 209,625 rooms (92.9%) on a room-count basis.
Weighting this population by rooms and splitting it by vintage, 25.2% opened in 2015 or later, 32.0% between 1997 and 2014, and 42.7% before 1996. In other words, more than four in ten hotel rooms in Japan’s regional core cities are still supplied by buildings that are over 30 years old.
The average itself, however, means little. What matters is that the dispersion across cities is extreme. The share of rooms opened before 1996 runs from 63.7% in Yamaguchi to 27.4% in Wakayama — a 2.3x spread. Conversely, newer rooms opened in 2015 or later account for 49.1% in Nara and 43.0% in Kanazawa, but only 7.8% in Saga and 10.6% in Mito. Cities that were rebuilt in one wave on the back of Shinkansen extensions and tourism demand sit alongside cities where no significant turnover has occurred in more than 20 years — all under the same label of “regional core city.”
Only the 26 cities with opening-year coverage of 75% or higher are shown, ordered from the highest pre-1996 share downward.
Disclosing the population — this is about properties with an identified opening year, not a full census
This analysis requires an upfront disclosure. Opening year is not known for every property. Coverage by city (property-count basis) ranges from 97.5% in Matsue to 48.1% in Akita. In cities with low coverage, the possibility that unidentified properties cluster in a particular vintage cannot be excluded, so the ratios need to be read with care.
Accordingly, this report treats the 26 cities with opening-year coverage of 75% or higher as the primary analytical set, and presents the remaining six (Otsu 61.5%, Yamagata 61.4%, Tokushima 68.4%, Tottori 61.6%, Kagoshima 69.6%, Akita 48.1%) for reference only. Every definitive statement in the text rests on the 26 cities. The figures are not a full census but an aggregation limited to properties whose opening year MetroEngines Research could identify.
The reference group still carries signal. Within the range identified, Otsu is 65.5% pre-1996 — the highest of all 32 cities — with only 6.5% opened in 2015 or later. Even with the 61.5% coverage caveat, a market adjacent to Kyoto where stock turnover has not occurred merits further investigation.
Overlaying the forward pipeline — where “old and thin” is concentrated
Vintage mix alone does not make an investment case. If a wave of new-builds is about to land on top of old stock, that is not renewal headroom but a signal of intensifying competition. So we overlaid each city’s forward supply — projects with a completion date still ahead as of August 2026 — drawn from building-plan data in the Ministry of Land, Infrastructure, Transport and Tourism’s Building Construction Dynamics Statistics Survey.
The result was unambiguous. In 9 of the 26 core cities (Yamaguchi, Matsumoto, Morioka, Kofu, Tsu, Matsue, Aomori, Gifu and Oita) no forward construction plans could be identified. Only four cities have a pipeline exceeding 5% of existing stock: Fukui (11.5%), Kochi (9.0%), Saga (6.3%) and Aoba Ward in Sendai (6.0%).
Crossing these two axes brings the markets with thick renewal headroom into focus. Yamaguchi at 63.7% pre-1996 with a zero pipeline; Matsumoto at 54.8% with zero; Morioka at 53.2% with zero; Matsue at 48.4% with zero. All are markets where the existing stock is old and new-build replacement is not arriving in the near term. Koriyama, at 62.9% against a thin 3.1% pipeline, has the same character.
The lower right (high pre-1996 share, thin pipeline) is the zone of greatest renewal headroom in existing stock. Note: forward supply is on a building-permit basis at the time of the survey. Counts and room numbers are expected to rise as further permits are filed, so read this as a floor for the currently confirmed pipeline.
A Thick renewal headroom
Pre-1996 above 50% x pipeline at or below the 3% range
Yamaguchi, Koriyama, Matsumoto, Morioka. With no new-build replacement arriving for now, renovation and conversion of existing buildings is effectively the only route to refreshing supply.
B Renewal and new-build in parallel
Pre-1996 in the 40% range x pipeline of roughly 4-12%
Fukui, Kochi, Matsuyama, Hakodate, Toyama. Renewal headroom exists, but new supply is coming up at the same time. Timing of entry is what matters here.
C Generational turnover already under way
2015 or later above 30%
Nara 49.1%, Kanazawa 43.0%, Hakodate 32.2%. Markets substantially replaced over the past decade. The issue here is not renewal headroom but head-to-head competition with newer stock.
Overlaying estimated settled ADR — renewal economics stand up where rate power exists
Renewal headroom is not an investment theme on its own. What determines the economics is whether the renovated rooms can command a rate. So we overlaid each city’s estimated settled ADR over the 12 months from July 2025 to June 2026.
What stands out is that old stock and high rates do coexist in some cities. Matsumoto is 54.8% pre-1996, yet its estimated settled ADR of ¥13,400 is the highest of the 26 core cities. Matsue follows at 48.4% and ¥12,800, approaching Nara’s ¥13,200. Both are markets that include onsen and leisure demand, and the segment mix does lift ADR — but the fact that this rate level holds even in older buildings is the starting point for sizing the upside after renewal.
Conversely, Koriyama, with a thick 62.9% pre-1996 share, posts an estimated settled ADR of ¥7,400, and Morioka ¥7,300 at 53.2% — modest rate levels. Renewal in these markets is likely to be fought less over rate uplift than over lifting occupancy through a reworked room mix and improving operating efficiency. Even within the same “large renewal headroom” bucket, the investment blueprint for the Matsumoto/Matsue type is entirely different from the Koriyama/Morioka type.
Construction costs raised the new-build hurdle — cost per tsubo is 1.76x its 2017 level
Behind the growing interest in existing stock is a structural rise in the hurdle rate for new construction. Dividing planned construction cost by floor area for lodging buildings on a construction-start basis, from MLIT’s Building Construction Dynamics Statistics Survey, gives a cost per tsubo that rose from approximately ¥1.11M in 2017 to approximately ¥1.96M in 2024 — 1.76x. Even against the roughly ¥1.39M of 2022, that is a 41% increase. How that +41% is itself cutting into 2027-2029 opening plans is tracked region by region in Construction +41% & Labor Crunch Erase Japan’s 2027-2029 Hotel Supply.
This picture is consistent with market-side observation. As of December 2025, JLL noted that rising construction costs make a substantial new-build supply increase unlikely over the next several years, and that Japan’s new supply rate stands at 1.7% of existing rooms — low even within Asia Pacific (Vietnam leads the region at 21.3%). Major cities sit at roughly 2%, with growth markets such as Sapporo at around 5% and Okinawa at around 7%.
If new-build is hard to bring in, the relative value of existing stock rises. In practice, regional cities are seeing a shift toward regeneration and conversion of existing mid-scale stock. The markets identified here — where pre-1996 rooms make up a majority and the new-build pipeline is thin — are precisely the locations where this shift bites hardest. As for where the line falls between renovation investment and new construction, that boundary can be examined from both the investment cost per room and the resulting ADR lift.
Cost per tsubo is planned construction cost on a construction-start basis divided by floor area, so it is sensitive to the year’s project mix (whether large or high-specification projects are present). Note in particular that 2024 floor area swelled to roughly 1.9x the prior year, a large contribution from major projects.
That said, even looking only at the gradual climb from 2017 to 2023 (¥1.11M to ¥1.38M), the increase is 24% — the structural step-up in construction costs itself is not in doubt.
The 32-city map — geographic skew in vintage and supply
The map below plots the 32 cities as circles. Circle size represents total rooms and color represents the share of rooms opened before 1996. Darker circles indicate older existing stock and thicker renewal headroom.
Dark circles line up along the Sea of Japan coast through Tohoku and San’in, while cities rebuilt on tourism demand such as Kanazawa and Nara are pale. The pattern reflects less geographic continuity than whether a city has had a major demand event in the past decade — a Shinkansen extension, a tourism initiative, or a large redevelopment.
Data table for the 26 core cities — by renewal headroom index
| City | Total rooms | Opening-year coverage |
2015 or later | 1997- 2014 | Pre- 1996 |
Forward supply | % of existing | Est. settled ADR | Renewal headroom |
|---|---|---|---|---|---|---|---|---|---|
| Yamaguchi | 3,953 | 93.6% | 14.1% | 22.2% | 63.7% | 0 | 0.0% | ¥8,318 | 63.7 |
| Koriyama | 6,163 | 78.1% | 19.2% | 17.9% | 62.9% | 192 | 3.1% | ¥7,410 | 59.8 |
| Matsumoto | 8,145 | 86.3% | 20.6% | 24.6% | 54.8% | 0 | 0.0% | ¥13,415 | 54.8 |
| Morioka | 6,379 | 87.5% | 21.4% | 25.4% | 53.2% | 0 | 0.0% | ¥7,269 | 53.2 |
| Kofu | 3,852 | 89.2% | 12.8% | 38.2% | 49.0% | 0 | 0.0% | ¥7,677 | 49.0 |
| Tsu | 3,230 | 92.0% | 16.4% | 34.7% | 49.0% | 0 | 0.0% | ¥7,743 | 49.0 |
| Matsue | 6,491 | 97.5% | 18.7% | 32.9% | 48.4% | 0 | 0.0% | ¥12,807 | 48.4 |
| Nagasaki | 9,507 | 92.1% | 26.4% | 24.4% | 49.2% | 313 | 3.3% | ¥10,293 | 45.9 |
| Miyazaki | 9,812 | 80.7% | 28.5% | 26.6% | 44.8% | 41 | 0.4% | ¥8,063 | 44.4 |
| Saga | 2,868 | 87.1% | 7.8% | 42.4% | 49.9% | 180 | 6.3% | ¥9,942 | 43.6 |
| Matsuyama | 10,552 | 90.3% | 29.0% | 23.7% | 47.3% | 454 | 4.3% | ¥9,972 | 43.0 |
| Takasaki | 4,525 | 88.5% | 12.1% | 43.1% | 44.8% | 179 | 4.0% | ¥7,319 | 40.8 |
| Aomori | 5,871 | 82.5% | 24.7% | 35.0% | 40.2% | 0 | 0.0% | ¥10,044 | 40.2 |
| Takamatsu | 8,867 | 85.2% | 27.9% | 31.8% | 40.3% | 92 | 1.0% | ¥8,374 | 39.3 |
| Hakodate | 12,298 | 87.3% | 32.2% | 25.0% | 42.9% | 478 | 3.9% | ¥8,752 | 39.0 |
| Utsunomiya | 8,607 | 75.6% | 27.1% | 30.9% | 41.9% | 300 | 3.5% | ¥7,381 | 38.4 |
| Toyama | 8,946 | 88.8% | 24.6% | 34.2% | 41.2% | 432 | 4.8% | ¥6,871 | 36.4 |
| Gifu | 4,207 | 83.1% | 15.7% | 48.2% | 36.1% | 0 | 0.0% | ¥8,204 | 36.1 |
| Kochi | 6,670 | 82.8% | 17.2% | 39.8% | 43.0% | 602 | 9.0% | ¥7,827 | 34.0 |
| Oita | 7,513 | 76.8% | 25.2% | 41.2% | 33.5% | 0 | 0.0% | ¥6,968 | 33.5 |
| Fukui | 4,621 | 86.3% | 23.6% | 31.8% | 44.6% | 530 | 11.5% | ¥8,625 | 33.1 |
| Mito | 4,328 | 82.1% | 10.6% | 54.2% | 35.1% | 136 | 3.1% | ¥7,802 | 32.0 |
| Kanazawa | 17,831 | 82.5% | 43.0% | 26.4% | 30.6% | 226 | 1.3% | ¥10,309 | 29.3 |
| Wakayama | 4,331 | 87.1% | 30.5% | 42.1% | 27.4% | 20 | 0.5% | ¥7,164 | 26.9 |
| Sendai (Aoba Ward) | 14,324 | 83.7% | 23.0% | 45.1% | 31.9% | 863 | 6.0% | ¥9,644 | 25.9 |
| Nara | 6,787 | 89.5% | 49.1% | 22.7% | 28.2% | 277 | 4.1% | ¥13,170 | 24.1 |
Reference listing: the six cities with opening-year coverage below 75%. Because population bias cannot be excluded, they are omitted from the definitive statements in the text.
| City | Total rooms | Opening-year coverage |
2015 or later | 1997- 2014 | Pre- 1996 |
Forward supply | % of existing | Est. settled ADR | Renewal headroom |
|---|---|---|---|---|---|---|---|---|---|
| Otsu | 3,683 | 61.5% | 6.5% | 28.0% | 65.5% | 0 | 0.0% | ¥12,573 | 65.5 |
| Tokushima | 4,361 | 68.4% | 13.9% | 30.0% | 56.1% | 130 | 3.0% | ¥6,256 | 53.1 |
| Yamagata | 5,545 | 61.4% | 15.4% | 27.2% | 57.4% | 253 | 4.6% | ¥12,250 | 52.8 |
| Tottori | 3,535 | 61.6% | 32.2% | 18.5% | 49.4% | 108 | 3.1% | ¥8,058 | 46.3 |
| Kagoshima | 12,387 | 69.6% | 27.3% | 37.7% | 35.0% | 74 | 0.6% | ¥6,845 | 34.4 |
| Akita | 5,575 | 48.1% | 19.6% | 47.0% | 33.5% | 383 | 6.9% | ¥7,355 | 26.6 |
Robustness of the classification — sensitivity to unfiled pipeline and thresholds
The classification so far takes building-permit-based forward supply as given. But as this report itself notes, permits are normally filed one to two years before opening, so the pipeline is structurally understated the further out the year. We therefore tested where the roster of thick-renewal-headroom markets (class A: pre-1996 above 50% and pipeline at or below the 3% range) breaks down if we assume that supply not yet filed is added uniformly across all cities.
| City | Pre- 1996 | Base pipeline |
Central (+0pt) | Cautious (+3pt) | Conservative (+6pt) |
|---|---|---|---|---|---|
| Yamaguchi | 63.7% | 0.0% | 63.7 / A | 60.7 / A | 57.7 / — |
| Koriyama | 62.9% | 3.1% | 59.8 / A | 56.8 / — | 53.8 / — |
| Matsumoto | 54.8% | 0.0% | 54.8 / A | 51.8 / A | 48.8 / — |
| Morioka | 53.2% | 0.0% | 53.2 / A | 50.2 / A | 47.2 / — |
| Matsue | 48.4% | 0.0% | 48.4 / — | 45.4 / — | 42.4 / — |
The number of cities remaining in class A is four at +0pt, three between +1 and +3pt (Yamaguchi, Matsumoto, Morioka), and zero at +4pt or above. In other words, this classification rests on the premise that unfiled supply amounts to no more than about 3 points of existing stock; beyond that, the grouping “markets with thick renewal headroom” ceases to hold. Koriyama, already close to the boundary at 3.1% in the base case, drops out at +1pt — a point that warrants caution in investment decisions.
It is also worth checking sensitivity to the definition of the classification itself. The table below shows how many cities qualify when the two thresholds defining class A (pre-1996 share and pipeline share) are varied.
| Pre-1996 \ Pipeline | 2% or less | 4% or less | 6% or less | 8% or less |
|---|---|---|---|---|
| Over 40% | 9 | 14 | 16 | 17 |
| Over 45% | 6 | 8 | 9 | 10 |
| Over 50% | 3 | 4 | 4 | 4 |
| Over 55% | 1 | 2 | 2 | 2 |
| Over 60% | 1 | 2 | 2 | 2 |
In the row for pre-1996 above 50%, doubling the pipeline threshold from 4% to 8% leaves the count unchanged at four cities. What actually determines this classification is the vintage threshold, not the supply threshold, so there is little need to agonize over how the pipeline is measured. On the vintage side, by contrast, merely loosening the threshold from above 50% to above 45% doubles the qualifying set from four cities to eight (adding Kofu, Tsu, Matsue and Nagasaki). Where you draw the line for “thick renewal headroom” materially changes how wide the target market becomes.
Implications for investors and development teams
The single conclusion from this analysis is that measuring supply by room count alone misses something. Kanazawa’s 17,831 rooms and Hakodate’s 12,298 both represent substantial stock for regional core cities, but with 43.0% and 32.2% respectively opened in 2015 or later, the questions left open in each market are not the same.
Markets with thick renewal headroom share three conditions. First, rooms opened before 1996 account for roughly half the stock. Second, the permit-based new-build pipeline is thin. Third, the existing rate level is high enough to recover renovation investment, or there is clear headroom to improve operating efficiency. Where all three hold, acquiring and regenerating existing buildings can be a more rational choice than entering via new construction, in a cost environment of ¥1.96M per tsubo — and the economics of acquiring an existing building and changing its use are set out from the perspective of acquisition cost and yield in Corporate Retreat Conversions: 8.27% GOP Yield Across 5 Onsen Areas.
There are caveats. Forward supply data is on a building-permit basis, and because permits are normally filed one to two years before opening, figures for 2028 and beyond are structurally understated. “Zero pipeline” does not guarantee that no new-build will arrive. It should be read as a floor for the pipeline confirmable today. Likewise, it bears repeating that the opening-year data is not a full census but an aggregation limited to properties that could be identified.
Even so, the vintage lens makes visible differences in market character that a volume-based discussion cannot. The next time you screen markets for development potential, it is well worth placing “when was it built” alongside “how many rooms are there.”
Related reading
- Supply Absorption Capacity in 8 Regional Core Cities — GW2026 Sellout Rates x New Openings
- Frozen Pipeline & the Supply Gap: Cancelled Hotel Projects and Investor Implications
- 582 Hotels Opening 2026: 30-Room Luxury vs 200+ Scale Polarization
- Policy Rate 1.00%: Break-Even ADR Across Japan’s 8 Hotel Markets
- Construction +41% & Labor Crunch Erase Japan’s 2027-2029 Hotel Supply
- Corporate Retreat Conversions: 8.27% GOP Yield Across 5 Onsen Areas
References and Sources
■ Data sources
The scope is 32 cities — prefectural capitals, central wards of government-designated cities, and major core cities outside the three largest metropolitan areas. The population is 4,868 operating properties with a known room count, totaling 225,764 rooms, of which the 209,625 rooms (92.9%) with an identified opening year were aggregated into vintage brackets weighted by room count. Estimated settled ADR is the 12-month average for July 2025-June 2026 (all segments, median basis). Forward supply is compiled by city from building-plan data in MLIT’s “Building Construction Dynamics Statistics Survey,” limited to projects whose completion date was still ahead as of August 2026. Cost per tsubo is calculated by dividing planned construction cost for lodging buildings by floor area, from e-Stat statistics ID 0003114490 (2017-2024).
■ Calculation assumptions
The renewal headroom index is the simple difference between “share of rooms opened pre-1996 (%)” and “forward pipeline as a share of existing rooms (%).” It is not a measure of investment yield or business viability. Class A (thick renewal headroom) is defined as “pre-1996 above 50% and pipeline at or below the 3% range.” The sensitivity analysis assumes that pipeline not yet captured, due to the timing lag in permit filings, is added uniformly across all cities in a range of +1 to +6 points; these increments are not measured unfiled projects. City-level ADR is not adjusted for differences in segment mix, so cities with onsen and leisure demand cannot be compared on the same footing as cities driven mainly by business demand.
■ Limitations and caveats
Opening year is not captured for every property; coverage by city ranges from 48.1% to 97.5%. In cities with low coverage, the possibility that uncaptured properties cluster in a particular vintage cannot be excluded, so the six cities below 75% are presented for reference only and excluded from the definitive statements in the text. Forward supply is on a building-permit basis, and because permits are normally filed one to two years before opening, 2028 onward is structurally understated. “Zero pipeline” does not guarantee that no new-build will arrive, and must be read as a floor for the pipeline confirmable today. Cost per tsubo is affected by the project mix on a construction-start basis; note in particular that 2024 floor area swelled to roughly 1.9x the prior year, a large contribution from major projects. Estimated settled ADR is an estimate and differs from each property’s actual transacted rates and accounting figures.
■ Market data
- MetroEngines Research & Consulting — property-level opening year and room counts (32 cities, 4,868 properties, 225,764 rooms, of which 209,625 rooms have an identified opening year) and estimated settled ADR (July 2025-June 2026)
■ Government statistics and public data
- Ministry of Land, Infrastructure, Transport and Tourism, “Building Construction Dynamics Statistics Survey (Building Construction Starts Statistics)” — number of buildings, floor area and planned construction cost for lodging buildings (e-Stat statistics ID: 0003114490, 2017-2024), and forward supply based on building-plan data
- e-Stat, Portal Site of Official Statistics of Japan
■ Industry reports and news
- Latest trends in Japan’s hotel market: relative value versus global peers, and limited new hotel supply on rising construction costs — JLL (Travel Voice, December 8, 2025)
- Reading the 2026 lodging market: why Mitsubishi Estate and Hilton are focusing on apartment hotels, and the investment strategy behind it (Arch Inc.)