

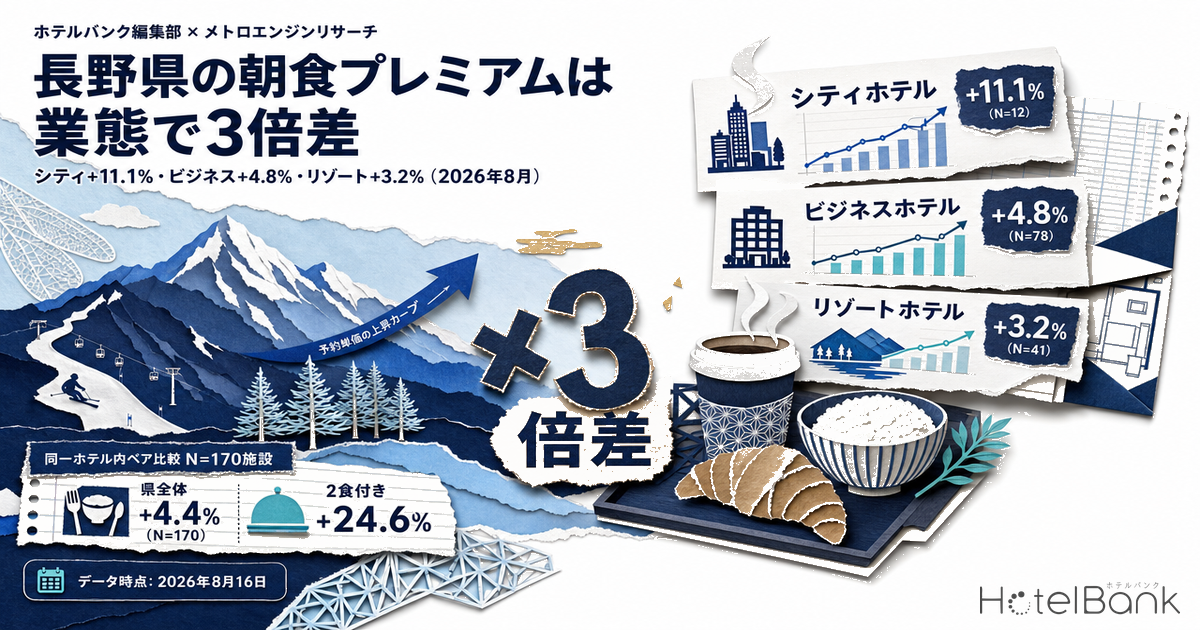
Whether a hotel in Nagano Prefecture is able to price breakfast into its room rate splits cleanly into three tiers by segment. In a paired comparison of the August 2026 cross-section — matching plans within the same hotel that differ only in meal conditions — the mark-up of breakfast-included over room-only was City hotels +11.1% (N=12 properties)、Business hotels +4.8% (N=78 properties)、Resort hotels +3.2% (N=41 properties). Across the prefecture as a whole it was +4.4% (N=170 properties). Lining up the four months from May 2026 onward, business hotels narrowed from 9.9% to 4.8% while city hotels widened from 8.3% to 11.1%. Within a single prefecture, breakfast pricing power is moving in opposite directions.
Scope: hotels in Nagano Prefecture (city / business / resort; ryokan are excluded from the aggregation). Meal premiums are same-hotel paired comparisons, N=170 properties (August 2026, overall). Settled ADR estimates cover business hotels N=167 properties, city hotels N=16 properties and resort hotels N=119 properties (July 2026, finalized). The price metric in this article is the settled ADR estimate (the transaction price level inferred from OTA and other sales data, tax-exclusive equivalent); occupancy is an estimate based on OTA-listed inventory. Definitions for both appear at the end of the article. Data as of August 16, 2026.
- — Breakfast pricing power differs threefold by segment — In same-hotel paired comparisons for August 2026 stays, the breakfast premium over room-only was City +11.1% (N=12 properties), Business +4.8% (N=78 properties) and Resort +3.2% (N=41 properties). The prefecture average of +4.4% (N=170 properties) is not a valid benchmark for your own property.
- — Only business hotels contracted in rate and yen terms at once — From +9.9% / ¥1,639 (N=74) in May 2026 to +4.8% / ¥931 (N=78) in August. The room-only side of the paired comparison rose from ¥16,474 to ¥19,326 (two adults, one room), so a denominator effect cannot explain it.
- — City hotels expanded in both rate and yen terms — +8.3% to +11.1%, ¥2,124 to ¥3,207. The paired properties stayed fixed at N=12 across all four months, so this is not variation caused by a change in the sample.
- — For resorts the unit of monetization is half board, not breakfast — Breakfast alone stops at +3.2% (N=41), but half board over room-only reaches +24.6% (N=40), jumping to roughly ¥15,000 in absolute terms.
- — The design room sits inside the observed range — The widest four-month swing is business hotels at 5.1pt (4.8–9.9%). Applied to the August room-only reference price of ¥19,326, the breakfast differential spans ¥928 to ¥1,913.
The August 2026 cross-section through same-hotel paired comparison
A word first on how meal premiums are aggregated. The figures used here are not simple averages across properties. Instead, only properties that actually sell both a room-only and a breakfast-included plan within the same hotel are extracted, and the difference between the two is taken — a “paired comparison”. Averaging properties that sell only breakfast-included plans together with properties that sell only room-only plans would measure differences in property mix rather than meal pricing, which is why this method is used. Guest-count conditions are matched as well. The aggregation covers the three hotel segments above, and ryokan are excluded from the aggregation (one night with two meals is the default at a ryokan, so a room-only pairing rarely exists). Every figure carries the number of paired properties as N=, and any bucket with fewer than five properties is not cited in this article.
The August 2026 cross-section is as follows. Separating the breakfast-only mark-up, the additional step from breakfast-included to half board, and the total from room-only to half board makes each segment’s approach to selling meals legible.
| Segment | Breakfast incl. vs room only | Half board vs breakfast incl. | Half board vs room only |
|---|---|---|---|
| City hotels | +¥3,207 / +11.1% (N=12) | +¥12,671 / +35.0% (N=9) | +¥16,491 / +51.0% (N=9) |
| Business hotels | +¥931 / +4.8% (N=78) | +¥4,373 / +20.5% (N=21) | +¥4,060 / +18.2% (N=20) |
| Resort hotels | +¥1,948 / +3.2% (N=41) | +¥13,143 / +21.0% (N=40) | +¥14,956 / +24.6% (N=40) |
| Nagano Prefecture, overall | +¥1,459 / +4.4% (N=170) | +¥9,903 / +22.8% (N=103) | +¥11,282 / +26.7% (N=104) |
Source: Compiled by the HotelBank Editorial Team from MetroEngines Research (August 2026 stays, same-hotel paired comparison)
Source: Compiled by the HotelBank Editorial Team from MetroEngines Research
Three things stand out. First, the segment that adds the most on breakfast alone is city hotels, where +11.1% (N=12) is more than double the business-hotel figure and more than triple the resort figure. In yen terms it is roughly ¥3,200, the largest of the prefecture’s three segments. Second, resort hotels add almost nothing on breakfast alone, at +3.2% (N=41), yet once the guest moves up to half board the figure jumps to +24.6% (N=40), roughly ¥15,000 in yen terms. The structure is clear: resort meal monetization is built on the unit of “one night with two meals including dinner,” not on breakfast. Third, business hotels post the smallest mark-up at every step — breakfast +4.8% (N=78) and even with dinner added +20.5% (N=21). That said, only 21 paired properties sell as far as dinner, and most business hotels in the prefecture stop at breakfast.
The demand environment itself is not weak. Estimated OCC (OTA-listed-inventory basis) for July 2026 was 92.2% for business hotels in Nagano, 90.5% for resort hotels and 88.6% for city hotels (each the average of daily observations in July 2026). Even in a month of thick demand, whether breakfast can be priced into the rate divides by segment. For the pace of inventory sell-through itself this summer, see Nagano Late-Summer Booking Curve 2026, which tracks it by segment.
May to August: business narrowed, city widened
A single cross-section cannot show the direction of pricing. The table and chart below line up the same paired-comparison breakfast premium across the four months from May to August 2026.
| Segment | May 2026 | June 2026 | July 2026 | August 2026 |
|---|---|---|---|---|
| City hotels | +8.3% ¥2,124 / N=12 | +11.1% ¥2,542 / N=12 | +10.2% ¥2,627 / N=12 | +11.1% ¥3,207 / N=12 |
| Business hotels | +9.9% ¥1,639 / N=74 | +6.6% ¥1,047 / N=79 | +5.5% ¥930 / N=78 | +4.8% ¥931 / N=78 |
| Resort hotels | +1.4% ¥643 / N=37 | +4.2% ¥1,757 / N=37 | +4.2% ¥2,115 / N=40 | +3.2% ¥1,948 / N=41 |
| Nagano Prefecture, overall | +5.1% ¥1,323 / N=163 | +5.6% ¥1,354 / N=171 | +5.2% ¥1,463 / N=175 | +4.4% ¥1,459 / N=170 |
Source: Compiled by the HotelBank Editorial Team from MetroEngines Research (breakfast incl. vs room only, same-hotel paired comparison)
Source: Compiled by the HotelBank Editorial Team from MetroEngines Research
The contraction at business hotels is happening in yen terms, not only in rate terms — and that is the important part. From ¥1,639 in May (N=74) to ¥931 in August (N=78), the differential itself narrowed by roughly ¥700. If the falling rate were purely a denominator effect from a higher room-only price, the yen amount would have held. It did not. A meaningful number of properties have been squeezing the gap between breakfast-included and room-only plans in yen terms.
By contrast, city hotels expanded in rate (8.3% to 11.1%) and in yen (¥2,124 to ¥3,207) at the same time. The paired properties were fixed at N=12 across all four months, so this is not variation caused by a change in the sample. Resort hotels rose from +1.4% in May (N=37) to +4.2% in June and July, then settled back to +3.2% in August (N=41), staying within a 3–4% range. The prefecture overall eased from 5.1% to 4.4%, pulled along by business hotels, which dominate the property count.
Hold it as an observed range: converting four months of spread into yen for your property
So far we have looked at a single-month cross-section and a four-month trend, but what operations actually need is one number: where to set your own breakfast differential. Market values move month to month, so a range is easier to work with than a point. Below is the range of breakfast premiums (breakfast incl. vs room only) measured across the four months from May to August 2026, together with those rates applied to the August 2026 room-only reference price. The reference price is the average of the room-only side of the paired comparison (two adults per room query condition, listed-price basis); it is on a different basis from the settled ADR estimate used earlier in this article (per room per night, tax-exclusive equivalent), so the two must not be added to or subtracted from each other.
| Segment | Pessimistic (range low) | Midpoint (4-month average) | Optimistic (range high) | August room-only reference price | Paired properties |
|---|---|---|---|---|---|
| City hotels | +8.3% (May 2026) Converted ¥2,408 | +10.2% Converted ¥2,960 | +11.1% (June & August) Converted ¥3,221 | ¥29,016 | N=12 (fixed across 4 months) |
| Business hotels | +4.8% (August 2026) Converted ¥928 | +6.7% Converted ¥1,295 | +9.9% (May) Converted ¥1,913 | ¥19,326 | N=74〜79 |
| Resort hotels | +1.4% (May 2026) Converted ¥848 | +3.3% Converted ¥2,000 | +4.2% (June & July) Converted ¥2,545 | ¥60,597 | N=37〜41 |
| Nagano Prefecture, overall | +4.4% (August 2026) Converted ¥1,453 | +5.1% Converted ¥1,684 | +5.6% (June) Converted ¥1,849 | ¥33,017 | N=163〜175 |
Source: Compiled by the HotelBank Editorial Team from MetroEngines Research (same-hotel paired comparison, breakfast incl. vs room only)
The widest swing belongs to business hotels at 5.1pt (4.8–9.9%), while city and resort hotels both stay within 2.8pt. Business hotels are the band where the market has not yet settled on a price — in other words, where design room remains. Applied to the August reference price of ¥19,326, the gap between the low and high ends is roughly ¥1,000 per night of breakfast (¥928 to ¥1,913). Resort hotels, conversely, have a narrow rate range, but because the reference price is a high ¥60,597, the same 2.8pt spread becomes ¥848 to ¥2,545 in yen — a difference of roughly ¥1,700. the thinner a segment looks in rate terms, the more strongly its yen impact is governed by the level of the reference price — that relationship shows up here.
It is worth generalizing this relationship. The grid below combines five reference-price levels and five premium rates, all measured within the prefecture, to show what the breakfast differential becomes for any combination of your own room-only price and your target breakfast premium rate. The figures are the identity “reference price × rate”; no extrapolation or interpolation is applied.
| Room-only reference price | +3.2% Pref. resort, Aug |
+4.8% Pref. business, Aug |
+6.7% Pref. business, 4-mo avg |
+11.1% Pref. city, Aug |
+13.4% Saku business, Aug |
|---|---|---|---|---|---|
| ¥15,677 Saku City · business hotels | ¥502 | ¥752 | ¥1,050 | ¥1,740 | ¥2,101 |
| ¥19,326 Nagano Pref. · business hotels | ¥618 | ¥928 | ¥1,295 | ¥2,145 | ¥2,590 |
| ¥29,016 Nagano Pref. · city hotels | ¥929 | ¥1,393 | ¥1,944 | ¥3,221 | ¥3,888 |
| ¥41,533 Hakuba Village · resort hotels | ¥1,329 | ¥1,994 | ¥2,783 | ¥4,610 | ¥5,565 |
| ¥60,597 Nagano Pref. · resort hotels | ¥1,939 | ¥2,909 | ¥4,060 | ¥6,726 | ¥8,120 |
Source: Compiled by the HotelBank Editorial Team from MetroEngines Research (reference prices and premium rates are both measured values; the differential is their product)
Reading it is simple. Pick the row closest to your own room-only price, then check which column your current breakfast differential falls into. For example, if a business hotel at the ¥19,326 room-only level sets its breakfast differential at ¥1,000, it already clears the prefecture average of +4.8% (¥928) but has not reached the four-month average of +6.7% (¥1,295). A top-end level such as Saku City’s +13.4% (N=5) corresponds to ¥2,590 in the same price band, and it is a value that genuinely occurs within the prefecture. But that bucket has only five paired properties, and it is premature to adopt a single month’s top value as a target. The grid is a tool for checking how many yen move when the rate moves one step at your current price — it is not evidence that a particular level is achievable.
Reading it against the rate base (settled ADR estimate)
The meal premium is a story about a differential, and it is a different yardstick from the level of the rate itself. Mixing the two into a ratio destroys the meaning, so the level side is checked separately here using the settled ADR estimate. Comparing the most recent finalized settled ADR estimate for July 2026 against the same month a year earlier (both finalized) gives the following.
| Segment | July 2025 (finalized) | July 2026 (finalized) | YoY |
|---|---|---|---|
| City hotels | ¥10,794 (N=16) | ¥10,564 (N=16) | -2.1% |
| Business hotels | ¥7,644 (N=162) | ¥8,072 (N=167) | +5.6% |
| Resort hotels | ¥16,171 (N=115) | ¥15,772 (N=119) | -2.5% |
Source: Compiled by the HotelBank Editorial Team from MetroEngines Research (settled ADR estimate, tax-exclusive equivalent, finalized values compared with finalized values)
There is an interesting contrast here. Business hotels are growing on room rate itself, up +5.6% YoY (July 2026 finalized, N=167 properties), while the breakfast mark-up is shrinking in both rate and yen terms. In other words, they are taking revenue growth on the room-rate side and holding or compressing meals. Conversely, city hotels have widened the breakfast premium from 8.3% to 11.1% while room rate stalls at -2.1% YoY (N=16 properties). Even within one prefecture, the entry point for growing rate differs by segment. Resort hotels are at -2.5% on room rate (N=119 properties) and their breakfast premium stays in the 3–4% range, but they secure +24.6% (N=40) on half board.
The next chart overlays the settled ADR estimate by year for business hotels, the segment with the most properties in the prefecture. In 2025 the seasonal shape peaks in August, which can be treated as the base pattern for building a rate-revision calendar (August 2026 finalized values are not yet available, so the chart is drawn through July).
Source: Compiled by the HotelBank Editorial Team from MetroEngines Research (settled ADR estimate, finalized values)
By municipality and against neighboring prefectures
A prefecture average also bundles together areas with different market characters. Lining up the August 2026 breakfast premium for municipalities where at least five paired properties could be secured gives the following.
| Municipality | Segment | Breakfast premium, Aug 2026 | May 2026 | Paired properties |
|---|---|---|---|---|
| Saku City | Business hotels | +¥2,107 / +13.4% | +9.6% | N=5 |
| Matsumoto City | Business hotels | +¥1,606 / +7.7% | +8.6% | N=18 |
| Ueda City | Business hotels | +¥1,165 / +6.6% | +12.9% | N=6 |
| Nagano City | Business hotels | +¥1,137 / +5.8% | +16.0% | N=14 |
| Hakuba Village | Resort hotels | +¥2,216 / +5.3% | -0.8% | N=10 |
| Karuizawa Town | Resort hotels | +¥3,088 / +3.4% | +4.2% | N=16 |
Source: Compiled by the HotelBank Editorial Team from MetroEngines Research (same-hotel paired comparison, municipalities with at least five paired properties only)
Comparing the four business-hotel cities, Saku City is highest as of August at +13.4% (N=5) and Nagano City lowest at +5.8% (N=14). It is worth noting, though, that as of May it was Nagano City that ranked top at +16.0% (N=13). Breakfast premiums within an area are a metric that can reorder month to month, and it is premature to fix your own standing on a single month’s ranking. Among the two resort areas, Karuizawa Town is large even by prefecture standards in yen at +¥3,088 (N=16), yet stops at +3.4% in rate terms. In areas where the rate level itself is high, the impression changes depending on whether you read the rate or the yen.
A comparison with neighboring prefectures is worth placing alongside. Breakfast premiums for August 2026 (breakfast incl. vs room only) across surrounding and tourism-heavy prefectures are as follows.
| Prefecture | Business hotels | Resort hotels | City hotels |
|---|---|---|---|
| Hokkaido | +9.4%(N=196) | +6.8%(N=50) | +18.1%(N=50) |
| Gifu | +9.9%(N=44) | — | +1.9%(N=8) |
| Yamanashi | +5.9%(N=31) | +9.3%(N=17) | — |
| Gunma | +5.0%(N=45) | +1.0%(N=12) | +14.6%(N=10) |
| Shizuoka | +5.0%(N=132) | +0.2%(N=37) | +11.9%(N=21) |
| Nagano | +4.8%(N=78) | +3.2%(N=41) | +11.1%(N=12) |
| Niigata | +3.0%(N=66) | -9.9%(N=13) | +10.1%(N=16) |
Source: Compiled by the HotelBank Editorial Team from MetroEngines Research (August 2026 stays, breakfast incl. vs room only; “—” denotes fewer than five paired properties and is not listed)
Nagano’s business hotels at +4.8% (N=78) rank second from the bottom among the seven prefectures compared. The gap against Gifu — a fellow inland tourism prefecture — at +9.9% (N=44) is roughly twofold. City hotels at +11.1% (N=12) sit mid-pack, while resort hotels at +3.2% (N=41) fall below Yamanashi at +9.3% (N=17) and Hokkaido at +6.8% (N=50). Note that even in a same-hotel comparison the room-type mix of the target plans can differ by meal condition, which is why some prefectures show a negative differential, as with resort hotels in Niigata. Cross-prefecture comparison is better suited to grasping which range your prefecture sits in than to reading the levels themselves. For another prefecture broken down within the same paired-comparison framework, Oita’s meal premiums dissected by segment reads well alongside this article and makes it easier to see how the segment gap varies from prefecture to prefecture.
For revenue managers operating hotels in Nagano — implications and an action plan
(1) First, put into words whether your property leans on breakfast or on the room to earn. Business hotels in the prefecture grew settled ADR estimate +5.6% YoY (July 2026 finalized, N=167 properties) while the breakfast premium contracted in both rate and yen from +9.9% in May (N=74) to +4.8% in August (N=78). That is a market leaning room-rate-led overall. If your property is moving the same way, you are consistent with the market; but if room rate is flat while you are also squeezing the breakfast premium, both routes to growing rate may be closed.
(2) For city hotels, market data still leaves room to use breakfast as headroom for rate. City hotels in the prefecture widened the breakfast premium from +8.3% to +11.1% (N=12) while settled ADR estimate stalled at -2.1% YoY (July 2026 finalized, N=16 properties). In a phase where raising room rate is hard to push through, this reads as a market where separating meal conditions and designing the price gap is working.
(3) For resorts, design in units of half board, not breakfast. Breakfast alone at resort hotels in the prefecture is +3.2% (N=41), but half board is +24.6% (N=40) over room-only, and even the incremental step from breakfast-included is a large +21.0% (N=40). Rather than treating the thin breakfast premium as the problem, it is closer to practical value to review the mix and the price gap of packages that include dinner.
(4) Track rate and yen together, not single-month rankings. Business hotels in Nagano City moved from +16.0% in May (N=13) to +5.8% in August (N=14); municipal-level rankings reorder month to month. And there are cases like Karuizawa Town where the yen amount is +¥3,088 (N=16) yet the rate is only +3.4%. When evaluating your own breakfast price gap, judging on rate alone or yen alone leads to errors.
| Time horizon | Action | Decision trigger | Objective |
|---|---|---|---|
| Today to this week | Take inventory of the price gap between your room-only and breakfast-included plans, in both rate and yen terms | If a business hotel’s differential falls well below the market’s +4.8% (N=78), or a city hotel’s falls well below +11.1% (N=12) | Locate your position on the market range |
| Today to this week | Check that plan pairs differing only in meal condition, within the same room type, line up as intended | If pairs with mismatched room types remain | Prevent the price gap from being obscured by factors other than meals |
| Within two weeks | For the city segment, test the room to widen the breakfast-included price gap, starting narrowly on peak dates | If your room rate is hard to grow and your breakfast price gap has not reached the market’s +11.1% (N=12) level | Secure a route to higher rate other than room rate |
| Within two weeks | For the resort segment, review the price gap and sales mix of half-board packages | If the half-board mark-up diverges from the market’s +24.6% (N=40, vs room only) | Concentrate resources on the unit where meal monetization works |
| Toward next month | Set the rate-revision calendar in advance to match the seasonal shape of the settled ADR estimate (peaking in August) | If your revision timing does not mesh with the market’s seasonal shape | Avoid designing peak-month rates after the fact |
| Toward next month | Establish an in-house fixed point for tracking the breakfast premium monthly | If rate and yen contract simultaneously for two consecutive months | Detect unintended compression of the differential early |
Source: Compiled by the HotelBank Editorial Team from MetroEngines Research
In summary — three yardsticks for reading breakfast in Nagano
The first yardstick is segment. Even within one Nagano Prefecture, the degree to which breakfast is priced into the rate differs more than threefold: city hotels +11.1% (N=12), business hotels +4.8% (N=78), resort hotels +3.2% (N=41). The benchmark for evaluating your own breakfast price gap is the value for your own segment, not the prefecture average of +4.4% (N=170).
The second yardstick is rate and yen together. Business hotels in the prefecture contracted in rate (9.9% to 4.8%) and in yen (¥1,639 to ¥931) simultaneously from May to August. City hotels, meanwhile, expanded in rate (8.3% to 11.1%) and in yen (¥2,124 to ¥3,207) simultaneously. Either one on its own will mislead you on direction.
The third yardstick is the unit of monetization. Resort hotels stop at +3.2% (N=41) on breakfast alone but secure +24.6% (N=40) over room-only on half board. Depending on the segment, the problem of capturing rate through meals must be solved in units of half board rather than breakfast. Nagano is a market where all three yardsticks can be observed simultaneously within a single prefecture.
About the data
· Meal premium methodology: a paired comparison extracting only properties that actually sell both meal types within the same hotel (e.g. room-only and breakfast-included). Simple averages across properties are not used. Guest-count conditions are matched (two adults per room query condition, listed-price basis), and ryokan are excluded from the aggregation. The N= on each figure is the number of properties entering the paired comparison; buckets with fewer than five properties are not cited in this article. Target months are stays from May 2026 through August 2026.
· Definition of estimated OCC (OTA-listed-inventory basis): OTA-listed-inventory occupancy = 100 − 100 × rooms remaining on OTA listings ÷ total rooms. It is an estimate based on how listed inventory is being consumed on OTAs, and its definition differs from actual room occupancy (it reads higher). The figures used in this article are the average of daily observations for Nagano Prefecture in July 2026 (the target month).
· Definition of the settled ADR estimate: a transaction price level (tax-exclusive equivalent) inferred from OTA and other sales data (lowest-plan level × segment coefficient, ensembled across multiple channels). Past months are finalized values; the current and future months are estimates based on sales conditions at the present time. Median error against published operating results is 6.6%. All year-on-year comparisons in this article are finalized values against finalized values.
· Breakdown of N=: for meal premiums (August 2026, breakfast incl. vs room only), city hotels N=12 properties, business hotels N=78 properties, resort hotels N=41 properties, Nagano Prefecture overall N=170 properties (the overall figure also includes segment buckets not shown individually). For the settled ADR estimate (July 2026 finalized), city hotels N=16 properties, business hotels N=167 properties, resort hotels N=119 properties.
· Data as of: August 16, 2026. Sales conditions and inventory change daily, so the figures in this article are a snapshot at the time of retrieval.
References and sources
■ Data source
Publicly listed sales information from accommodation booking sites, collected and aggregated by MetroEngines Research & Consulting. Meal premiums are same-hotel paired comparisons for Nagano Prefecture and six neighboring prefectures (two adults per room query condition, stays from May to August 2026, by segment and by municipality); the settled ADR estimate is the monthly series by segment for Nagano Prefecture (July 2025 and July 2026 are both finalized); estimated OCC is the average of daily observations in July 2026. Municipal figures are listed only for buckets where at least five paired properties could be secured. Data as of August 16, 2026.
■ Calculation assumptions
The “midpoint” of the observed range is the simple average of the monthly premium rates from May to August 2026, not weighted by property count. The converted differentials are calculated from the identity “August 2026 room-only reference price × the rate for each scenario,” using no inputs other than the measured values published in this article (rates use the displayed values rounded to one decimal place, so differences of a few to a dozen yen arise against the August measured differential). The five row levels and five column levels of the sensitivity grid are themselves reference prices and premium rates measured within Nagano Prefecture between May and August 2026; no extrapolation, interpolation or forecasting is applied. Year-on-year comparisons are finalized values against finalized values.
■ Limitations and caveats
The reference price for meal premiums is listed-price based for two adults per room, while the settled ADR estimate is a transaction price level per room per night (tax-exclusive equivalent); the two are on different bases and cannot be added, subtracted or divided. Even in a same-hotel comparison, the room-type mix of the target plans can differ by meal condition, so some buckets show a negative differential (such as resort hotels in Niigata in the neighboring-prefecture comparison). The number of paired properties varies by month, and municipal figures include buckets of N=5 to 6, so single-month rank changes should not be over-read. Ryokan are outside the scope of this aggregation. Occupancy is an estimate on an OTA-listed-inventory basis and reads higher than actual room occupancy. The figures in this article are a snapshot at the time of retrieval; sales conditions and inventory change daily.
Related reading
- Oita Meal Premiums: Business Breakfast +10.6%, Half-Board +39.3%
- Fukuoka Settled ADR Slows +14.4% to +3.6% — Breakfast Premium Next?
- Nagano Late-Summer Booking Curve 2026: Ryokan -11.8pt at 45 Days Out
- Nagano Accommodation Tax June 1: 2nd Prefecture, ADR Impact & Pass-Through Scenarios
- Is the Hotel Breakfast Premium Justified? Verifying with OTA Price Data