

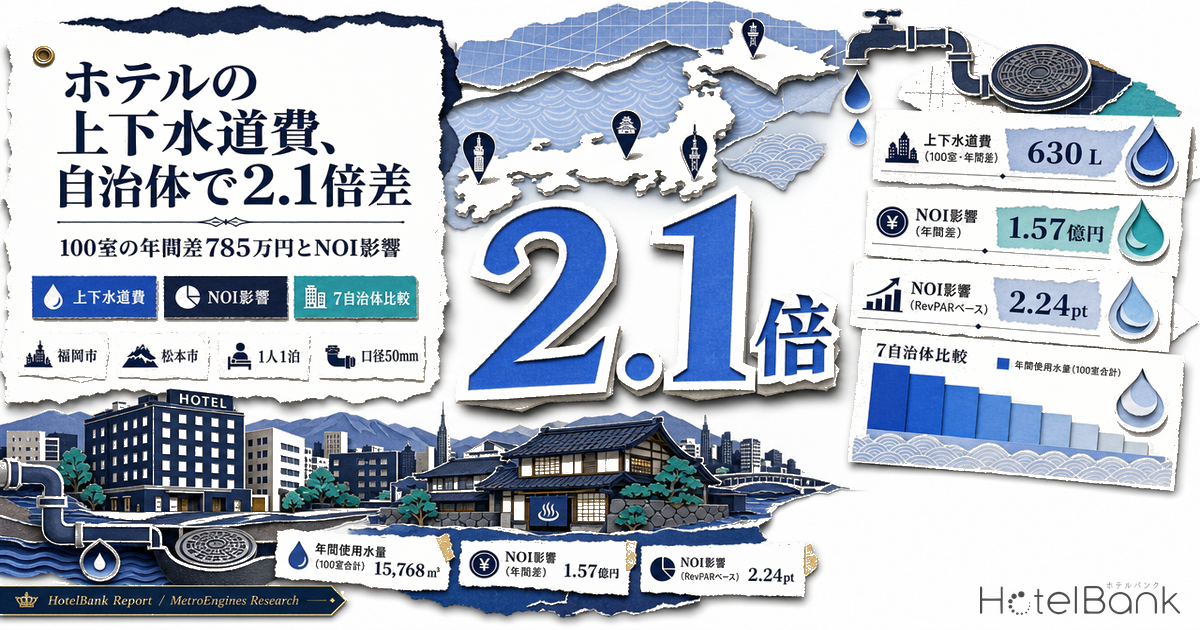
When hotel running costs come up for discussion, the conversation almost always turns to electricity and gas. But the lodging industry buys another resource in enormous volume — water. According to a survey of roughly 100 properties nationwide by the Eco Subcommittee of the Japan Association of Tourism Facilities, water consumption per guest is 630 liters. For a single overnight stay, that is more than twice what one person uses in an entire day at home (282 liters).
What this article examines is what price that 630 liters is bought at. And the crucial point is that the price is set not by the national government but by the water utility of the municipality where the property stands. Building the same 100-room business hotel in seven different municipalities and stacking up its water and sewer bill produces an annual figure ranging from ¥6.99mn to ¥14.85mn — a 2.12x spread. The ¥7.85mn difference compounds to ¥78.5mn over ten years, and at a 5.0% cap rate translates into ¥157mn of asset value.
HotelBank has previously covered the supply-side cost impact of the 2026 electricity price increase, but the subject there was electricity, gas, and national subsidies. Water and sewer differ on four counts.
(1) A different expense line: it sits in a separate account from electricity and gas, and it comes in two parts — water supply and sewerage.
(2) The price setter is not the national government: each municipality’s water utility (in some cases a prefectural or joint enterprise) fixes it by ordinance.
(3) There is no permanent national relief scheme: nothing equivalent to the nationwide shock-absorbing subsidies applied to electricity and gas exists. Municipal discounts are exceptional and time-limited (see the Shimonoseki case below).
(4) As a result, location permanently determines the cost: a hotel can switch electricity retailers, but it cannot switch water utilities.
This is a sixth location-cost axis, distinct from the labor-cost axis covered in the surge in room-cleaning dispatch rates and the climate-cost axis covered in Snow as Cost or Asset (the fifth location axis).
Metric Definitions Used in This Article
- ADR (average daily rate): an estimated settled rate (tax-excluded equivalent) calculated by applying a segment-specific adjustment coefficient to the lowest publicly listed plan level each property posts on OTA sites (double occupancy, per-room rate, tax-included). Cross-checked against property-level results disclosed by listed hotel REITs (91 properties, most recent three months), the median error is approximately 7%. These are estimates and differ from each property’s actual transacted prices and accounting figures. Area-level ADR is the median across the properties covered (the level of a typical property in that area). For government-ordinance-designated cities, the ward-level values are combined into a property-count-weighted median, using the 12-month average from August 2025 to July 2026 (all on a settled-month basis).
- Water and sewer cost: the amount this article calculates from its assumed consumption volumes, based on the tariff tables each water utility and sewerage operator publishes by ordinance (consumption tax included). Actual billed amounts differ according to meter-reading cycles, pro-rating, and reduction schemes.
- Consumption intensity: water use per guest per night (liters).
- Data sources: MetroEngines Research & Consulting (ADR) / published tariff tables of each water utility and sewerage operator (rates) / Japan Association of Tourism Facilities and Japan Ryokan & Hotel Association (consumption intensity, utility costs)
- — The annual water and sewer bill for an identically specified 100-room business hotel ranges from ¥6.99mn to ¥14.85mn (2.12x) across seven municipalities. The ¥7.85mn difference equals ¥157mn in asset value at a 5.0% cap rate.
- — Comparing water supply alone misses 30–50% of the burden. In Matsumoto, sewerage at ¥3.81mn exceeds water supply at ¥3.18mn — choose a site on cheap water alone and the ranking flips.
- — The published “average revision rate” is not the property’s revision rate. Matsumoto’s headline 20.11% translates into an effective increase of 4.7% for the 100-room model; Sapporo’s sewerage headline of 22.6% becomes 19.9%.
- — Ranked not by absolute cost but by the ratio to that market’s ADR, the order reverses. As a share of room revenue, Kumamoto is heaviest at 3.69% and Matsumoto lightest at 1.79%.
- — For a Fukuoka property to produce the same NOI as an identical property in Matsumoto requires ADR +¥269 per room-night (2.2% of a ¥12,000 ADR). Flexing consumption intensity across 300–630 L/guest-night keeps this within a +¥184 to +¥465 band.
Where the 630 liters comes from — of ¥1,300 in utility costs, how much is water
Start with the primary source for the consumption intensity. At the “Symposium on Improving Productivity in Lodging Facilities” held in 2017 by the Japan Association of Tourism Facilities and the Japan Ryokan & Hotel Association, the facilities association reported that a survey of approximately 100 properties nationwide found utility consumption per guest of 630 liters of water, 30.4 kilowatt-hours of electricity, and 4.8 liters of oil. The association set a target of ¥900 for utility costs per guest and stated that achieving it would require holding water down to 600 liters (Kanko Keizai Shimbun, December 5, 2017).
One caveat about the 630-liter figure: it is the average of a sample that includes many ryokan with large communal baths. The association noted that “ryokan with hot springs use large volumes of water, electricity, and heavy oil, and there is considerable room for improvement in the operation of large communal baths,” so the figure should be understood as swinging widely by property type. Indeed, a 26-room hot-spring ryokan on the Sea of Japan coast presented at the same symposium halved its utility cost per guest from ¥1,956 to ¥992 through equipment renovation.
As a guide on the cost side, the Japan Ryokan & Hotel Association’s FY2015 statistics put utility costs per guest at ¥1,259 for large ryokan (100+ rooms), ¥1,307 for mid-size ryokan (31–99 rooms), and ¥1,346 for small ryokan (30 rooms or fewer) — clustered around ¥1,300 regardless of room count. That is a level from more than a decade ago, however, and cannot be used as a current value. The chair of the association’s Eco Subcommittee wrote in a 2023 column that “before COVID, ryokan spent an average of about ¥1,350 per guest on utilities including water; with soaring energy prices I would think it now exceeds ¥2,000” — a practitioner’s estimate rather than a statistic.
Hotels buy water on a different tariff table than households — the structure of meter size and use category
Here is the core of the matter. A water bill consists of a base charge plus a volumetric charge, but the tariff table applied to large commercial users is a different instrument from the residential one. How it is set breaks into three broad systems that vary considerably by municipality.
First, by meter size. The larger the meter diameter, the more sharply the base charge jumps. In Tokyo’s 23 wards (Tokyo Metropolitan Bureau of Waterworks), the base charge for a 13 mm meter is ¥860 per month (before tax), against ¥20,720 for 50 mm, ¥45,623 for 75 mm, and ¥94,568 for 100 mm. Moreover, in Tokyo’s case the cheaper volumetric tiers disappear entirely on large-meter contracts. Households on 13–25 mm meters pay ¥0 for the first 5 cubic meters and ¥22 for 6–10 cubic meters, but on a 50 mm contract ¥372 per cubic meter applies from the very first cubic meter. The same water costs a household ¥22 and a hotel ¥372.
Second, by use category. Sapporo separates “domestic use” from “non-domestic use” and levies a higher base charge on the latter. Fukuoka likewise splits “domestic” and “non-domestic,” with hotels falling into the latter. And here lies a practical trap — Osaka’s “business use” category is not the one that covers hotels. According to the application criteria published by the Osaka City Waterworks Bureau, business use is limited to entertainment establishments such as bars and cabarets, ornamental facilities such as fountains, ponds, and waterfalls, public bathhouses other than bathhouse use, and temporary business activity. Hotels do not fall under it and are instead assigned “general use.” Inferring the rate from the name of the category alone will badly misstate the unit price in Osaka.
Third, base-volume systems. Sapporo’s 50 mm “non-domestic use” base charge of ¥53,900 per month (tax included) is among the highest in the country, but it includes up to 100 cubic meters of consumption per month. Kyoto’s 50 mm meter likewise carries a base volume within its base charge of ¥40,260 (tax included, two-month billing). A comparison that lines up base charges alone misses this structure.
And the sewerage charge must always be shown alongside. Most municipalities bill wastewater discharge as equal to water consumption, so using water automatically generates sewerage. In the 100-room model below, the combined water and sewer burden comes to 1.5–2.2x the water-supply figure alone. Compare sites on water supply only and you overlook 30–50% of the burden.
| Municipality (utility) | Category applied to hotels | 50 mm base charge (monthly, tax incl.) | High-volume tier unit rate (water) | Highest sewerage unit rate | Notes |
|---|---|---|---|---|---|
| Sapporo | Non-domestic use | ¥53,900 | ¥375 | ¥237 | Base charge includes 100 m³/month |
| Matsumoto | General | ¥33,781 | ¥176 | ¥248.6 | After the April 2026 revision. Flat volumetric rate |
| Fukuoka | Non-domestic use | ¥23,210 | ¥542 | ¥515 | Tariff is two-monthly; converted to monthly |
| Tokyo 23 wards | General use | ¥22,792 | ¥404 | ¥345 | At 50 mm, ¥372 applies from the 1st m³ |
| Kyoto | General use | ¥20,130 | — | — | Base volume included. Published table covers up to 200 m³ |
| Chiba Prefectural Waterworks | By meter size (no use categories) | ¥19,621 | ¥514 | — | After the April 2026 revision. Sewerage set separately by each city |
| Shimonoseki | By meter size (no use categories) | ¥13,221 | ¥322 | ¥209 | After the April 2026 revision. Two-monthly converted to monthly |
| Kumamoto | General use | ¥9,185 | ¥319 | ¥340.47 | Common volumetric rate for 40–150 mm |
| Osaka | General use | ¥935 | ¥358 | ¥234 | Base charge is uniform regardless of meter size |
Building up from consumption intensity — annual water and sewer costs for three scale models
Next, build actual annual consumption and cost up from the consumption intensity. The formula is rooms × occupancy × 365 days × guests per room × consumption intensity. The assumptions are as follows, all of them this article’s own settings.
| Model | Rooms | Occupancy | Guests per room | Intensity (L/guest-night) | Guest-nights (per year) | Annual volume (m³) | Monthly avg. (m³) | Assumed meter |
|---|---|---|---|---|---|---|---|---|
| 100-room business hotel | 100 | 80% | 1.35 | 400 | 39,420 | 15,768 | 1,314 | 50 mm |
| 200-room city hotel | 200 | 78% | 1.60 | 630 | 91,104 | 57,396 | 4,783 | 75 mm |
| 80-room hot-spring ryokan | 80 | 55% | 2.20 | 1,000 | 35,332 | 35,332 | 2,944 | 50 mm |
Run these volumes through the seven municipalities’ tariff tables from the previous section. The result is the table below. The property specification is completely identical; the only variable changed is location.
| Municipality | Water supply (¥/yr) | Sewerage (¥/yr) | Total (¥/yr) | ¥/guest-night | ¥/m³ | vs. cheapest |
|---|---|---|---|---|---|---|
| Fukuoka | 8,612,314 | 6,236,314 | 14,848,627 | 377 | 942 | +7,854,422 |
| Tokyo 23 wards | 6,858,403 | 5,068,932 | 11,927,335 | 303 | 756 | +4,933,130 |
| Sapporo | 6,398,700 | 2,928,103 | 9,326,803 | 237 | 592 | +2,332,598 |
| Kumamoto | 4,902,612 | 4,237,763 | 9,140,375 | 232 | 580 | +2,146,170 |
| Osaka | 5,719,982 | 3,020,292 | 8,740,274 | 222 | 554 | +1,746,069 |
| Shimonoseki | 5,195,268 | 3,187,944 | 8,383,212 | 213 | 532 | +1,389,007 |
| Matsumoto | 3,180,540 | 3,813,665 | 6,994,205 | 177 | 444 | — |
What stands out is the variation in the share taken by sewerage. In Matsumoto, sewerage at ¥3.81mn exceeds water supply at ¥3.18mn. Sapporo is the reverse, with ¥6.40mn of water against ¥2.93mn of sewerage — less than half. Choose a site on cheap water supply and you can be overtaken on sewerage, as in Matsumoto. There is no alternative to viewing water and sewer together.
Changing scale does not change the picture. For the 200-room city hotel (4,783 m³/month), Fukuoka’s ¥59.27mn against Matsumoto’s ¥25.24mn is a 2.35x gap and ¥34.03mn a year; for the 80-room hot-spring ryokan (2,944 m³/month), Fukuoka’s ¥35.49mn against Matsumoto’s ¥15.30mn is 2.32x and ¥20.19mn a year. The more water consumed, the more the escalating volumetric structure bites, and the gap widens rather than narrows.
This curve is highly instructive for investment decisions. In Matsumoto and Shimonoseki the average unit price keeps falling as volume rises, whereas Fukuoka, Tokyo’s 23 wards, and Osaka bottom out around 200 m³ per month and then turn upward. Municipalities that lean heavily on escalating tariffs are designed to penalize properties with large communal baths and larger properties generally. At 1,314 m³ per month, the marginal cost of one additional cubic meter is ¥425 in Matsumoto against ¥1,055 in Fukuoka — a 2.5x spread.
Translating into NOI — 2.24 points of revenue ratio, ¥157mn of asset value
So far these are absolute costs. To use them in an investment decision they must be translated into the language of revenue and NOI.
First, the structure. The volumetric portion of the water and sewer bill accrues in proportion to guest-nights. Revenue is also proportional to guest-nights (more precisely, to rooms sold). Therefore the volumetric portion’s ratio to revenue is barely affected by either occupancy or room count. What affects it is only four things: guests per room, consumption intensity, the volumetric unit rate, and ADR. The base charge, by contrast, is a fixed cost and dilutes as scale and occupancy rise. The intuition that “water costs thin out if you build bigger” applies only to the base-charge portion.
On that basis, look at the revenue ratio when ADR is fixed at ¥12,000 and only the location changes. This measures how many points apart two hotels selling the same product at the same price end up, purely on water charges.
| Model | Highest municipality | Lowest municipality | Annual gap | Multiple | 10-year cumulative | Gap in room-revenue ratio | Asset value at 5.0% cap | If closed via ADR |
|---|---|---|---|---|---|---|---|---|
| 100-room business hotel ADR fixed at ¥12,000 | Fukuoka ¥14,848,627 | Matsumoto ¥6,994,205 | ¥7,854,422 | 2.12x | ¥78,544,220 | 2.24 pt 4.24%→2.00% | ¥157,088,440 | +¥269/room-night |
| 200-room city hotel ADR fixed at ¥22,000 | Fukuoka ¥59,271,018 | Matsumoto ¥25,236,850 | ¥34,034,168 | 2.35x | ¥340,341,680 | 2.72 pt 4.73%→2.01% | ¥680,683,360 | +¥598/room-night |
| 80-room hot-spring ryokan ADR fixed at ¥25,000 | Fukuoka ¥35,486,691 | Matsumoto ¥15,301,079 | ¥20,185,612 | 2.32x | ¥201,856,120 | 5.03 pt 8.84%→3.81% | ¥403,712,240 | +¥1,257/room-night |
Another angle: what happens when each city’s actual ADR level is used as the denominator. Using MetroEngines Research & Consulting’s estimated settled ADR (12-month average from August 2025 to July 2026), the room-revenue ratio for the 100-room business hotel model comes out as follows.
| Municipality | Estimated settled ADR (12-month average) | Properties covered | Annual water and sewer cost | Room-revenue ratio |
|---|---|---|---|---|
| Kumamoto | ¥8,479 | N=82 | ¥9,140,375 | 3.69% |
| Fukuoka | ¥14,273 | N=247 | ¥14,848,627 | 3.56% |
| Shimonoseki | ¥9,622 | N=39 | ¥8,383,212 | 2.98% |
| Tokyo 23 wards (Chiyoda) | ¥16,435 | N=80 | ¥11,927,335 | 2.49% |
| Osaka | ¥12,173 | N=504 | ¥8,740,274 | 2.46% |
| Sapporo | ¥14,584 | N=193 | ¥9,326,803 | 2.19% |
| Matsumoto | ¥13,356 | N=102 | ¥6,994,205 | 1.79% |
The ranking reverses. Even where the absolute cost is mid-range, a market with relatively low ADR carries a heavier revenue ratio. Conversely, Tokyo’s 23 wards, expensive in absolute terms, land mid-table because ADR is also high. In site evaluation the correct sequence is not to hunt for municipalities with cheap water, but to ask what ratio the water bill represents against the ADR achievable in that market. Lodging taxes follow the same structure as a cost set by municipal ordinance, and the spread of adopting municipalities and the weight of the burden are a separate subject in their own right.
As for the impact on the yield on total investment, assuming a 100-room business hotel (18 m² rooms, guest-room ratio of 68%, giving 2,647 m² of gross floor area or 801 tsubo, and construction cost of approximately ¥1.93bn at the 2025 steel-frame unit rate of ¥2.405mn per tsubo from the Ministry of Land, Infrastructure, Transport and Tourism’s construction starts statistics), the effect is 0.39 pt at ¥2.0bn of total investment, 0.31 pt at ¥2.5bn, and 0.26 pt at ¥3.0bn. On the upward pressure on construction cost itself — the denominator here — Construction +41% and Labor Crunch Erase Japan’s 2027–2029 Hotel Supply goes into detail. On its own the effect is small, but what matters is that it is a permanent difference that neither design nor operations can move.
Sensitivity analysis — how far does the conclusion move when consumption intensity is flexed
The calculations so far place the 100-room business hotel’s consumption intensity at 400 L/guest-night. As noted, this is this article’s assumption, not a survey value. The verified survey average is 630 L/guest-night (from a sample containing many ryokan with large communal baths), while a property with water-saving equipment and no communal bath could fall below it. Consumption intensity is the assumption that most strongly drives this article’s conclusion, so it is flexed across 300–630 L/guest-night to test robustness.
| Intensity (L/guest-night) | Monthly volume (m³) | Matsumoto | Shimonoseki | Osaka | Kumamoto | Sapporo | Tokyo 23 wards | Fukuoka | Max/min |
|---|---|---|---|---|---|---|---|---|---|
| 300 L (water-saving, no communal bath) | 986 | 533 | 629 | 626 | 672 | 685 | 869 | 1,070 | 2.01x |
| 400 L (this article’s reference) | 1,314 | 700 | 839 | 874 | 915 | 933 | 1,192 | 1,485 | 2.12x |
| 500 L | 1,643 | 868 | 1,048 | 1,119 | 1,155 | 1,180 | 1,515 | 1,898 | 2.19x |
| 630 L (survey average applied as is) | 2,070 | 1,084 | 1,319 | 1,444 | 1,473 | 1,504 | 1,940 | 2,441 | 2.25x |
Two things can be read from this. First, the gap between municipalities does not disappear wherever consumption intensity is set. Even at the most conservative 300 L/guest-night the Fukuoka–Matsumoto gap is 2.01x, and at 630 L/guest-night it widens to 2.25x. If anything, a higher intensity increases the weight of the volumetric portion, so the gap expands slightly. Cost differences arising from location are not the kind of thing a property’s own water-saving efforts can cancel out.
Second, uncertainty on the absolute figure is large. The same Fukuoka property costs ¥10.70mn a year at 300 L and ¥24.41mn at 630 L — a 2.3x range. For a specific project’s business plan, therefore, one should not simply adopt this article’s 400 L but build consumption up from the equipment specification: communal baths, food and beverage, and whether laundry is done in-house. What this article asserts is not the absolute amount but the size of the relative difference between municipalities.
| Scenario | Intensity | Monthly volume | Fukuoka, annual | Matsumoto, annual | Annual gap | Multiple | Gap in room-revenue ratio | If closed via ADR |
|---|---|---|---|---|---|---|---|---|
| Optimistic | 300 L (water-saving, no communal bath) | 986 m³ | ¥10.70mn | ¥5.33mn | ¥5.38mn | 2.01x | 1.53 pt 3.05%→1.52% | +¥184/room-night |
| Mid case (this article’s reference) | 400 L | 1,314 m³ | ¥14.85mn | ¥7.00mn | ¥7.85mn | 2.12x | 2.24 pt 4.24%→2.00% | +¥269/room-night |
| Pessimistic | 630 L (survey average applied) | 2,070 m³ | ¥24.41mn | ¥10.84mn | ¥13.57mn | 2.25x | 3.87 pt 6.97%→3.09% | +¥465/room-night |
The practical implication is this. If a site selection is comparing Fukuoka with Matsumoto, then even if the intensity assumption is wrong, the direction of the conclusion — a difference of ¥184 to ¥465 in ADR — does not change. The range is wide but the sign is stable, and that is enough to act on. Conversely, if the aim is to narrow that range, what is needed is not closer scrutiny of tariff tables but a settled equipment specification.
The 2026 revision rush — the headline revision rate is not the property’s revision rate
2026 is a year in which water and sewer tariff revisions are concentrated. The principal cases, confirmed against official announcements, are as follows.
| Utility | Scope | Average revision rate | Effective date | Content and background |
|---|---|---|---|---|
| Chiba Prefectural Waterworks | Water supply | 18.6% | April 1, 2026 | First since FY1996, after 30 years. Revises both base and volumetric charges. The prefectural waterworks management council issued its recommendation on October 16, 2025 |
| Matsumoto | Water supply | 20.11% | April 1, 2026 | First since August 1988, after 38 years. Raises the standby (base) charge only, leaving the volumetric charge unchanged |
| Shimonoseki | Water supply | Approx. 20% | April 1, 2026 | Combined with a reduction funded by the national priority support grant. Meter readings from April to November 2026 receive a 100% reduction of the increase, readings from December 2026 to January 2027 receive 50%, and the new tariff applies in full from the February 2027 reading. Sewerage charges are not covered by the reduction |
| Sapporo | Sewerage | 22.6% | October 1, 2026 | First since 1997, after about 30 years. Maintenance costs rose 33% over the past decade. An ordinary loss occurred in FY2023 for the first time in 14 years, and a funding shortfall is projected for FY2027 |
Here is a point of first-order importance for investment decisions. The published “average revision rate” does not match the revision rate as a hotel experiences it. The average revision rate is the growth rate of the utility’s total water revenue, and it is pulled by a distribution in which small residential users predominate. Applying each revision to this article’s 100-room business hotel (1,314 m³/month, 50 mm meter) produces effective increases that scatter as follows.
| Utility | Published average revision rate | Before revision (monthly) | After revision (monthly) | Effective increase, 100-room BH | Annual increase |
|---|---|---|---|---|---|
| Matsumoto (water) | 20.11% | ¥253,264 | ¥265,045 | +4.7% | ¥141,372 |
| Chiba Prefectural Waterworks | 18.6% | ¥617,632 | ¥721,108 | +16.8% | ¥1,241,711 |
| Sapporo (sewerage) | 22.6% | ¥244,009 | ¥292,521 | +19.9% | ¥582,146 |
Matsumoto’s headline 20.11% comes out at an effective 4.7%. The reason is clear: Matsumoto’s revision covers the standby (base) charge only, leaving the volumetric rate of ¥176 per cubic meter untouched. For a heavy user the great majority of the bill is volumetric, so a rise in fixed charges alone is diluted. Sapporo’s sewerage revision, by contrast, raises the unit rate on every tier and so lands at an effective 19.9%, close to the headline. The Chiba Prefectural Waterworks also revises both base and volumetric charges, giving a high effective 16.8%.
The Shimonoseki case raises a further point. The city is using the national priority support grant to temporarily discount the increase, and it extended the freeze period by two months, from meter readings through September 2026 to readings through November. But this is time-limited, and it covers water charges only — sewerage is excluded. From the February 2027 reading the new tariff applies in full. Look at recent invoices during acquisition due diligence and what you will see is the post-discount amount. Project future cash flow straight off recent actuals and you will understate the cost — a point that warrants care.
The seven municipalities mapped, and the geography of the burden
Plot the municipalities covered here on a map and no geographic regularity in the size of the burden appears. It is not a simple matter of big cities being expensive and rural areas cheap; each utility’s asset renewal burden, the trajectory of its served population, and the design philosophy of its tariff structure work individually.
Site comparison checklist — five items verifiable before signing
Water and sewer is an expense line that cannot be moved after acquisition or completion. That is precisely why it is most worth checking at the site selection and design stage. The list below is confined to items that can be completed through published materials and pre-application consultation.
| Item | What to verify | How it affects the investment decision |
|---|---|---|
| 1. Meter size | Fix the required meter diameter from a simultaneous-demand calculation and confirm the base charge for that size in the ordinance tariff table. Check also whether a base volume is granted and, if so, up to how many cubic meters. | At many utilities the base charge more than doubles between 50 mm and 75 mm. In Sapporo it is ¥53,900 for 50 mm against ¥237,600 for 75 mm (monthly, tax included) — a 4.4x step. Dropping one size at the design stage is a permanent reduction in fixed cost. |
| 2. Connection and service-installation charges | Confirm the lump-sum connection charge payable on new installation, by meter size. Most utilities set it on a steep gradient against diameter. | Sapporo’s water connection charge is ¥1,782,000 for 50 mm, ¥4,950,000 for 75 mm, and ¥10,120,000 for 100 mm (tax included). Meter sizing feeds directly into initial investment. Design review and inspection fees apply separately. |
| 3. Use category applied | Confirm which use category hotels fall into at that utility, going back to the application criteria in the ordinance. Avoid inferring from the category name. | Osaka’s “business use” covers a limited set of uses such as bars and cabarets; hotels are “general use.” Get the category wrong and the assumed volumetric rate will be badly off. |
| 4. Feasibility and economics of well water and reclaimed water | Confirm ordinance restrictions on groundwater extraction (extraction permits, pumping limits, designated areas). Factor in that sewerage charges still accrue even when well water is used. Some utilities operate a volume-reduction certification scheme for water that does not enter the sewer, such as cooling-tower evaporation. | Because the sewerage portion remains even when water supply is substituted, the saving is often limited to roughly half the total. Osaka operates a wastewater volume-reduction certification scheme; where flow can be measured properly with a meter, certification can be obtained by application (it cannot be applied retroactively). |
| 5. Planned revisions and their content | Check the utility’s management strategy and financial plan, the tariff council’s recommendation, and any draft ordinance amendment submitted to the assembly. Look at whether the revision covers the base charge only or the volumetric charge as well, at tariff-table level. Check also for any temporary reduction measure in force. | The published average revision rate and the property’s effective increase do not agree (Matsumoto’s headline 20.11% becomes 4.7% for the 100-room model). Carrying billing actuals recorded while a reduction is in force straight into future cash flow also produces an understatement. |
Conclusion — as the sixth axis of location evaluation
To summarize what this article has verified.
First, the lodging industry buys water in bulk. The 630 liters per guest (Japan Association of Tourism Facilities, survey of approximately 100 properties nationwide) is more than twice what one person uses in an entire day at home. That comes to 15,768 cubic meters a year for a 100-room business hotel and 57,396 cubic meters a year for a 200-room city hotel.
Second, the price differs sharply by municipality. The annual water and sewer cost for an identically specified 100-room business hotel ranged from ¥6.99mn to ¥14.85mn — a 2.12x spread — across the seven municipalities examined. Increase the scale and the escalating structure bites, widening the gap: for the 200-room city hotel it reaches 2.35x and ¥34.03mn a year.
Third, looking at water supply alone misses 30–50%. Sewerage charges accrue in step with water consumption, and in municipalities such as Matsumoto sewerage exceeds water supply. There is no alternative to comparing the two together.
Fourth, this difference cannot be closed by operational effort. There is genuine room to cut consumption through water-saving equipment and better management of communal baths (the 26-room hot-spring ryokan cited above halved utility costs per guest from ¥1,956 to ¥992). But the unit price itself is set by the utility through ordinance, and the customer cannot choose it. There is no option to switch retailers as there is with electricity.
Fifth, and consequently, it bites at the site selection stage. For a 100-room business hotel, a property in the most expensive municipality needs ¥269 more per room-night in ADR to produce the same NOI as an identical property in the cheapest. That is 2.2% of a ¥12,000 ADR. Whether the location carries demand able to absorb that price difference is the decision input. To repeat: this is not an argument that particular municipalities are unsuited to investment. At the same ADR, the conditions for viability change — that is all. And once the conditions are known, they can be built into both ADR design and equipment specification.
Alongside station distance, land price, climate, and labor cost, water and sewer is worth adding to the investment decision’s variable table as one more immovable location cost. Hazard maps and disaster-resilience capex belong on the same framework as a further axis, and together with this sixth axis they let a full variable table for a site be assembled.
Related Reading
- 2026 Electricity Price Surge: Supply-Side Cost Impact Analysis for Hotel Operations
- Cleaning Dispatch Rate Surge & Mid-Size Hotel Pressure: 2026 H2 Polarization
- Snow as Cost or Asset: Winter RevPAR 53% vs Winter ADR 2.66x
- Leasehold Hotel Development: 1.38x Land Price Reach Across 9 Markets
- Construction +41% & Labor Crunch Erase Japan’s 2027-2029 Hotel Supply
- Hotel vs Condo Land Rivalry: ADR-Implied Feasible Land Price Map
References and Sources
■ Data sources
Water and sewer costs are values computed by applying this article’s assumed consumption volumes to the tariff tables each water utility and sewerage operator publishes by ordinance (latest versions as of August 2026; for Matsumoto, Shimonoseki, and the Chiba Prefectural Waterworks, which were revised in April 2026, the post-revision tables). ADR is MetroEngines Research & Consulting’s estimated settled ADR (12-month average from August 2025 to July 2026, all on a settled-month basis; for government-ordinance-designated cities, ward-level values combined into a property-count-weighted median, with properties covered given as the monthly median). Consumption intensity comes from the Eco Subcommittee of the Japan Association of Tourism Facilities’ survey of approximately 100 properties nationwide (as reported by Kanko Keizai Shimbun on December 5, 2017). The construction cost assumption uses the 2025 nationwide steel-frame unit rate per tsubo from the Ministry of Land, Infrastructure, Transport and Tourism’s “Statistical Survey on Building Construction Starts.”
■ Calculation assumptions
100-room business hotel = 80% occupancy, 1.35 guests per room, 400 L/guest-night, 50 mm meter (39,420 guest-nights per year, 15,768 m³ annual volume). 200-room city hotel = 78% occupancy, 1.60 guests, 630 L, 75 mm meter. 80-room hot-spring ryokan = 55% occupancy, 2.20 guests, 1,000 L, 50 mm meter. All are this article’s assumptions, not measured values from real properties. The denominator of the room-revenue ratio is room revenue only and excludes food, beverage, and other revenue. The asset value translation is a simple calculation assuming a 5.0% cap rate. Annual figures in the sensitivity analysis (Tables 9 and 10) are derived by logarithmic interpolation of this article’s average unit-price curve (¥/m³), and the reference row agrees with the built-up values in Table 3 to within 0.1%.
■ Limitations and caveats
Actual billed amounts differ from this article’s computed values according to meter-reading cycles (utilities on two-month reading apportion by month), pro-rating, various reduction schemes, and water-quality surcharges. Of the consumption intensities, the 400 L for business hotels and 1,000 L for hot-spring ryokan are this article’s assumptions, not measured survey values. Kyoto’s published quick-reference table covers only up to 200 m³, so no high-volume unit rate is shown and it is also excluded from the annual cost comparison. The Chiba Prefectural Waterworks supplies water only, with sewerage charges set separately by each city, and is likewise excluded from the annual cost comparison. ADR is an estimate and differs from each property’s actual transacted prices and accounting figures. Any investment decision requires pre-application consultation with the utility having jurisdiction over the subject site, and a project-specific build-up of water consumption based on the property’s equipment specification.
■ Market data
- MetroEngines Research & Consulting — estimated settled ADR (all categories, 12-month average from August 2025 to July 2026; for government-ordinance-designated cities, ward-level values combined into a property-count-weighted median)
■ Water and sewer tariffs (published tariff tables of each utility)
- Tokyo Metropolitan Bureau of Waterworks, “How water and sewerage charges are calculated (23 wards)”
- Osaka City Waterworks Bureau, “How water charges work, and the tariff table” (including use-category application criteria) / same, “Quick-reference tables and formulas for water charges and sewerage charges” / Osaka City, “Guide to sewerage charges” (wastewater volume-reduction certification scheme)
- Sapporo City Waterworks Bureau, “How water charges are calculated” / Sapporo City, “Sewerage charges” / Sapporo City, “Notice of sewerage charge revision” (October 2026, average 22.6%) / Sapporo City Waterworks Bureau, “Water connection charges and fees”
- Fukuoka City Waterworks Bureau, “How water charges work, calculation methods, and quick-reference tables” / Fukuoka City, “How sewerage charges are calculated”
- Kumamoto City Waterworks and Sewerage Bureau, “Read-aloud tariff table (water charges and sewerage charges), effective October 2019”
- Shimonoseki City, “About water charges and sewerage charges” (revised April 1, 2026) / Shimonoseki City, “Outline of the water tariff support program (tariff reduction)”
- Matsumoto City, “How water charges are calculated” (tariff tables before and after revision) / Matsumoto City, “How sewerage charges are calculated” / Matsumoto City, “Water tariffs will be revised from April 1, 2026”
- Chiba Prefecture, “On the revision of water tariffs” / Chiba Prefecture, “On the increase in prefectural waterworks tariffs” (tariff tables before and after revision)
- Kyoto City Waterworks Bureau, “Quick-reference tariff table” (50 mm meter)
■ Consumption intensity and utility costs
- Kanko Keizai Shimbun, “‘Eliminating waste in utility costs’ — symposium by the facilities association and the ryokan association” (December 5, 2017) — source of the Japan Association of Tourism Facilities Eco Subcommittee’s survey of approx. 100 properties nationwide (630 L/guest-night of water) and the Japan Ryokan & Hotel Association’s FY2015 statistics (utility costs of ¥1,259–1,346 per guest)
- Kanko Keizai Shimbun, “[Decarbonized, smart ryokan 1] Why do ryokan use so much water?”, Japan Association of Tourism Facilities Eco Subcommittee (April 14, 2023)
- Kanko Keizai Shimbun, “[Decarbonized, smart ryokan 65] Water consumption is a barometer of CO2 emissions” (February 1, 2026) — source of the figure of 282 liters of household water use per person per day (Ministry of Land, Infrastructure, Transport and Tourism data)
■ Construction cost and investment assumptions
- Ministry of Land, Infrastructure, Transport and Tourism, “Statistical Survey on Building Construction Starts” — 2025, nationwide, steel frame, ¥2.405mn per tsubo