

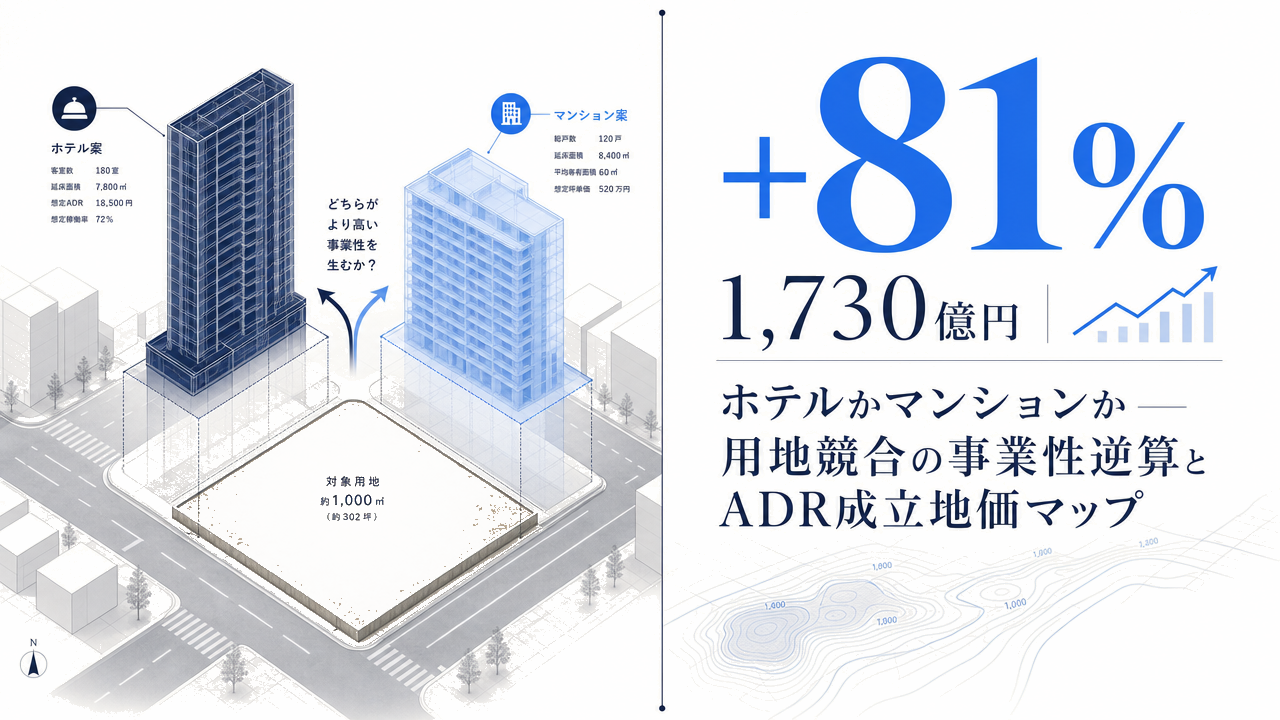
Domestic hotel acquisition volume in Japan reached approximately ¥173 billion in Q1 2026, up +81% year-on-year, with J-REIT hotel acquisitions hitting an all-time quarterly high (CBRE, Nikkei). Backed by inbound demand, capital from REITs and foreign funds is concentrating on Japanese hotels, and across major urban commercial districts nationwide a tug-of-war is unfolding over the same plots: “should this site become a hotel, or a condominium for sale?” In this report, we work backward from ADR tiers in six major prefectures to compute the “feasible land price ceiling” at which hotels outbid the opportunity cost of condo development, and we quantify the locations where land rivalry is most intense and where hotels can prevail.
Metric Definitions Used in This Article
- ADR (Average Daily Rate): Average of advertised prices published on OTAs. Differs from actual transacted prices (cross-checks against REIT disclosures show advertised ADR runs +25-30% higher than transacted ADR. This is structural: unsold higher-priced plans linger on OTAs, pushing the average of advertised prices above transacted prices). Per-room rate for 2 guests/room (tax included), averaged across all plans (room-only through meal-included).
- OCC (Occupancy Rate): Ratio of sold rooms to total room inventory in the area (estimated from OTA inventory). Used in this article only for short-term inter-city demand comparison, not for long-term trends.
- Feasible Land Price Ceiling: The maximum land acquisition price acceptable under the development scenario assumptions (detailed below) such that the target yield is met. This is a simplified reverse-calculation of feasibility; actual investment decisions require detailed feasibility studies.
- Data Source: MetroEngines Research & Consulting
- — Domestic hotel acquisition volume in Q1 2026 reached +81% YoY at approximately ¥173 billion, with J-REIT hotel acquisitions hitting an all-time quarterly high.
- — By ADR-implied feasible land price math, hotels outbid the opportunity cost of condominium development in 5 of 6 major prefectures, putting them in position to grab land at premium prices.
- — The sole exception is Tokyo. With 23-ward condo unit prices at ¥2.14M/m², residential floor value (feasible land ceiling ¥4.68M/m²) outstrips hotels (¥2.73M/m²), giving condos the upper hand in the land contest.
- — The largest land headroom sits in Hokkaido, Fukuoka, and Okinawa. Against condo paying capacity of ¥210K-¥390K/m², hotels can pay ¥1.90M-¥2.63M/m² — several multiples higher.
- — Kyoto leads on ADR (¥42,100) with a feasible land ceiling of ¥4.93M/m². Even under a simultaneous ADR -10% and OCC -5pt downside, it still beats condos by ¥2.09M/m² — the hotel advantage holds.
The Land Tug-of-War — REIT Hotel Buys Hit Quarterly Record as Condo Supply Falls to a 53-Year Low
According to CBRE, Q1 2026 domestic commercial real estate investment reached an all-time quarterly high of approximately ¥2.043 trillion. Hotels in particular grew at a double-digit YoY pace, and J-REIT hotel acquisitions set a new quarterly record. Expected NOI yields for operator-leased hotels in Tokyo’s five central wards fell -5bps QoQ to a new all-time low, signaling that buyers are aggressively bidding prices higher.
Meanwhile, the condominium market is moving in the opposite direction. According to the Real Estate Economic Institute, the average price of new condominiums in the Greater Tokyo Area in FY2025 was ¥93.83 million, up +15.3% YoY for the fifth consecutive record-high year, while units launched fell -2.6% to 21,659 — the lowest since the survey began in FY1973. The driver behind this divergence is “depletion of suitable development land.” In short: condo developers are throttling supply because they cannot secure sites, while hotels — backed by REIT capital — are grabbing land at premium prices. That is the anatomy of the “tug-of-war.”
The essential variable separating the two is the revenue ceiling that the location can generate. For condos, paying capacity for land is set by “sale price × floor area”; for hotels, by “ADR × occupancy × room count.” This report starts from MetroEngines Research’s ADR data for six major prefectures and works backward to compute the land price level at which hotels still beat condos.
Reverse-Engineering the “Feasible Land Ceiling” from ADR Tiers — Condos as Opportunity Cost
To judge whether a hotel or a condominium can pay more for the same site, we compare the “feasible land price ceilings” implied by each business. We adopted the following assumptions (all set conservatively; sources are listed at the end of the article).
| Assumption | Hotel (Mid-tier) | Condominium |
|---|---|---|
| Floor Area Ratio (FAR) | 600% (commercial zone) | 600% (commercial zone) |
| Efficiency Ratio (revenue floor / total floor) | 62% (guest rooms) | 72% (saleable area) |
| Effective Floor per Room | 28 m² | — |
| Occupancy / Sell-Through | OCC 80% (full-year basis) | Sell-through 72% |
| Revenue Metric | ADR (converted to transacted basis) | Condo unit price ¥/m² |
| GOP Margin / Developer Margin | GOP 35% | Margin 20% |
| Construction Cost (¥ / tsubo) | ¥2.2M | ¥1.5M |
| Target Yield | NOI yield 5% | — |
* Hotel ADR is converted to a transacted basis by applying a 0.78 coefficient (approx. -22%), reflecting the structural fact that advertised prices (OTA averages) run +25-30% higher than transacted prices. This yields a conservative feasible land ceiling stripped of the advertised-price overshoot.
Running the math across the six prefectures, the hotel feasible land ceiling is highest in Kyoto by a wide margin (¥4.93M/m²) and lowest in Osaka (¥1.24M/m²). The ADR ranking maps directly to paying capacity for land. What matters most is the reversal pattern that emerges when we lay these next to the land price ceilings condos can afford (the opportunity cost) in each prefecture.
The result is clear-cut. In 5 of the 6 prefectures, hotels outbid the opportunity cost of condominium development, putting them in a position to grab land at premium prices. In Hokkaido, Fukuoka, and Okinawa in particular, hotels (¥1.90M-¥2.63M/m²) pay several multiples of what condos can afford (¥210K-¥390K/m²), giving hotels an overwhelming advantage in regional cities and resort locations. For landowners and sellers considering PRE (public real estate) deployment, selling or leasing to hotel use clearly extracts more value than selling to condo developers in these markets.
The sole exception is Tokyo. With 23-ward condo prices at ¥2.14M/m², the condo feasible land ceiling reaches ¥4.68M/m², well above hotels at ¥2.73M/m². In central Tokyo, the floor value generated by residential demand exceeds the floor value generated by hotel ADR, so condominiums prevail in the land contest. The “hotel investment boom” is not uniform nationwide — in central Tokyo, condos are actually more likely to win the bid for land. The reverse-calculation makes this explicit.
| Prefecture | ADR | Hotel Land Ceiling/m² | Condo Land Ceiling/m² | Land Rivalry Verdict |
|---|---|---|---|---|
| Kyoto | ¥42,100 | ¥4,930,000 | ¥1,770,000 | Hotel prevails |
| Tokyo | ¥31,700 | ¥2,730,000 | ¥4,684,000 | Condo prevails |
| Hokkaido | ¥31,300 | ¥2,629,000 | ¥215,000 | Hotel prevails |
| Fukuoka | ¥29,300 | ¥2,215,000 | ¥388,000 | Hotel prevails |
| Okinawa | ¥27,800 | ¥1,900,000 | ¥388,000 | Hotel prevails |
| Osaka | ¥24,700 | ¥1,240,000 | ¥1,079,000 | Hotel prevails (narrow) |
* The feasible land ceiling is a simplified reverse-calculation based on the assumptions above. Condo ¥/m² figures are reference values keyed to each area’s new-build benchmark (Greater Tokyo FY2025 actuals, etc.). Actual land deals turn on FAR, zoning, construction cost, and interest rates at the parcel level, so this table is best read as directional — “which side has the structural capacity to bid higher.”
Land Rivalry Map — Overlaying Commercial Land Prices with the Hotel Feasibility Ceiling
When the feasible land ceiling is laid over actual published commercial land prices, the temperature differential across locations becomes visible. The 2026 Land Price Publication shows an all-use national average of +2.8% YoY, with commercial land at +4.3% — the largest gain since the bubble era. Kyoto Prefecture commercial land averaged ¥1,006,700/m² (+7.94%), the Tokyo metropolitan area was +5.7% all-use, and the Osaka metropolitan area +3.8% (MLIT). The map below overlays the gap between this article’s feasible land ceiling and central commercial land prices in six major cities (= hotel development land headroom).
| National All-Use Average | +2.8% |
| National Commercial | +4.3% |
| Kyoto Prefecture Commercial | +7.94% |
| Greater Tokyo All-Use | +5.7% |
| Greater Osaka All-Use | +3.8% |
The map shows that hotels prevail in the land rivalry only where “ADR paying capacity comfortably outstrips commercial land prices.” In cities like Kyoto, Fukuoka, and Sapporo — where inbound-driven ADR absorbs land-price inflation — hotels retain meaningful headroom to bid for land. Conversely, in central Tokyo, where residential floor value is exceptionally high, hotels only outbid condos in the narrow top-tier luxury band; mid- to upper-mid-tier hotels struggle to win the land contest.
Positioning Analysis — Identifying Price-Band Whitespace via ADR × Short-Term Demand
Once land is secured, the next question is “at what price band to develop.” Overlaying segment-level ADR for the six prefectures with MetroEngines Research’s recent short-term demand estimates (May 2026 estimated OCC) reveals “whitespace” where competition is thin but demand is thick. The bubble chart below plots segment ADR on the x-axis, short-term demand (estimated OCC) on the y-axis, and supply scale (a proxy for facility count by category) as bubble size.
Dense Economy Tier (up to ¥18k)
Business hotels dominate facility counts in every city — the most crowded zone. New entrants get pulled into price competition, and paying premium prices for land rarely pencils out.
WS1 Upper-Mid Tier (¥30k-¥55k)
As seen in Kyoto machiya / ryokan (¥36k-¥53k) and Fukuoka / Hokkaido resorts (¥42k-¥47k), demand is thick but supply is limited. Short-term demand also runs high. Best targeted in regional cities and resort areas with ample land headroom.
WS2 Luxury Tier (¥80k+)
The deluxe tier — Kyoto ¥138k, Okinawa ¥131k, Hokkaido ¥88k — has extremely few properties (10-33 per prefecture) and is also the only hotel band that can beat condos in central Tokyo. High scarcity, and the only band where hotels still outbid residential floor value.
The positioning analysis points to a two-layer land strategy. First, in cities with ample land headroom — Kyoto, Fukuoka, Hokkaido, Okinawa — developing mid-sized hotels in the upper-mid tier (WS1) is the rational play on both demand thickness and thin competing supply. Second, in central Tokyo where condos prevail in the land contest, hotels can only win in the luxury tier (WS2). Only at the top end, where hotel ADR exceeds residential floor value, is it worth bidding for sites for hotel use.
Supply Pipeline — 2026 Openings by Prefecture and Land Rivalry Intensity
The “result” of the land rivalry shows up in the geographic skew of new openings. Within MetroEngines Research’s coverage, 2026 openings (already-opened or scheduled, OTA-listing confirmation basis) by prefecture put Okinawa 45, Kyoto 44, Tokyo 43, Shizuoka 38, and Hokkaido 38 at the top. Kyoto, Hokkaido, and Okinawa — where ADR paying capacity wins the land rivalry — rank near the top, but Tokyo (where condos prevail) is also high at 43. That reflects both Tokyo’s sheer market scale and the fact that development is succeeding in the luxury tier specifically.
Overlaying supply with land-rivalry intensity reveals three patterns. (1) Hotel prevails × supply active (Kyoto, Hokkaido, Okinawa, Fukuoka): ADR generates winning paying capacity for land, and new openings are active. Hotel-use disposition is the strongest exit for landowners and PRE deployment. (2) Condo prevails but supply is active (Tokyo): Land flows preferentially to condos, but the luxury tier still pencils out for hotels. Site sourcing requires careful price-band discipline. (3) Soft ADR (Osaka): Hotel feasible land ceiling lowest of the six prefectures, with post-Expo demand reversal risk. Land acquisition calls for conservative demand assumptions.
| Prefecture | 2026 Openings | ADR | Land Rivalry Verdict | Land Strategy Direction |
|---|---|---|---|---|
| Okinawa | 45 | ¥27,800 | Hotel prevails | Ample headroom in the resort band, but land is scarce |
| Kyoto | 44 | ¥42,100 | Hotel prevails | Thick demand in machiya / upper-mid band |
| Tokyo | 43 | ¥31,700 | Condo prevails | Source land only for the luxury band |
| Hokkaido | 38 | ¥31,300 | Hotel prevails | Largest headroom in resort × upper-mid band |
| Fukuoka | 30 | ¥29,300 | Hotel prevails | ADR paying capacity comfortably exceeds commercial land prices |
| Osaka | 23 | ¥24,700 | Hotel prevails (narrow) | Underwrite demand conservatively; watch post-Expo reversal |
Investment Decision Summary — A Land-Sourcing and PRE Deployment Decision Map
To summarize the reverse-engineering: who wins the land rivalry comes down to whether ADR paying capacity at that location exceeds residential floor value (the opportunity cost). For developer land teams, fund acquisition teams, and landowners / PRE sellers, the decision direction collapses into three points.
Regional Cities & Resorts
In Kyoto, Fukuoka, Hokkaido, and Okinawa, hotels have feasible land ceilings several multiples above condos. Landowners and PRE sellers can extract the highest consideration via hotel-use exits — a real growth opportunity. Mid-scale upper-mid-tier development is the rational play on both supply and demand.
Central Tokyo
Residential floor value is high and condos prevail in the land contest. Hotels can only win in the luxury tier. Land sourcing discipline on price band is what separates success from failure, with the upside concentrated in top-tier differentiation.
Osaka — Mind the Demand Assumption
ADR is the lowest of the six prefectures and the feasible land ceiling is thin. Conservative assumptions are needed, pricing in post-Expo demand reversal risk. There is meaningful room to stress-test occupancy and rate downside at the acquisition stage.
| Sensitivity Analysis (Kyoto, mid-tier hotel) | Base | ADR -10% | OCC -5pt | Both |
|---|---|---|---|---|
| Feasible Land Ceiling/m² | ¥4,930,000 | ¥4,290,000 | ¥4,470,000 | ¥3,860,000 |
| Spread vs Condo Ceiling | +¥3,160,000 | +¥2,520,000 | +¥2,700,000 | +¥2,090,000 |
* Even with ADR -10% and OCC -5pt combined, Kyoto’s hotel feasible land ceiling still beats condos by ¥2.09M/m² — the land rivalry advantage holds. This shows the robustness of the reverse-calculation. Simplified analysis only; detailed feasibility studies are required for actual investment decisions.
Note on forward dates and forward supply: ADRs in this article are averages of advertised prices on OTAs at the time of analysis and shift as check-in dates approach. The 2026 new opening counts are on an OTA-listing confirmation basis; because listings typically appear several months before opening, the most recent and forward months may grow as additional listings emerge. For the Kansai region in particular, please note post-Expo demand reversal risk.
Conclusion
The “hotel investment boom” is not uniform nationwide. In Kyoto, Fukuoka, Hokkaido, and Okinawa — where ADR paying capacity exceeds residential floor value — hotels have feasible land ceilings several multiples above condos and prevail overwhelmingly in the land rivalry. By contrast, in central Tokyo, where residential floor value is exceptionally high, hotels only win in the luxury tier, and condos take the mid-tier sites. Land sourcing and PRE deployment decisions, framed around this “ADR paying capacity vs opportunity cost” reverse-calculation, can quantitatively narrow down the thin-competition segments and the most advantageous locations.
References & Sources
Data Sources
ADR, segment ADR, and estimated occupancy (OCC) are compiled by MetroEngines Research & Consulting from OTA advertised prices and inventory (six major prefectures, N=6,358 properties: Kyoto 1,558 / Tokyo 1,853 / Hokkaido 1,675 / Okinawa 1,703 / Fukuoka 731 / Osaka 838). Commercial land prices and growth rates from MLIT’s “2026 Land Price Publication”; condo ¥/m² and units launched from the Real Estate Economic Institute; investment volumes and expected yields from CBRE Q1 2026.
Model Assumptions
The feasible land ceiling is computed under common assumptions: FAR 600%, construction cost (hotel ¥2.2M / tsubo, condo ¥1.5M / tsubo), efficiency ratio (hotel 62%, condo 72%), hotel NOI yield 5%, and condo developer margin 20%. Hotel ADR is converted to a transacted basis by applying a 0.78 coefficient, reflecting the structural +25-30% premium of advertised over transacted prices. Condo feasible land ceilings reference each area’s new-build benchmark (Greater Tokyo FY2025 actuals, etc.).
Limitations & Caveats
The feasible land ceiling presented here is a directional simplified reverse-calculation; actual land acquisitions turn on FAR, zoning, construction cost, interest rates, and parcel-level rights, so investment decisions require detailed feasibility studies (DD). ADRs are OTA advertised-price averages and differ from transacted prices; OCC is an inventory-based estimate used only for short-term demand comparison. The 2026 new opening count is on an OTA-listing confirmation basis, with recent months likely to grow. For Kansai, mind post-Expo demand reversal risk.
Market Data
- MetroEngines Research & Consulting — OTA advertised price data (six major prefectures ADR, N=6,358 properties), segment ADR, estimated occupancy (OCC, OTA inventory basis), 2026 new openings (OTA-listing confirmation basis)
Government Statistics & Public Data
- MLIT “2026 Land Price Publication” — commercial land prices and growth rates
- MLIT “Building Construction Statistics” — hotel construction cost per tsubo
REIT & Industry Reports
- CBRE “Japan Investment MarketView Q1 2026” — investment volume, hotel acquisitions, expected yields
- Real Estate Economic Institute “Greater Tokyo New Condo Market Trends” — average price, ¥/m², units launched
- Invincible Investment Corporation “Monthly Operating Performance April 2026” — operator-leased hotel GOP and occupancy reference
News & Press Releases