

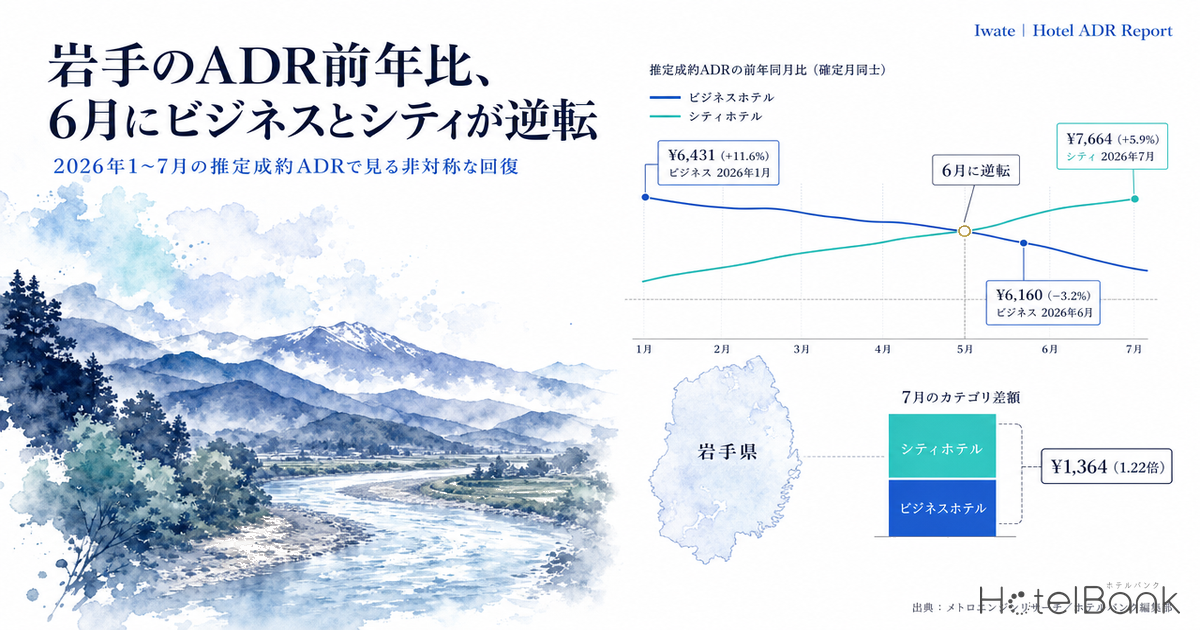
Line up Iwate’s settled ADR estimates as year-on-year comparisons between finalized months, and the periods in which business hotels and city hotels grew turn out to be cleanly out of step. In January 2026, business hotels posted double-digit growth at ¥6,431 (¥5,761 a year earlier, +11.6%, N=85 properties), while city hotels managed only ¥7,278 (¥7,118 a year earlier, +2.2%, N=18 properties). By June the positions had swapped: business hotels fell to ¥6,160 (−3.2%) — their only year-on-year decline — while city hotels reached ¥7,314 (+4.3%). In July, city hotels at ¥7,664 (+5.9%) outpaced business hotels at ¥6,300 (+4.1%). Business hotels ran early in the year; city hotels came through in the second half — that asymmetry is what Iwate’s market actually looked like through the first half of 2026.
About the data in this article
Scope: business hotels (N=83–87 properties) and city hotels (N=18 properties) in Iwate Prefecture. The price metric used here is the settled ADR estimate (an estimated transacted price level derived from OTA and other sales data, tax-exclusive equivalent); occupancy is an estimate based on OTA-listed inventory. Both definitions appear at the end of the article. Data as of August 26, 2026.
- — Business hotels averaged +4.3% over January–July (¥6,003 → ¥6,258). But the growth is fading as the year progresses: +6.2% in January–March against +2.9% in April–July.
- — City hotels came in at +2.3% (¥7,163 → ¥7,329) — a smaller gain, but moving the other way: +1.4% in January–March → +3.0% in April–July, accelerating into the second half.
- — The year-on-year lines crossed in June. Business −3.2% against city +4.3% flipped the order, and city hotels stayed 1.8 points ahead in July as well.
- — January’s +11.6% is a rebound, not a breakout. January 2026’s ¥6,431 is about level with January 2024’s ¥6,406, and the January–July average is −2.3% against two years earlier.
- — The depth of the demand trough differs by segment. For June–July 2026, Sunday estimated OCC was 77.5% at business hotels and 83.0% at city hotels (gaps to Saturday of 15.5 and 11.6 points).
Business hotels — January’s double-digit gain is a rebound, not a breakout
Start with business hotels (N=83–87 properties), viewing the settled ADR estimate as a year-over-year overlay. Finalized figures for 2026 run through July: ¥6,431 in January, ¥5,991 in February, ¥5,937 in March, ¥6,318 in April, ¥6,672 in May, ¥6,160 in June and ¥6,300 in July. The January–July average is ¥6,258, or +4.3% against ¥6,003 for the same period in 2025.
The composition of that growth, though, varies sharply by month. Year-on-year change was +6.2% in January–March and +2.9% in April–July — momentum falling off as the year goes on. January’s +11.6% in particular owes much to its comparison base: January 2025’s ¥5,761 sat −10.1% below January 2024’s ¥6,406, a deep trough. In fact, January 2026’s ¥6,431 is barely above January 2024’s ¥6,406 (+0.4%). On the January–July average against two years earlier, 2026 is −2.3% versus 2024’s ¥6,404 — still short of the 2024 level.
The shape within the year is distinctive too. Among 2026’s finalized months, May’s ¥6,672 is the high and March’s ¥5,937 the low, a spread of ¥735. February–March, at the turn of the fiscal year, is the bottom; May, which contains the long holiday run, jumps once; June falls back to ¥6,160 before July recovers — a “twice-dipping” profile.
Source: MetroEngines Research; compiled by the HotelBank Editorial Team
City hotels — quiet in the first half, a May stumble recovered in June–July
City hotels (N=18 properties) posted these finalized months for 2026: ¥7,278 in January, ¥7,084 in February, ¥7,052 in March, ¥7,430 in April, ¥7,484 in May, ¥7,314 in June and ¥7,664 in July. The January–July average is ¥7,329, or +2.3% against ¥7,163 a year earlier — smaller than the +4.3% at business hotels.
But the month-by-month sequence runs the opposite way. Year-on-year change in January–March was +1.4%, close to flat, and May slipped below the prior year at −1.1%. From there it accelerated into the second half — +4.3% in June, +5.9% in July — with April–July at +3.0%, above January–March. July’s ¥7,664 is the highest of 2026’s finalized months and stands +2.2% above July 2024’s ¥7,500, making it the strongest July of the three years.
As a result, the level gap between business and city hotels widened over the year. January’s gap was ¥847 (a ratio of 1.13x); July’s was ¥1,364 (1.22x). Same prefecture, same months — yet the spread between the two segments’ price bands moved by more than ¥500 in half a year.
Source: MetroEngines Research; compiled by the HotelBank Editorial Team
| Month | Business 2025 | Business 2026 | YoY | City 2025 | City 2026 | YoY | Gap (2026) |
|---|---|---|---|---|---|---|---|
| Jan | ¥5,761 | ¥6,431 | +11.6% | ¥7,118 | ¥7,278 | +2.2% | ¥847 |
| Feb | ¥5,723 | ¥5,991 | +4.7% | ¥7,008 | ¥7,084 | +1.1% | ¥1,093 |
| Mar | ¥5,808 | ¥5,937 | +2.2% | ¥6,988 | ¥7,052 | +0.9% | ¥1,115 |
| Apr | ¥6,025 | ¥6,318 | +4.9% | ¥7,206 | ¥7,430 | +3.1% | ¥1,112 |
| May | ¥6,287 | ¥6,672 | +6.1% | ¥7,566 | ¥7,484 | −1.1% | ¥812 |
| Jun | ¥6,366 | ¥6,160 | −3.2% | ¥7,014 | ¥7,314 | +4.3% | ¥1,154 |
| Jul | ¥6,049 | ¥6,300 | +4.1% | ¥7,240 | ¥7,664 | +5.9% | ¥1,364 |
| Jan–Jul avg | ¥6,003 | ¥6,258 | +4.3% | ¥7,163 | ¥7,329 | +2.3% | ¥1,071 |
N = 83–87 business properties and 18 city properties (varies by month). All comparisons are between finalized months. Source: MetroEngines Research; compiled by the HotelBank Editorial Team
The year-on-year lines crossed in June
Plotting only the two segments’ year-on-year rates makes the crossing point obvious. In January, business hotels sat 9.4 points above city hotels; that gap narrowed to 3.6 pt in February and 1.3 pt in March, widened once to 7.2 pt in May, then reversed in June at business −3.2% / city +4.3%. In July city hotels remained 1.8 pt ahead.
Source: MetroEngines Research; compiled by the HotelBank Editorial Team
To test whether this “strong at the start of the year, stalling in early summer” shape is specific to Iwate, the same finalized-month year-on-year series was taken for business hotels in three neighboring Tohoku prefectures. The January–July average year-on-year change was +4.3% in Iwate, +3.2% in Aomori, +5.2% in Akita and +9.9% in Miyagi — Iwate in the middle. Split into January–March and April–July, however, three of the four share the same deceleration: Iwate (+6.2% → +2.9%), Aomori (+5.0% → +2.1%) and Miyagi (+14.8% → +6.6%). Only Akita accelerated (+4.2% → +5.8%). The early-summer stall at business hotels is not something that happened in Iwate alone. For a standalone look at a neighboring prefecture using the same finalized-month method, Aomori Settled ADR July 2026: Ryokan +19.1%, Business Hotels +0.6% covers how the gap between segments widened there in detail.
| Prefecture | 2025 Jan–Jul avg | 2026 Jan–Jul avg | YoY | Jan–Mar | Apr–Jul | N (properties) |
|---|---|---|---|---|---|---|
| Iwate | ¥6,003 | ¥6,258 | +4.3% | +6.2% | +2.9% | 83〜87 |
| Aomori | ¥6,560 | ¥6,770 | +3.2% | +5.0% | +2.1% | 81〜90 |
| Akita | ¥6,897 | ¥7,254 | +5.2% | +4.2% | +5.8% | 52〜61 |
| Miyagi | ¥6,855 | ¥7,533 | +9.9% | +14.8% | +6.6% | 139〜143 |
Source: MetroEngines Research; compiled by the HotelBank Editorial Team
Demand-side confirmation — the Sunday trough runs deeper in one segment
Against that price asymmetry, how did demand behave? Estimated OCC (OTA-listed-inventory basis) for June and July 2026 shows business hotels at 85.7% in June and 89.5% in July (65–75 properties in scope), and city hotels at 86.6% and 89.2% (15–17 properties) — near-identical on a monthly average.
The difference appears by day of week. Grouping the 61 days of June–July 2026 by weekday, business hotels ran 93.0% on Saturday against 77.5% on Sunday — a spread of 15.5 points. City hotels were 94.6% on Saturday and 83.0% on Sunday, a spread of just 11.6 points. The Sunday floor at business hotels sits 5.5 points below that of city hotels. Business hotels are also weak on Monday at 83.2%, giving a structure with a wide drop between the weekday peak (Wednesday 91.3%, Thursday 91.9%) and the troughs at the start of the week and just after the weekend. This pattern of the trough landing on different weekdays by segment is not unique to Iwate: Hokkaido Business Hotels Aren’t Weekend-Led shows the same shape — a thick Tuesday–Thursday with troughs on Sunday and Monday.
The highest estimated OCC days across these two months were Saturday, July 18, 2026 at 99.4% for business hotels and Tuesday, July 28, 2026 at 99.5% for city hotels (July 18 was the runner-up there at 99.4%). July 18 was the first day of a three-day weekend. The lowest were Sunday, June 14 at 73.0% for business hotels and Sunday, July 5 at 78.7% for city hotels.
| Day | Mon | Tue | Wed | Thu | Fri | Sat | Sun |
|---|---|---|---|---|---|---|---|
| Business | 83.2% | 89.1% | 91.3% | 91.9% | 87.1% | 93.0% | 77.5% |
| City | 83.5% | 87.1% | 88.6% | 89.8% | 88.8% | 94.6% | 83.0% |
N = 65–75 business properties and 15–17 city properties. Source: MetroEngines Research; compiled by the HotelBank Editorial Team
The current booking curve — strong pickup for the September holiday run and early October
Within the window that can still be acted on — observations from 45 days before the stay date up to the latest reading — here is the pace for the main weekends and holidays in September and October. At business hotels, Saturday, September 19 moved 81.7% at 45 days out → 89.3% at 30 days out → 92.7% latest, and Monday, September 21 went 82.1% → 90.4% → 92.1%: strong pickup across the five-day run from Saturday, September 19 to Wednesday, September 23. Saturday, September 12, by contrast, is the loosest date in this period at 70.6% → 76.1% → 83.3%. Saturday, October 3 was already at 89.2% at 45 days out, well above the 45-day level of any other date.
City hotels are running ahead of business hotels across the board: Saturday, September 19 went 90.2% at 45 days out → 94.2% at 30 days out → 96.4% latest, and Monday, September 21 moved 85.8% → 95.1% → 97.0%. Even the loosest date, Saturday, September 12, stood at 84.5% at 45 days out — 13.9 points above business hotels on the same date (70.6%). That difference in starting point — city hotels around 90% at 45 days out, business hotels in the 70s and 80s — carries straight through to the gap in current levels. The same three-checkpoint view applied to Iwate’s Obon period appears in Iwate Obon 2026: Aug 13 Peaks 92.5%, Aug 15 Dips to 78.9% Both Types, where the position of the trough is broken out by segment.
| Stay date | Business 45d out | 30d out | Latest | City 45d out | 30d out | Latest |
|---|---|---|---|---|---|---|
| Sep 5 (Sat) | 77.4% | 84.0% | 92.2% | 85.8% | 89.6% | 92.8% |
| Sep 12 (Sat) | 70.6% | 76.1% | 83.3% | 84.5% | 87.3% | 89.5% |
| Sep 19 (Sat) | 81.7% | 89.3% | 92.7% | 90.2% | 94.2% | 96.4% |
| Sep 21 (Mon) | 82.1% | 90.4% | 92.1% | 85.8% | 95.1% | 97.0% |
| Sep 26 (Sat) | 77.0% | — | 80.9% | 89.8% | — | 90.9% |
| Oct 3 (Sat) | 89.2% | — | 90.4% | 91.9% | — | 92.1% |
“—” indicates the 30-days-out observation point had not yet been reached. “Latest” = observation as of August 25, 2026. N = 74–75 business properties and 17 city properties. Source: MetroEngines Research; compiled by the HotelBank Editorial Team
For revenue managers running business and city hotels in Iwate — implications and an action plan
(a) Operational insights
1. Do not let “up year-on-year” stand as a single annual headline. Iwate’s business hotels averaged +4.3% over January–July, but the composition differs: +6.2% in January–March against +2.9% in April–July. Judging your own results on the annual average alone hides the early-summer stall behind the start-of-year rebound. Shift to a granularity that places market YoY next to your own YoY quarterly — monthly if you can.
2. Check the state of the comparison year before reading a growth rate. The +11.6% at business hotels in January owes much to January 2025 having sat −10.1% below 2024, and January 2026’s ¥6,431 remains roughly level with January 2024’s ¥6,406. Even on the January–July average, 2026 is −2.3% against 2024. Reading this as “back to the level of two years ago” rather than “double-digit growth means strength” will keep next January’s targets from being set too high.
3. Use the fact that the gap between the segments’ price bands moved more than ¥500 in half a year as a position check. The city-to-business gap widened from ¥847 in January to ¥1,364 in July. If you are a business hotel reaching for the upper price band, the months in which this gap widened are the months you sit furthest from the band above. Conversely, for a city hotel, July is the month in which the distance from business hotels was stretched the most — worth reviewing what you were selling at the time.
4. The depth of the day-of-week trough differs by segment. On June–July estimated OCC, Sunday was 77.5% at business hotels and 83.0% at city hotels. Business hotels carry a wide 15.5-point Saturday-to-Sunday spread, with structural troughs on Sunday and Monday (83.2%). Treat this as room to fill through length-of-stay and arrival-day design rather than by cutting rate.
| Horizon | Action | Decision trigger | Objective |
|---|---|---|---|
| Today–this week | Decide up front how to handle remaining inventory for Saturday, September 12 | If, as a business hotel, your pace for that date is running below the market’s latest 83.3% (70.6% at 45 days out for the same date) | Avoid defaulting to last-minute discounting on September’s loosest weekend |
| Today–this week | Review your setup for the five-day run from Saturday, September 19 to Wednesday, September 23 | If the market’s latest pace is 92.7% / 92.1% for business hotels and 96.4% / 97.0% for city hotels and your property is tracking at or above that | Use it as grounds not to clear remaining inventory cheaply |
| Within two weeks | Rebuild early-October weekends on the assumption of an early ramp | For Saturday, October 3 the market stood at 89.2% for business hotels and 91.9% for city hotels at 45 days out. If your pace for that date is well below this | Detect a slow ramp at the 45-days-out cross-section |
| Within two weeks | Prepare one length-of-stay design aimed at the Sunday and Monday trough | If your Sunday occupancy sits further below Saturday than the market’s 15.5 points for business hotels | Look for room to fill the trough by means other than cutting rate |
| Looking to next month | Align the rate-revision calendar with the in-year shape of “February–March low, May high” | For business hotels, 2026’s finalized months put March’s ¥5,937 at the low and May’s ¥6,672 at the high, a spread of ¥735. If your annual calendar is out of phase with these peaks and troughs | Move revision timing closer to the market’s seasonal shape |
| Looking to next month | Set January 2027 targets against two years earlier as well | Given that January 2026’s market level of ¥6,431 is roughly the same as January 2024’s ¥6,406, if you are building targets on year-on-year alone | Avoid mistaking a rebound-phase growth rate for underlying strength |
Source: MetroEngines Research; compiled by the HotelBank Editorial Team
Where might the second half of 2026 land — three scenarios as a mapping of finalized figures
Everything above concerns the finalized months of January–July. So how should the second half be framed? Rather than forecasting, this sets out the levels implied if the swings actually observed in January–July 2026 simply continued into August–December. The method is simple: take the quartiles of the seven finalized-month year-on-year readings for January–July 2026 (business −3.2% to +11.6%, city −1.1% to +5.9%) and apply them to the finalized levels of August–December 2025. Both the multiplier and the base are finalized values, so no estimate for August 2026 or later is used anywhere.
| Scenario | Aug | Sep | Oct | Nov | Dec | Aug–Dec avg |
|---|---|---|---|---|---|---|
| Business hotels (N=83–87 properties) | ||||||
| 2025 actual (finalized) | ¥7,086 | ¥6,073 | ¥6,538 | ¥6,657 | ¥5,943 | ¥6,459 |
| Pessimistic (lower quartile +3.2%) | ¥7,312 | ¥6,267 | ¥6,747 | ¥6,869 | ¥6,133 | ¥6,665 |
| Mid (median +4.7%) | ¥7,418 | ¥6,357 | ¥6,844 | ¥6,969 | ¥6,221 | ¥6,762 |
| Optimistic (upper quartile +5.5%) | ¥7,475 | ¥6,406 | ¥6,897 | ¥7,022 | ¥6,269 | ¥6,814 |
| City hotels (N=18 properties) | ||||||
| 2025 actual (finalized) | ¥8,150 | ¥6,983 | ¥6,993 | ¥7,261 | ¥6,964 | ¥7,270 |
| Pessimistic (lower quartile +1.0%) | ¥8,232 | ¥7,053 | ¥7,063 | ¥7,334 | ¥7,034 | ¥7,343 |
| Mid (median +2.3%) | ¥8,333 | ¥7,140 | ¥7,150 | ¥7,424 | ¥7,121 | ¥7,434 |
| Optimistic (upper quartile +3.7%) | ¥8,451 | ¥7,241 | ¥7,251 | ¥7,529 | ¥7,221 | ¥7,538 |
Quartiles are computed from the seven finalized-month year-on-year readings for January–July 2026 (business: min −3.2% / max +11.6%; city: min −1.1% / max +5.9%). This is not a forecast but an arithmetic mapping of what would follow if the swings already observed simply continued. Source: MetroEngines Research; compiled by the HotelBank Editorial Team
Business hotels land in a range of ¥6,665–¥6,814 on the August–December average — +3.2% to +5.5% against ¥6,459 for the same period in 2025. That this sits above the ¥6,258 first-half average is because the second half of 2025 was itself higher than the first half (¥6,459 versus ¥6,003), not because the growth rate accelerates. City hotels come to ¥7,343–¥7,538, a range width of ¥195 — wider than business hotels’ ¥149. That is the flip side of a segment with a base of only N=18 properties, where a single property’s rate revision moves the prefecture average easily.
To bring that width down to your own granularity, it is quicker to look at two axes: growth rate and base month. The table below shows the levels implied by applying growth rates from −3% to +9% to the finalized August–December 2025 figures for business hotels. Checking which row of the vertical axis your second-half budget corresponds to makes clear which market assumption you are betting on.
| YoY change | Aug 2025 ¥7,086 | Sep 2025 ¥6,073 | Oct 2025 ¥6,538 | Nov 2025 ¥6,657 | Dec 2025 ¥5,943 |
|---|---|---|---|---|---|
| -3% | ¥6,873 | ¥5,891 | ¥6,342 | ¥6,457 | ¥5,765 |
| +0% | ¥7,086 | ¥6,073 | ¥6,538 | ¥6,657 | ¥5,943 |
| +3% | ¥7,299 | ¥6,255 | ¥6,734 | ¥6,857 | ¥6,121 |
| +6% | ¥7,511 | ¥6,437 | ¥6,930 | ¥7,056 | ¥6,300 |
| +9% | ¥7,724 | ¥6,620 | ¥7,126 | ¥7,256 | ¥6,478 |
Shading marks the row closest to the January–July 2026 median (+4.7%). Amounts in the column headers are finalized 2025 figures. Source: MetroEngines Research; compiled by the HotelBank Editorial Team
One worked example. If you assume the market lands at +3% year-on-year in September 2026, the implied level for business hotels is ¥6,255 — almost exactly the ¥6,258 first-half average of 2026. Take instead the −3% row, close to the −3.2% that actually occurred in June, and the level drops to ¥5,891. That ¥364 span is the sensitivity of a second-half budget in itself. December has the year’s lowest base, ¥5,943 in 2025, so even applying +9% gives ¥6,478 — short of May’s ¥6,672 in the first half. Which month you are basing on matters more than the size of the growth rate — that is what this grid implies.
Summary — three yardsticks for measuring the Iwate market
Yardstick 1: Divide the growth rate by quarter. Iwate’s business hotels averaged +4.3% over January–July, but +6.2% in January–March against +2.9% in April–July. City hotels averaged +2.3%, moving the other way: +1.4% in January–March against +3.0% in April–July. Same prefecture, same period — different segments grow at different times.
Yardstick 2: State which year you are comparing against. The January–July 2026 average is −2.3% for business hotels and −3.1% for city hotels against the same period in 2024. Positive year-on-year and negative against two years earlier can hold at the same time. Target-setting is best done holding both.
Yardstick 3: Track the gap between the segments monthly. The city-to-business gap widened from ¥847 (1.13x) in January 2026 to ¥1,364 (1.22x) in July. How that gap moves is a simple indicator of which side of the market your own price band is being pulled toward.
About the data
• Definition of estimated OCC (OTA-listed-inventory basis): “Occupancy on an OTA-listed-inventory basis = 100 − 100 × rooms still listed on OTAs ÷ total rooms. It is an estimate based on how listed inventory is being taken up on OTAs and differs by definition from actual room occupancy (it reads higher).” Scope is actuals for June and July 2026 in Iwate, plus the pace cross-section for each stay date from September 5 to October 3, 2026.
• Booking curve: based on observations from 45 days before the stay date up to the latest reading.
• Definition of the settled ADR estimate: an estimated transacted price level (tax-exclusive equivalent) derived from OTA and other sales data (lowest-plan level × segment coefficient, ensembled across multiple channels). Past months are finalized; the current and future months are estimates based on the present sales position. The median error against published operating results is 6.6%. Every year-on-year comparison in this article is built solely from finalized-month pairs; no estimate for August 2026 or later is used for either level comparisons or year-on-year figures.
• Breakdown of N: for the settled ADR estimate, Iwate business hotels N=83–87 properties and Iwate city hotels N=18 properties (both vary by month). For comparison: Aomori N=81–90 properties, Akita N=52–61 properties, Miyagi N=139–143 properties (all business hotels). For estimated OCC, Iwate business hotels N=65–75 properties and city hotels N=15–17 properties. For the latest booking-curve observation, business hotels N=74–75 properties and city hotels N=17 properties.
• Data as of August 26, 2026. Sales positions and inventory change daily, so the figures in this article are a snapshot as of the time of retrieval.
■ Data sources
Both the settled ADR estimate and the estimated OCC are compiled from the history of publicly listed sales prices and inventory on OTAs, aggregated at the prefecture × segment level (MetroEngines Research). The scope of this article is business hotels (N=83–87 properties) and city hotels (N=18 properties) in Iwate, with business hotels in Aomori (N=81–90 properties), Akita (N=52–61 properties) and Miyagi (N=139–143 properties) as comparison references. The day-of-week aggregation covers the 61 days of June–July 2026; the stay-date pace covers six stay dates from September 5 to October 3, 2026. All values were retrieved as of August 26, 2026.
■ Calculation assumptions
The “implied H2 2026 levels” (Tables 6 and 7) are an arithmetic mapping: the quartiles of the seven finalized-month year-on-year readings measured over January–July 2026 (business: lower +3.2% / median +4.7% / upper +5.5%; city: lower +1.0% / median +2.3% / upper +3.7%) applied to the finalized levels of August–December 2025. The two-axis grid in Table 7 applies five growth-rate steps from −3% to +9% to those same finalized 2025 figures. Neither is a forecast; both are mappings of what would follow if the swings already observed simply continued, and no estimate for August 2026 or later is used as either a multiplier or a base.
■ Limitations and caveats
The settled ADR estimate is derived from publicly available OTA data and differs from actual transacted rates (accuracy disclosed above). Estimated OCC is an OTA-listed-inventory metric and reads higher than actual room occupancy. Every year-on-year comparison in this article is built solely from finalized-to-finalized pairs; no estimate for August 2026 or later is used for either level comparisons or year-on-year figures. City hotels cover only N=18 properties, so rate revisions at a small number of properties can move the prefecture average — worth bearing in mind. Tables 6 and 7 also describe the market as a whole and do not indicate where an individual property with a different location, room count or channel mix will land.
Related reading
- Iwate Obon 2026: Aug 13 Peaks 92.5%, Aug 15 Dips to 78.9% Both Types
- Iwate Hotel Market 2026: 2.2x ADR Gap, Morioka ¥200 Lodging Tax
- Aomori Settled ADR July 2026: Ryokan +19.1%, Business Hotels +0.6%
- Yamagata ADR Splits by Segment: Business −4.8% in April, City +12.5%
- Niigata Settled ADR H1 2026: Business +10.8% in June, City −7.6%
- Okayama City Hotel ADR −23.3% in July, Business +2.8% in H1 2026
- Hyogo Hotel ADR H1 2026: City −12.4% in June, Business −0.4%
- Hokkaido Business Hotels Aren’t Weekend-Led: Thu 95.4% Ties Sat 95.4%