

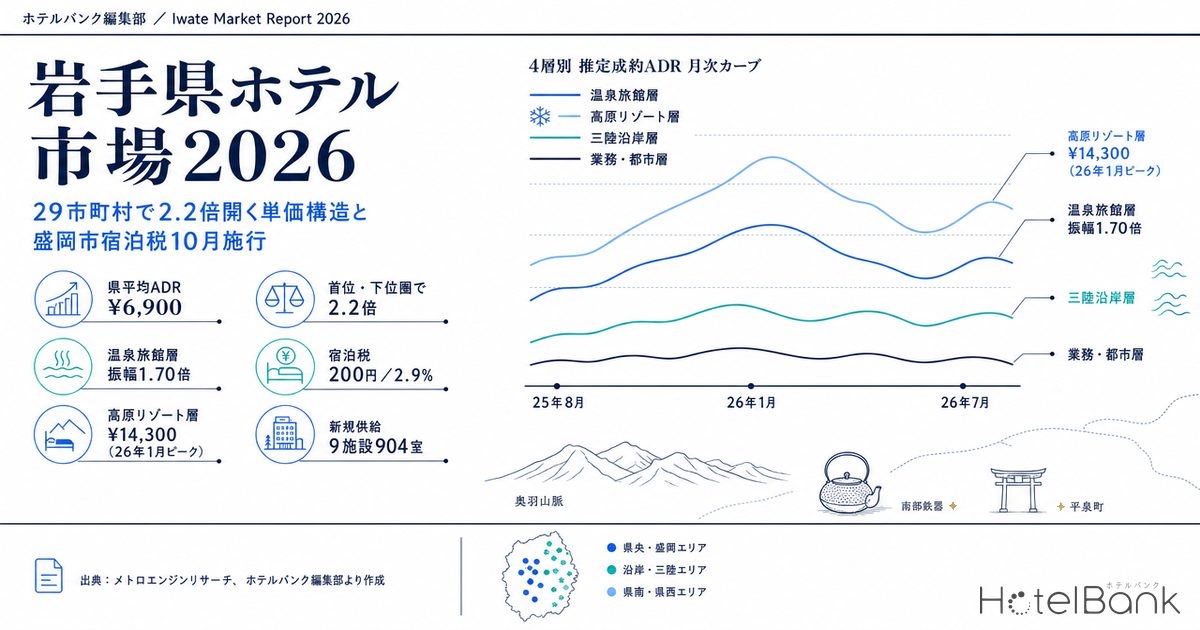
Iwate’s lodging market is hard to describe with a single average. The highland resorts of Hachimantai and Appi, the hot spring clusters of Hanamaki, Oshuku and Shizukuishi, the corporate demand of Morioka and Kitakami, the cultural tourism of Hiraizumi, and the reconstruction and marine tourism of the Sanriku coast. Demand layers with entirely different characters coexist within a single prefecture, and the prefecture-wide average settled ADR simply traces the midpoint between them, hiding both the seasonal amplitude and the price band that each layer carries.
When we extract the estimated settled ADR for Iwate’s 29 municipalities from MetroEngines Research data, the gap between the top and the bottom of the range is roughly 2.2x. On top of that, on October 1, 2026, Morioka will introduce the prefecture’s first lodging tax. This article breaks down that ADR structure municipality by municipality, then reads the seasonal curves of each layer, the share the lodging tax represents against actual price levels, and the new supply arriving in 2026 as one continuous story.
Metric Definitions Used in This Article
- ADR (Average Daily Rate): The estimated settled rate (tax-exclusive equivalent) calculated by applying category-specific adjustment coefficients to the lowest published plan rate each property offers on OTAs and similar channels (double occupancy, per-room rate, tax included). Cross-checked against property-level results disclosed by listed hotel REITs (91 properties, most recent 3 months), the median error is approximately 7%. These are estimates and differ from each property’s actual transaction prices or accounting figures. Area-level ADR is the median of the target properties (the standard level for a typical property in that area).
- Listed price: The average of all plans published on OTAs and similar channels (from room-only through half-board). Double occupancy, per-room rate, tax included. Because the basis differs from estimated settled ADR, the two are not compared as the same metric.
- OCC (Occupancy rate): The share of sold rooms against total rooms in the area (an estimate based on OTA sales inventory). This is an estimate based on how OTA-distributed inventory is being consumed and differs from a property’s actual overall occupancy.
- Data source: MetroEngines Research. The analysis period is July 2024 to July 2026 (finalized basis).
- — Estimated settled ADR across the 29 municipalities runs from ¥9,998 in Hachimantai down to ¥4,519 in Hiraizumi, a gap of roughly 2.2x. Including reference-only municipalities, the spread across all 29 widens to about 2.6x, and the prefecture average of ¥6,936 makes those layer differences invisible.
- — Seasonal amplitude reaches 1.70x for the hot spring ryokan layer and 1.58x for the highland resort layer, against 1.19x for the corporate and urban layer. The peak months also fall one month apart, in December and January.
- — Weekend effects are asymmetric by category. Ryokan move from 77.2% on weekdays to 84.5% on Friday and Saturday (+7.3pt), while business hotels only go from 89.1% to 90.5% (+1.4pt) (July 2026, estimated from OTA listed inventory).
- — Morioka’s lodging tax takes effect on October 1, 2026, at a flat ¥200 per person per night. Against an estimated settled ADR of ¥6,927, that is 2.9% for single occupancy and 5.8% for double occupancy.
- — New supply in 2026 totals 9 properties and 904 rooms (versus 13 properties and 579 rooms in 2025, and 7 properties and 336 rooms in 2024). Kitakami adds 392 rooms, roughly a 13% increase on its existing 2,992 rooms.
The Four Layers the Prefecture Average Hides
Start with the prefecture-wide trend. Estimated settled ADR in July 2026 was ¥6,900 (N=255 properties), and the year-on-year change from January to July 2026 averaged +2.9%, with January up the most at +12.8%. The full-year range is ¥6,700 to ¥8,300, and the ratio between the highest and lowest month is 1.22x. On the numbers alone, Iwate looks like “a market with small seasonal variation.”
Source: MetroEngines Research; compiled by the HotelBank Editorial Team (N=245–258 properties per month)
Regroup the municipalities by character, however, and that 1.22x turns out to be an artifact of averaging. When we sorted the prefecture’s 15 main municipalities into four layers and re-aggregated estimated settled ADR weighted by property count, the seasonal amplitude within a layer widened to as much as 1.70x.
| Layer | Municipalities | Peak month | Trough month | Amplitude | Properties |
|---|---|---|---|---|---|
| Hot spring ryokan layer | Hanamaki, Nishiwaga | Dec 2025 ¥15,800 | Jun 2026 ¥9,200 | 1.70x | 40–42 |
| Highland resort layer | Hachimantai, Shizukuishi | Jan 2026 ¥14,300 | Jun 2026 ¥9,000 | 1.58x | 23–27 |
| Sanriku coastal layer | Miyako, Ofunato, Kamaishi, Rikuzentakata, Kuji | Aug 2025 ¥8,200 | Jun 2026 ¥6,500 | 1.27x | 40–42 |
| Corporate and urban layer | Morioka, Kitakami, Oshu, Ichinoseki, Ninohe | Aug 2025 ¥7,500 | Feb 2026 ¥6,300 | 1.19x | 106–112 |
| (Reference) Prefecture average | Entire prefecture | Aug 2025 ¥8,300 | Jun 2026 ¥6,700 | 1.22x | 245–257 |
Source: MetroEngines Research; compiled by the HotelBank Editorial Team (August 2025–July 2026, finalized basis, weighted by property count)
The character of each layer is clearly distinct. The hot spring ryokan layer climbs to ¥15,800 in December and falls back to ¥9,200 in June. Rates build from the autumn foliage season through the New Year period and slacken in the rainy season, a textbook ryokan curve. The highland resort layer peaks in January at ¥14,300. Ski demand at Appi Kogen and Hachimantai lifts rates in a winter-driven pattern, with the peak arriving a month later than the hot spring layer.
The Sanriku coastal layer is a summer type peaking in August. The concentration of marine tourism and reconstruction tourism into the school holidays shows up in rates as well. And the corporate and urban layer, at 1.19x, is the flattest of the four. Because business demand in Morioka, Kitakami, Oshu, Ichinoseki and Ninohe moves by day of week rather than by season, monthly averages barely fluctuate. The prefecture average of 1.22x is the result of being pulled strongly toward this corporate and urban layer, which is the thickest by property count (106–112 properties).
Source: MetroEngines Research; compiled by the HotelBank Editorial Team
Estimated Settled ADR Across 29 Municipalities — A 2.2x Gap Between Top and Bottom
Next, line up the levels municipality by municipality. As of June 2026, estimated settled ADR could be calculated for 29 municipalities. Of these, the 15 municipalities with five or more properties in the sample form the main table, and the 14 with fewer than five are listed separately as reference values. Areas with few properties can move sharply on a single property’s rate revision, so they are not used in the ranking discussion.
| Municipality | Layer | Estimated settled ADR | Listed price (all-plan average) | Gap | Properties |
|---|---|---|---|---|---|
| Hachimantai | Highland resort | ¥9,998 | ¥25,160 | 2.52x | 13 |
| Hanamaki | Hot spring ryokan | ¥9,573 | ¥33,738 | 3.52x | 31 |
| Nishiwaga | Hot spring ryokan | ¥8,223 | ¥28,055 | 3.41x | 10 |
| Shizukuishi | Highland resort | ¥8,000 | ¥22,526 | 2.82x | 12 |
| Miyako | Sanriku coastal | ¥7,812 | ¥29,715 | 3.80x | 11 |
| Morioka | Corporate and urban | ¥6,927 | ¥14,500 | 2.09x | 43 |
| Ninohe | Corporate and urban | ¥6,865 | ¥18,273 | 2.66x | 8 |
| Ofunato | Sanriku coastal | ¥6,248 | ¥15,358 | 2.46x | 11 |
| Kitakami | Corporate and urban | ¥6,126 | ¥13,660 | 2.23x | 22 |
| Rikuzentakata | Sanriku coastal | ¥6,095 | ¥20,756 | 3.41x | 5 |
| Ichinoseki | Corporate and urban | ¥6,047 | ¥16,718 | 2.76x | 23 |
| Kamaishi | Sanriku coastal | ¥5,868 | ¥14,033 | 2.39x | 10 |
| Kuji | Sanriku coastal | ¥5,747 | ¥14,100 | 2.45x | 5 |
| Oshu | Corporate and urban | ¥4,915 | ¥14,117 | 2.87x | 15 |
| Hiraizumi | Cultural tourism | ¥4,519 | ¥27,883 | 6.17x | 5 |
Source: MetroEngines Research; compiled by the HotelBank Editorial Team (June 2026, finalized basis, five or more properties in the sample)
Source: MetroEngines Research; compiled by the HotelBank Editorial Team
Hachimantai leads at ¥10,000 (13 properties in the sample). The highland resort area that encompasses the Hachimantai hot spring villages and Appi Kogen sits at the top. Hanamaki follows at ¥9,600 (31 properties), where the depth of hot spring clusters such as Hanamaki Onsen, Dai Onsen and Osawa Onsen underpins the rate level. With 31 properties in the sample, that level can be read as the standard level for the area rather than the influence of any single property.
At the bottom are Hiraizumi at ¥4,500 (5 properties) and Oshu at ¥4,900 (15 properties). Among the 15 municipalities in the main table, the gap between Hachimantai at the top and Hiraizumi at the bottom is roughly 2.2x. Including reference values across all 29 municipalities, the spread between top and bottom widens to about 2.6x. Markets with a range this wide inside a single prefecture are not common nationwide.
Reference values: the 14 municipalities with fewer than five properties in the sample
| Municipality | Estimated settled ADR | Listed price | Properties |
|---|---|---|---|
| Otsuchi | ¥8,987 | ¥16,773 | 2 |
| Iwaizumi | ¥7,980 | ¥30,434 | 2 |
| Tanohata | ¥7,749 | ¥32,758 | 1 |
| Tono | ¥7,239 | ¥19,274 | 3 |
| Karumai | ¥6,681 | ¥17,445 | 2 |
| Yahaba | ¥6,656 | ¥12,866 | 2 |
| Noda | ¥6,501 | ¥24,743 | 1 |
| Fudai | ¥6,258 | ¥20,028 | 1 |
| Ichinohe | ¥5,815 | ¥19,602 | 1 |
| Shiwa | ¥5,363 | ¥16,468 | 3 |
| Kanegasaki | ¥4,809 | ¥18,816 | 4 |
| Yamada | ¥4,600 | ¥19,071 | 4 |
| Sumita | ¥4,167 | ¥15,803 | 2 |
| Hirono | ¥3,844 | ¥18,190 | 3 |
* Listed as reference values because fewer than five properties are in the sample. They are not used in the ranking conclusions. Source: MetroEngines Research
Mapping the Rate Distribution — High Along the Inland Western Edge, Thin on the Northern Coast
Plot estimated settled ADR on a map and the prefecture’s rate bands appear as distinct belts. Circle size indicates the number of properties in the sample, and color indicates the layer classification.
Source: MetroEngines Research; compiled by the HotelBank Editorial Team
The high-rate band lines up along the western edge on the Ou Mountains side. The chain of hot springs and highlands formed by Hachimantai, Shizukuishi, Hanamaki and Nishiwaga runs as a single belt from the north to the south of the prefecture. By contrast, the Tohoku Shinkansen corridor where business demand concentrates (Morioka, Kitakami, Oshu, Ichinoseki) sits within a ¥4,900 to ¥6,900 range, so room stock depth and rate level line up in opposite directions.
The Sanriku coast splits between north and south. Miyako is the highest on the coast at ¥7,800, followed by Ofunato at ¥6,200, Kamaishi at ¥5,900 and Kuji at ¥5,700. While tourism assets such as the Sanriku Railway corridor, the geopark and the disaster memorial facilities are translating into lodging demand, room stock is limited, at 1,153 rooms in Miyako and 387 rooms in Kuji (within the scope tracked by MetroEngines Research; the same applies below). The structure is one of thin capacity relative to demand-side growth, and it is a layer with room to add supply.
Day-of-Week Effects by Category — Ryokan Gain +7.3pt on Weekends
On top of the seasonal differences between layers, day-of-week effects also differ by property category. For Iwate in July 2026, we aggregated occupancy (estimated on an OTA listed-inventory basis) and listed prices separately for weekdays and for Friday–Saturday.
Source: MetroEngines Research; compiled by the HotelBank Editorial Team (July 2026, overall N=266 properties and 16,166 rooms)
| Category | Properties | Rooms | Weekday OCC | Fri–Sat OCC | Fri–Sat listed-price premium |
|---|---|---|---|---|---|
| Ryokan | 113 | 3,868 | 77.2% | 84.5% | +15.7% |
| Resort hotels | 9 | 1,136 | 87.4% | 88.7% | +24.7% |
| City hotels | 17 | 1,871 | 88.0% | 92.0% | +20.0% |
| Business hotels | 73 | 8,701 | 89.1% | 90.5% | +10.0% |
Source: MetroEngines Research; compiled by the HotelBank Editorial Team (July 2026; occupancy is an estimate on an OTA listed-inventory basis)
Ryokan move 7.3pt, from 77.2% on weekdays to 84.5% on Friday and Saturday, while business hotels move only 1.4pt, from 89.1% to 90.5%. Business hotels already run high on weekdays and do not fall off at the weekend. The prefecture’s largest block of stock, at 8,701 rooms, is turning at a high level regardless of the day of the week.
The price-side response is the mirror image by category. The Friday–Saturday listed-price premium is large for resort hotels at +24.7% and city hotels at +20.0%, while business hotels stop at +10.0%. Occupancy holding almost flat from weekday to weekend indicates room to build more granular day-of-week pricing. Especially in areas where Friday–Saturday occupancy has reached the 90% range, restructuring rates in stages is a way to capture upside on the rate side.
Morioka’s Lodging Tax Starts October 1, 2026 — 2.9% of the Prevailing Rate
From October 1, 2026, Morioka will introduce the first lodging tax in Iwate. According to the Morioka City official website, the tax is a flat ¥200 per guest per night. The ordinance was passed at the December 2025 regular session of the city assembly on December 22, 2025. Collection is by special collection: hotel and inn operators (excluding boarding house businesses) and private lodging (minpaku) operators file and remit the previous month’s amount by the end of each month. The revenue is allocated to measures related to enhancing the appeal of tourism resources, promoting visits, and tourism development.
Let us estimate what share that ¥200 represents against prevailing rates. Morioka’s estimated settled ADR was ¥6,900 as of June 2026, and over the most recent 12 months it has moved in a ¥6,400 to ¥9,300 range. Because the lodging tax is levied per person per night, the burden per room is proportional to the number of guests.
| Occupancy pattern | Tax per room per night | Share of estimated settled ADR | Share of listed price |
|---|---|---|---|
| 1 guest per room | ¥200 | 2.9% | 1.4% |
| 2 guests per room | ¥400 | 5.8% | 2.8% |
| 4 guests per room | ¥800 | 11.5% | 5.5% |
Source: Morioka City official website (lodging tax), MetroEngines Research; compiled by the HotelBank Editorial Team. Calculated against Morioka’s June 2026 estimated settled ADR of ¥6,927 and the same month’s all-plan average listed price of ¥14,500
A flat-rate tax weighs relatively more heavily on lower-rate categories. In the business hotel band that is Morioka’s core market, single occupancy dominates, so in practice the share is around 2.9%, rising to the equivalent of 5.8% at double occupancy. On weekends with more family and group stays, or in patterns such as four guests per room, it reaches double digits. Because the per-room burden accumulates as guest counts rise, plans built on per-person pricing are worth preparing in advance so that the tax-inclusive total is presented clearly.
The tax amount itself is set at a low level compared with Japan’s major cities. Municipalities that adopt percentage-based taxation see the tax amount rise as rates rise, but Morioka’s flat ¥200 does not change as rates increase. In other words, the design is such that as rates are pushed up, the relative share of the lodging tax actually declines. For how much a percentage-based tax adds to prevailing rates, our per-guest-night estimates by municipality for Okinawa’s 2% lodging tax offer a useful comparison. Given that the prefecture-average estimated settled ADR rose an average of +2.9% year on year from January to July 2026, the relationship between rate growth and tax burden is relatively manageable.
Looking at listed levels from the month the tax takes effect, Morioka’s listed price (all-plan average) runs ¥16,800 in September 2026, ¥16,700 in October, ¥15,300 in November and ¥14,900 in December. September’s level is broadly maintained in October, so as of the survey date no major repricing in anticipation of the tax appears on the listing side. Because the lodging tax is collected at the front desk separately from the room rate, it can be operated independently of listed-price design, which likely contributes as well.
Hiraizumi’s Upside — 1.63 Million Visitors Against 121 Rooms of Stock
Hiraizumi stands out in the municipality table. Its estimated settled ADR is ¥4,500, but its listed price (all-plan average) is ¥27,900, a gap of 6.17x, the widest among the 29 municipalities. A gap this large indicates that a small number of high-rate plans with meals are lifting the listed average, while the price band that actually sells sits considerably lower. For where the gap between listed prices and prices that actually sell is largest, our Japan 46-Prefecture Upside Map 2026 compares the whole country side by side.
Behind this is the scale of lodging stock. In Hiraizumi, 6 properties with roughly 121 rooms can be confirmed on OTAs. Against that, reporting by the Iwanichi Nippo newspaper puts Hiraizumi’s 2024 tourist arrivals at 1,630,280 (up 6.2% year on year). For a destination that holds the World Heritage site “Hiraizumi — Temples, Gardens and Archaeological Sites Representing the Buddhist Pure Land,” the total number of rooms available within the town is limited. Neighboring Ichinoseki holds 1,779 rooms and Oshu 1,140 rooms, so the structure is one in which the capacity to absorb lodging demand spreads to the surrounding municipalities.
This is also substantial room for capture. If even a portion of those 1.63 million visitors could be converted into overnight stays within the town, the impact on a stock of 6 properties and 121 rooms would be large. The fact that the gap between listed prices and estimated settled rates is sixfold means there is a gap in plan design between high-rate plans with meals and the price band that is actually moving. Plans that fill the middle band — from room-only to bed and breakfast, or stays built around early-morning worship at Chusonji and Motsuji or evening scenery — could become new revenue opportunities.
It is also worth reading alongside Ichinoseki, with an estimated settled ADR of ¥6,000 and depth of 23 properties in the sample. Cultural tourism demand in southern Iwate is carried by the two bases of Hiraizumi and Ichinoseki. Redesigning price bands with the two treated as a single area creates room to shift day-trip-centered visits toward overnight stays.
2026 New Supply: 9 Properties and 904 Rooms — Each Layer Gains Depth
After the rate structure, look at the supply side. Within the scope tracked by MetroEngines Research, 9 lodging properties with 904 rooms are confirmed to have opened in Iwate in 2026. On a room-count basis, that is a substantial increase from 13 properties and 579 rooms in 2025 and 7 properties and 336 rooms in 2024. Properties confirmed on OTAs within the prefecture total roughly 883 properties and 25,845 rooms, so the 904 new rooms in 2026 correspond to about 3.5% of that. For how far Aomori, Akita and Yamagata — the other northern Tohoku markets — can absorb their new supply, see our diagnosis of supply absorption capacity across the three northern Tohoku prefectures.
This chart is aggregated on an OTA listing-confirmation basis. Only about 19% of properties are listed on OTAs before opening, and more than half are listed after opening, so counts for the most recent months and years may increase as further listings appear. We recommend reading it alongside the building-plan pipeline on a construction-permit basis (Ministry of Land, Infrastructure, Transport and Tourism, “Survey on Construction Dynamics”).
Source: MetroEngines Research & Consulting (OTA listing-confirmation basis, 2023–2026, N=37 properties); compiled by the HotelBank Editorial Team
| Property | Location | Rooms | Category | Opening |
|---|---|---|---|---|
| LiVEMAX RESORT Hachimantai Forest (リブマックスリゾート八幡平フォレスト) | Hachimantai | 229 | Resort hotel | July 1, 2026 |
| Toyoko Inn Kitakami-eki Nishiguchi (東横INN北上駅西口) | Kitakami | 225 | Business hotel | March 2, 2026 |
| Sotetsu Fresa Inn Kitakami-Ekimae (相鉄フレッサイン 北上駅前) | Kitakami | 167 | Business hotel | October 1, 2026 |
| Grids Premium Hotel Morioka (グリッズプレミアムホテル盛岡) | Morioka | 153 | Business hotel | May 2026 |
| Gensen Ichizu Iwate Shizukuishi (源泉一途 岩手雫石) | Shizukuishi | 57 | Ryokan | July 2026 |
| Oshuku Onsen Yutorelo Shizukuishi (鶯宿温泉ゆとりろ雫石) | Shizukuishi | 35 | Resort hotel | October 2026 |
| AZUMA FARM Koiwai | — | 24 | Cottage | April 2026 |
| Others (2 small properties) | — | 14 | Auberge / lodge | February–March 2026 |
Source: MetroEngines Research & Consulting (OTA listing-confirmation basis, N=9 properties), confirmed against each company’s official releases. Compiled by the HotelBank Editorial Team
The way supply is entering matches the layers. The highland resort layer gained LiVEMAX RESORT Hachimantai Forest with 229 rooms. It is the operator’s first property in Iwate and features open-air baths and a sauna facing the forest. The top rate layer has taken on its largest single block of rooms to date in one step.
In the corporate and urban layer, openings concentrated in Kitakami. Toyoko Inn Kitakami-eki Nishiguchi opened with 225 rooms on March 2, 2026, and Sotetsu Fresa Inn Kitakami-Ekimae, a one-minute walk from Kitakami Station, adds 167 rooms on October 1. The combined 392 rooms amount to roughly a 13% increase on Kitakami’s existing 2,992 rooms. Kitakami is a manufacturing cluster anchored by companies such as Toyota Motor East Japan and Kioxia Iwate, and the depth of business demand can be read as having drawn in supply. Sotetsu Fresa Inn Kitakami-Ekimae is a 14-story building of roughly 4,500 m² of total floor area with a large public bath, a design that raises the value of a stay for business travelers.
Shizukuishi, positioned between the hot spring ryokan layer and the highland resort layer, gains two properties: Gensen Ichizu Iwate Shizukuishi (57 rooms) and Oshuku Onsen Yutorelo Shizukuishi (35 rooms). Oshuku Onsen is the town’s flagship hot spring destination, and ryokan-style rooms are being added on top of an existing stock of 1,686 rooms. With a location able to capture both winter ski demand and year-round hot spring demand, it may also work to smooth out the highland resort layer’s 1.58x seasonal amplitude.
Further out in the pipeline, on the basis of the Ministry of Land, Infrastructure, Transport and Tourism’s Survey on Construction Dynamics, a 134-room, three-story hotel plan in Rikuzentakata can be confirmed with completion scheduled for February 2027. That is an addition to a layer with thin room stock along the Sanriku coast, and it represents a large ratio against Rikuzentakata’s existing 558 rooms. However, because construction permits are filed one to two years before opening, counts for 2027 onward are expected to rise as further applications are added, so the figure should be treated as the current lower bound for the confirmed pipeline.
Converting Layers into Room Counts — Ryokan Move the Most Rooms on Weekends
The occupancy figures so far have been comparisons in percentage terms. Because this article’s metric definitions set occupancy as “the share of sold rooms against total rooms in the area,” rearranging that definition gives estimated rooms sold = rooms × estimated occupancy. What follows is not a forecast but a unit conversion that restates the room counts and occupancy rates already presented in this article in units of rooms. No new observations or assumptions have been added.
| Category | Rooms | Weekday level | Week-average equivalent | Fri–Sat level | Weekday → Fri–Sat difference |
|---|---|---|---|---|---|
| Ryokan | 3,868 rooms | 77.2% / 2,986 rooms | 79.3% / 3,067 rooms | 84.5% / 3,268 rooms | +282 rooms |
| Resort hotels | 1,136 rooms | 87.4% / 993 rooms | 87.8% / 997 rooms | 88.7% / 1,008 rooms | +15 rooms |
| City hotels | 1,871 rooms | 88.0% / 1,646 rooms | 89.1% / 1,667 rooms | 92.0% / 1,721 rooms | +75 rooms |
| Business hotels | 8,701 rooms | 89.1% / 7,753 rooms | 89.5% / 7,787 rooms | 90.5% / 7,874 rooms | +121 rooms |
| Four categories combined | 15,576 rooms | — / 13,378 rooms | — / 13,518 rooms | — / 13,871 rooms | +493 rooms |
Source: MetroEngines Research; compiled by the HotelBank Editorial Team (July 2026; occupancy is an estimate on an OTA listed-inventory basis)
In percentage terms the difference is more than fivefold — +7.3pt for ryokan against +1.4pt for business hotels — but converted into rooms it narrows to about 2.3x, at +282 rooms for ryokan versus +121 rooms for business hotels. Even so, ryokan, whose room stock is less than half that of business hotels, still move more rooms in absolute terms at the weekend. Across the prefecture’s four categories combined, the calculation works out to +493 rooms, from 13,378 rooms on weekdays to 13,871 rooms on Friday and Saturday.
A Two-Axis Grid of Rooms × Occupancy
The vertical axis takes the room counts by category from this article, and the horizontal axis takes the five occupancy levels observed in this article (from ryokan’s weekday 77.2% to city hotels’ Friday–Saturday 92.0%), with estimated rooms sold shown at each intersection. Both axes stay within the range of measured values presented in the article, with no extrapolation.
| Rooms \ Occupancy | 77.2% | 84.5% | 88.0% | 89.1% | 92.0% |
|---|---|---|---|---|---|
| 1,136 rooms (resort hotels) | 877 | 960 | 1,000 | 1,012 | 1,045 |
| 1,871 rooms (city hotels) | 1,444 | 1,581 | 1,646 | 1,667 | 1,721 |
| 3,868 rooms (ryokan) | 2,986 | 3,268 | 3,404 | 3,446 | 3,559 |
| 8,701 rooms (business hotels) | 6,717 | 7,352 | 7,657 | 7,753 | 8,005 |
| 16,166 rooms (prefecture total) | 12,480 | 13,660 | 14,226 | 14,404 | 14,873 |
Source: MetroEngines Research; compiled by the HotelBank Editorial Team (July 2026, unit conversion)
What the grid shows is that the weight of one occupancy point differs completely by layer. For business hotels’ 8,701 rooms, 1pt equals 87 rooms; for ryokan’s 3,868 rooms, 39 rooms; and for resort hotels’ 1,136 rooms, 11 rooms. Any discussion of how many points to move occupancy only becomes meaningful alongside the depth of room stock. Conversely, in layers with thin stock such as the Sanriku coastal layer or Hiraizumi, rate-side design works harder than occupancy on revenue per room.
Conclusion — Price by Layer, Not by Prefecture Average
Iwate’s lodging market cannot be captured by the single figure of a ¥6,900 prefecture-average estimated settled ADR. The range across 29 municipalities is roughly 2.6x, and even across the 15 main municipalities it is about 2.2x. Seasonal amplitude is 1.70x for the hot spring ryokan layer and 1.58x for the highland resort layer, against 1.19x for the corporate and urban layer. That difference shows that pricing philosophies inside the same prefecture are entirely separate.
The hot spring ryokan layer and the highland resort layer peak one month apart, in December and January. That time lag can be used as a structure in which the prefecture absorbs demand in sequence rather than competing for it internally. The Sanriku coastal layer is a summer type peaking in August, and with thin stock it is positioned to reflect demand growth in rates. The corporate and urban layer has the conditions in place — occupancy nearly flat from weekday to weekend — to capture upside on the rate side by building more granular pricing by day of week and by lead time.
And on October 1, 2026, Morioka’s ¥200 lodging tax comes into effect. Against prevailing rates that is 2.9% at single occupancy and the equivalent of 5.8% at double occupancy. A flat-rate design means the relative share declines as rates are pushed up. If the revenue is invested in tourism promotion and visits increase, it may come back on both the rate and occupancy sides. As 2026’s 904 new rooms add depth layer by layer, whether operators can build pricing around the curve of the layer they belong to — rather than the prefecture average — will be the dividing line over the coming year.
⚠ Note on future-dated pricing: Listed price levels from August 2026 onward in this article are estimates based on sales prices published on OTAs and similar channels as of the survey date, and they will change as new plans are added and rates adjusted closer to the check-in date. The estimated settled ADR analysis is limited to the finalized basis through July 2026.
Related Reading
- Okinawa’s 2% Lodging Tax: ¥60–¥340 per Guest Night by Municipality
- Listed vs Settled ADR Gap: Japan’s 46-Prefecture Upside Map 2026
- Japan’s Earliest Foliage 2026: Aomori ADR Peaks at ¥15,300 in October
- 1,291 Hotels, 31,024 Rooms Above ¥100,000: Japan’s Luxury Map
- Aomori Nebuta 2026: 97.4% Sold 45 Days Out, Post-Festival +14pt
- North Tohoku’s 2,079 New Rooms: Which Segments Can Absorb the Supply
References and Sources
■ Data sources
Estimated settled ADR and listed prices are monthly area aggregates for 29 municipalities in Iwate and for the prefecture as a whole (July 2024–July 2026 = finalized basis, N=245–258 properties per month). Occupancy is estimated on an OTA listed-inventory basis for July 2026 (overall N=266 properties and 16,166 rooms; by category, ryokan 113 properties and 3,868 rooms / resort hotels 9 properties and 1,136 rooms / city hotels 17 properties and 1,871 rooms / business hotels 73 properties and 8,701 rooms). New openings are on an OTA listing-confirmation basis (2023–2026, N=37 properties), and the supply pipeline is on a building-plan basis. Details of the lodging tax system are from the Morioka City official website.
■ Calculation assumptions
Seasonal amplitude by layer was calculated by classifying the 15 main municipalities into four layers and taking a property-count-weighted average of each month’s estimated settled ADR (amplitude = ratio of peak month to trough month). Lodging tax shares were calculated using Morioka’s June 2026 estimated settled ADR of ¥6,927 and the same month’s all-plan average listed price of ¥14,500 as denominators, with ¥200 per person per night × number of guests as the numerator. Estimated rooms sold is a unit conversion of “rooms × occupancy,” derived by rearranging this article’s metric definition (occupancy = share of sold rooms against total rooms), and is not a demand forecast. The week-average equivalent was derived purely arithmetically as a weighted average of 5 weekdays and 2 Friday–Saturday days. Both axes of the two-axis grid are kept within the range of measured values presented in the article, with no extrapolation.
■ Limitations and caveats
Estimated settled ADR is an estimate produced by applying category-specific adjustment coefficients to listed prices and differs from each property’s actual transaction prices or accounting figures. Occupancy is an estimate based on how OTA-distributed inventory is being consumed and tends to run higher than a property’s actual overall occupancy. Municipalities with fewer than five properties in the sample can move sharply on a single property’s rate revision, so they are listed separately as reference values and are not used in the ranking discussion. New openings are on an OTA listing-confirmation basis, where the pre-opening listing rate is only about 19%, so counts for the most recent months and years may increase as further listings appear. Because construction permits for the building-plan pipeline are filed one to two years before opening, figures for 2027 onward are current lower bounds. Room stock figures are aggregated within the OTA listing scope tracked by our company and do not cover every lodging property in the prefecture. Occupancy and listed prices are a snapshot as of the time of writing and may shift slightly with subsequent re-aggregation.
■ Market data
- MetroEngines Research — estimated settled ADR and listed prices (29 municipalities in Iwate, July 2024–July 2026 finalized basis, N=245–257 properties per month); occupancy (estimated on an OTA listed-inventory basis, July 2026, N=266 properties and 16,166 rooms)
- MetroEngines Research & Consulting (OTA listing-confirmation basis) — newly opened properties in Iwate (2023–2026, N=37 properties); 883 properties and 25,845 rooms listed on OTAs within the prefecture
- Compiled by MetroEngines Research & Consulting from the Ministry of Land, Infrastructure, Transport and Tourism, “Survey on Construction Dynamics” — supply pipeline on a building-plan basis
■ Government and public information
- Morioka City, “Introduction of the Lodging Tax” (Morioka City official website)
- Morioka City, “Guide to Special Collection Procedures for the Lodging Tax” (PDF)
- Iwate Prefecture, “Tourism Statistics”
■ News coverage and press releases
- Iwate Nippo, “Morioka introduces Iwate’s first lodging tax at ¥200 per night” (December 23, 2025)
- Iwanichi Nippo, “Tourist arrivals up 6% last year in Hiraizumi” (February 13, 2025)
- “First entry into Iwate: a highland resort hotel ‘wrapped in forest’ opens in Hachimantai — LiVEMAX RESORT Hachimantai Forest” (PR TIMES)
- Toyoko Inn Co., Ltd., “New property ‘Toyoko INN Kitakami-eki Nishiguchi’ opens for reservations from December 2” (PDF, December 1, 2025)
- Sotetsu Hotels, “[Opening October 1, 2026] Sotetsu Fresa Inn Kitakami-Ekimae launches opening commemorative plans”
- Tohoku District Transport Bureau, “International overnight stays in Tohoku hit a record 2.77 million in 2025” (March 3, 2026)