

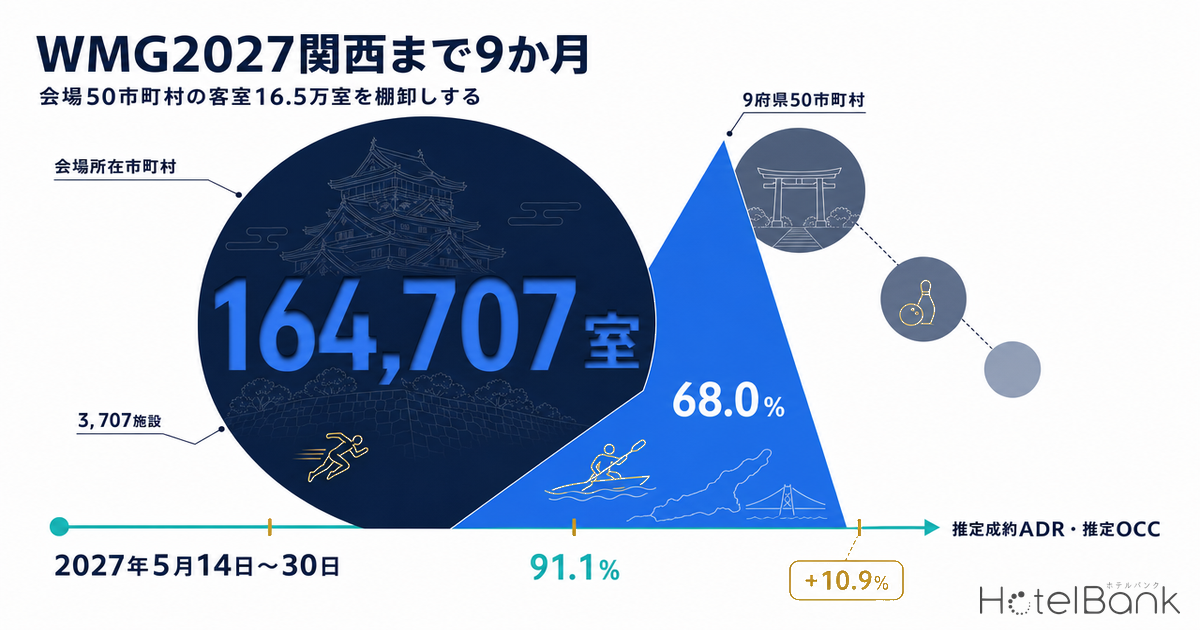
For 17 days from May 14 to May 30, 2027, Kansai will host the World Masters Games 2027 Kansai. It is an international multi-sport festival for lifelong sport, open to essentially anyone aged 30 and over, covering 59 events across 35 sports, with a participation target of 50,000 people — 30,000 from Japan and 20,000 from overseas. With just over nine months to go, the first thing hotel operators and municipal tourism officers need to grasp is the underlying inventory structure: where the rooms are, and how many.
This article identifies the municipalities hosting venues based on the official venue list, and aggregates the room stock of those 50 municipalities (across 9 prefectures) at the property level. It also presents May 2026 actuals (estimated settled ADR and estimated occupancy) as a baseline, and overlays the supply pipeline that will accumulate before the opening. Unlike large events where demand concentrates on a single venue, this one scatters its venues across 9 prefectures. The question to read for, accordingly, is not total volume but distribution.
Metric Definitions Used in This Article
- ADR (average daily rate) = an estimated settled rate (tax-exclusive equivalent), calculated by applying a business-format-specific adjustment coefficient to the lowest publicly listed plan level each property posts on OTAs and elsewhere (double occupancy, per-room rate, tax-inclusive). Cross-checked against property-level actuals disclosed by listed hotel REITs, the median error is 6.6%. These are estimates and differ from each property’s actual transacted rates and accounting figures. Area-level ADR is the median of the properties covered (the level of a typical property in that area).
- OCC (occupancy) = the share of sold rooms against total rooms in the area (an estimate based on OTA sales inventory; consistency checks against monthly REIT disclosures confirm accuracy within roughly a few percentage points). It is an estimate based on how listed OTA inventory is absorbed, and differs from each property’s overall actual occupancy.
- Room stock = the total room count of properties tracked by MetroEngines Research whose operation can be confirmed on OTAs. Ryokan, guesthouses, simple lodgings and public lodging facilities not listed on OTAs are excluded.
- Data source: MetroEngines Research
- — The 50 venue-hosting municipalities (9 prefectures) hold 3,707 properties and 164,707 rooms. Adding Okayama City, home of the shooting venue, brings it to 3,783 properties and 172,708 rooms.
- — Osaka City (73,589 rooms) and Kyoto City (38,322 rooms) alone account for 68.0% of the total. The remaining 48 municipalities add up to just 52,796 rooms.
- — 33 of the 50 municipalities have fewer than 1,000 rooms, totaling 9,559 rooms. Of those, 41.7% sit in small properties of 30 rooms or fewer.
- — The pricing baseline belongs in May 2026, not May 2025, which fell in the opening stretch of the Expo. Osaka is -26.1% year on year, but +7.6% against May 2024, before the Expo.
- — Estimated occupancy for May 14–30, 2026 averaged 91.1%, leaving an average of 22,400 rooms a day available to sell. Saturdays tighten to 10,400 rooms — a 3.5x gap against Sundays.
Venues scatter across 50 municipalities in 9 prefectures — a structural break from single-venue events
Start with the premises. Expanding the official venue list (as of August 11, 2026) down to the municipal level, venues sit in 9 prefectures — Fukui, Shiga, Kyoto, Osaka, Hyogo, Nara, Wakayama, Tottori and Tokushima — across 50 municipalities in total. In addition, clay target shooting alone will be held outside those 9 prefectures, at the Okayama Prefectural Clay Shooting Range in Okayama City. Venues can still be added or changed during the fiscal year, so in practice the official venue list is worth checking on an ongoing basis.
The degree of that dispersion is the biggest difference from comparable “pre-opening inventory” analyses. A single-venue event lets you draw the demand catchment almost entirely by counting a 5km radius around one site; that approach does not transfer here. Golf alone splits across seven sites in Tokushima Prefecture (Tokushima City, Naruto, Awa, Kamiyama, Mima and Miyoshi), while orienteering scatters across the highlands of northern Hyogo — Kami, Yabu and Kamikawa. Canoe goes further still: polo in Awara (Fukui), dragon boat in Otsu (Shiga), marathon in Kyotango (Kyoto) and slalom in Naka (Tokushima) — four prefectures for one sport.
The competition window is also long, at 17 days. Participants stay according to their own event schedules, so demand does not concentrate into one or two specific days; it spreads gently from mid to late May. From the property side, this is not a one-night scramble but roughly three weeks of area-wide demand — a shape that combines readily with multi-night stays and touring.
The 50 venue municipalities hold 3,707 properties and 164,707 rooms
Aggregating properties whose operation can be confirmed on OTAs across the 50 venue-hosting municipalities yields 3,707 properties and 164,707 rooms. Adding Okayama City, home of the shooting venue (76 properties, 8,001 rooms), brings the figure to 3,783 properties and 172,708 rooms. Against a target of 50,000 participants, the total volume looks comfortably deep. But those 164,707 rooms are not spread evenly across the 9 prefectures.
Source: MetroEngines Research; compiled by the HotelBank Editorial Team (N=3,707 properties)
By prefecture, Osaka’s five venue cities alone (Osaka City, Sakai, Higashiosaka, Kishiwada and Sennan) hold 76,751 rooms, or 46.6% of the total. Kyoto’s eight venue municipalities follow with 41,039 rooms (24.9%). Those two prefectures together reach 71.5%. Drilling down to the municipal level, Osaka City (73,589 rooms) and Kyoto City (38,322 rooms) hold 111,911 rooms between them — fully 68.0% of the total. The remaining 48 municipalities add up to just 52,796 rooms.
| Prefecture | Venue municipalities | Properties | Rooms | Share of rooms in properties of 30 rooms or fewer | May 2026 estimated settled ADR | YoY | May 2026 estimated OCC |
|---|---|---|---|---|---|---|---|
| Osaka | 5 | 778 | 76,751 | 5.5% | ¥10,100 | -26.1% | 88.0% |
| Kyoto | 8 | 1,976 | 41,039 | 23.1% | ¥17,000 | +3.5% | 92.0% |
| Hyogo | 10 | 387 | 22,852 | 12.9% | ¥13,300 | +1.1% | 88.5% |
| Shiga | 6 | 125 | 6,959 | 12.6% | ¥8,300 | +2.6% | 87.8% |
| Tottori | 5 | 122 | 6,219 | 15.2% | ¥8,700 | -3.6% | 86.9% |
| Tokushima | 9 | 147 | 5,190 | 22.1% | ¥6,800 | +4.0% | 85.8% |
| Wakayama | 4 | 129 | 4,238 | 25.0% | ¥9,800 | +3.1% | 82.9% |
| Fukui | 2 | 43 | 1,459 | 26.9% | ¥10,700 | +1.5% | 84.9% |
| Nara | 1 | 0 | 0 | — | ¥13,000 | -5.3% | 89.5% |
| 9 prefectures, total | 50 | 3,707 | 164,707 | 12.8% | — | — | — |
Property and room counts are on a venue-municipality basis. ADR and OCC are prefecture-wide aggregates (ADR samples by prefecture: N=134–650 properties). Source: MetroEngines Research; compiled by the HotelBank Editorial Team
Nara has only one venue, a single facility in Katsuragi (tug of war), and as discussed below, no lodging inventory whose operation can be confirmed on OTAs has been captured in that city. The ADR and OCC in the table are prefecture-wide values; in practice the accommodation will be absorbed by clusters in surrounding cities such as Nara City and Kashihara.
What dispersed venues actually look like — 33 of 50 municipalities hold fewer than 1,000 rooms
Ranking the 50 venue municipalities by room count, only 17 hold 1,000 rooms or more; the remaining 33 fall below that line. Those 33 municipalities total 9,559 rooms across 418 properties — just 5.8% of the room stock in the 50 venue municipalities (3.8% across the 9 prefectures as a whole). The outdoor, dispersed disciplines — marathon, cycling, canoe, orienteering — are precisely the ones sited on this thin side of the distribution.
Circle size = room count. Plotted at a representative point for each venue municipality (the centroid of property locations). Source: MetroEngines Research; compiled by the HotelBank Editorial Team
In these 33 thin municipalities, the character of the properties themselves differs from urban markets. Of the 9,559 rooms, 41.7% sit in small properties of 30 rooms or fewer, and in places such as Kami (978 rooms) and Takahama (191 rooms), the entire inventory consists of properties of 30 rooms or fewer. Yabu, which hosts the orienteering forest events, is much the same: 428 of its 639 rooms (67.0%) are in small properties. Whatever share of the event’s accommodation demand lands in municipalities like these will be absorbed by guesthouses, pensions and small ryokan.
Top 20 venue municipalities with fewer than 1,000 rooms (the relevant portion of N=418 properties). Source: MetroEngines Research; compiled by the HotelBank Editorial Team
Pushing further, in three of the 50 venue municipalities — Kyotanabe (Kyoto), Katsuragi (Nara) and Ishii (Tokushima) — no lodging inventory whose operation can be confirmed on OTAs could be captured at all. This does not mean those municipalities have no accommodation; properties not listed on OTAs, along with public facilities, fall outside this aggregation. In practice, neighboring municipalities become the catchment. Aggregating a 15km radius from the center of each venue municipality gives the following.
| Venue municipality (sport) | Rooms within the municipality | Properties within 15km | Rooms within 15km | Principal catchment |
|---|---|---|---|---|
| Kyotanabe (handball) | 0 | 94 | 2,349 | Uji, southern Kyoto Prefecture, northeastern Osaka Prefecture |
| Katsuragi (tug of war) | 0 | 49 | 928 | Kashiba (9 properties, 206 rooms), Kashihara, Yamatotakada |
| Ishii (bowling) | 0 | 72 | 3,796 | Tokushima City (57 properties, 3,401 rooms) |
| Kami (orienteering) | 978 | 128 | 1,435 | Mainly small properties within the town (all rooms in properties of 30 rooms or fewer) |
The 15km radius is aggregated by straight-line distance from each municipality’s city or town hall. Source: MetroEngines Research; compiled by the HotelBank Editorial Team
This is where the upside specific to a dispersed event sits. Bowling participants in Ishii flow to Tokushima City; tug-of-war participants in Katsuragi flow to Kashiba and Kashihara. The opportunity to capture guests arises less in the venue municipality itself than in the properties within a 30-minute ring around it. The same shape shows up whenever demand overflows from a saturated core into the towns beside it. Put the other way round: whether a property in a neighboring municipality can state its travel time to the nearest venue is likely to be the dividing line between being chosen and being passed over.
Put the pricing baseline in May 2026, not 2025
In thinking about the rate band for the event period, the choice of base year needs care. May 2025 fell in the opening stretch of Expo 2025 Osaka, Kansai (which opened on April 13, 2025), a month when rates across Kansai were temporarily pushed up. Osaka’s estimated settled ADR for May jumped from ¥9,300 in May 2024 to ¥13,600 in May 2025, then settled back to ¥10,100 in May 2026. That is -26.1% year on year, but +7.6% against May 2024, before the Expo — the rate level itself is stepping up gently. Base it on 2025 and it looks like retreating demand; base it on 2024 and it looks like growth. The same data tells opposite stories. For building event-period assumptions, the practical choice is to put the baseline on May 2026, the most recent settled month.
May estimated settled ADR for principal venue areas (N=22–194 properties per area). Source: MetroEngines Research; compiled by the HotelBank Editorial Team
At the municipal and ward level, the direction is not uniform. Nakagyo-ku in Kyoto City rose from ¥17,200 to ¥19,100, +10.9% year on year (N=112 properties), and Shimogyo-ku from ¥16,200 to ¥17,400, +7.7% (N=167 properties). Meanwhile Chuo-ku in Osaka City fell from ¥15,600 to ¥12,000, -23.1% (N=194 properties), and Kita-ku from ¥14,500 to ¥11,100, -23.7% — the post-Expo payback showing clearly. This pattern is consistent with our monthly tracking of Osaka’s estimated settled ADR.
On the regional side, Wakayama City rose steadily from ¥7,200 to ¥7,900, +9.6% (N=45 properties), and Tokushima City from ¥6,400 to ¥6,900, +8.8% (N=50 properties). The rate level itself is only a little over half that of Chuo-ku in Osaka, but if the event period layers demand on top of normal conditions, the room to grow rates is larger on this side. Conversely, areas built around ryokan with meals already priced in the ¥20,000s per night — Kyotango (¥20,600 to ¥18,100) or Kami (¥25,500 to ¥24,500) — are better suited to accumulating revenue through occupied nights and multi-night stays than through rate.
⚠ On rates for May 2027: selling rates for May 2027, the event period, were barely listed on OTAs at the time of this research. This article does not forecast 2027 rates; it goes no further than presenting settled May 2026 actuals as a baseline. For actual pricing design, monitor inventory absorption on an ongoing basis once listings open.
17 days, three Saturdays — how much catchment is left in late May
We aggregated May 14–30, 2026 — the dates corresponding to the 2027 competition window (May 14–30) — day by day across all 9 prefectures (not limited to venue municipalities: 3,786 properties, 252,962 rooms). Estimated occupancy over those 17 days averaged 91.1%, which works out to an average of 22,400 rooms a day left available to sell. Given that 50,000 participants will spread their stays across the full window, the catchment exists in aggregate.
Daily totals for the 9 prefectures, May 14–30, 2026 (N=3,786 properties / 252,962 rooms). Source: MetroEngines Research; compiled by the HotelBank Editorial Team
The day-to-day swings, however, are large. The loosest day was Sunday, May 17, 2026, with 36,573 rooms remaining (85.5% estimated occupancy); the tightest was Saturday, May 23, 2026, with 10,400 rooms (95.9%). Remaining inventory differs by a factor of 3.5 between Saturday and Sunday. The 2027 window contains three Saturdays — May 15, 22 and 29 — so this day-of-week structure will carry straight into event-period supply and demand.
Read the other way, weekdays and Sundays have clear headroom. A 17-day window also means participants have considerable freedom to build stays that avoid Saturdays. Beyond the two-night, Friday-check-in/Sunday-check-out pattern, three- to five-night stays that fold weekdays around a competition schedule become viable. From the property side, that leaves room to design multi-night discounts and touring plans for repeat-night guests in a form that does not depend on Saturdays.
Rooms still to come — recent openings and the pipeline
The catchment is not fixed. Across the 9 prefectures, 291 properties and 9,549 rooms opened in 2025, and 194 properties and 4,545 rooms have been confirmed on OTAs for 2026 through August. Osaka’s 5,501 rooms in 2025 include large Expo-driven openings; openings have settled down in scale since the turn of 2026.
| Prefecture | 2025 properties / rooms | 2026 (Jan–Aug) properties / rooms |
|---|---|---|
| Osaka | 54 / 5,501 | 33 / 2,522 |
| Kyoto | 82 / 1,643 | 61 / 532 |
| Hyogo | 60 / 843 | 44 / 758 |
| Tottori | 7 / 447 | 4 / 170 |
| Fukui | 20 / 391 | 13 / 333 |
| Wakayama | 25 / 314 | 12 / 23 |
| Shiga | 18 / 206 | 10 / 105 |
| Nara | 12 / 166 | 9 / 56 |
| Tokushima | 13 / 38 | 8 / 46 |
| 9 prefectures, total | 291 / 9,549 | 194 / 4,545 |
Source: MetroEngines Research & Consulting (on an OTA-listing-confirmed basis)
One caveat on how to read this data. Zero properties are currently confirmed as opening in 2027 across the 9 prefectures, but that does not mean supply stops. OTA listings begin only a few months before opening, so the further out the opening year, the more structurally undercounted it is. To see supply in the run-up to the event, construction-plan data has to be layered on top.
Of the planning data based on MLIT’s Building Construction Statistics Survey (建築動態統計調査) — 81 projects nationwide — 16 sit in the 9 host prefectures. Of those, three are scheduled for completion before the event opens: 25 rooms in Sumoto, Hyogo (completion scheduled January 2027), 36 rooms in Minamiawaji, Hyogo (same), and 220 rooms in Dojimahama, Kita-ku, Osaka City (completion scheduled April 2027) — 281 rooms in total. Minamiawaji is a beach volleyball venue municipality, and this represents a 6.0% addition to its current 601 rooms. Scheduled for completion after the event are 135 rooms in Kamigyo-ku, Kyoto City (September 2027) and 70 rooms in Chuo-ku, Kobe (December 2027).
That count covers projects for which building certification applications have been filed to date, and it is the kind of figure that grows as further applications come in. In other words, 281 rooms is the floor of the confirmed pipeline, not the ceiling. Even so, with nine months remaining, it is realistic to assume the event-period catchment will consist largely of existing stock. On the realities of build duration, our measurement of start-to-completion periods across 67 planned projects is also useful reference.
Where the upside sits
Pulling the numbers together, the accommodation catchment for the World Masters Games 2027 Kansai has three characteristics. First, the total is deep: 164,707 rooms observed across the 50 venue municipalities and 252,962 across the 9 prefectures, leaving quantitative headroom against 50,000 participants spread over 17 days. Second, that volume is extremely skewed. Osaka City and Kyoto City hold 68.0% between them, while the 33 municipalities hosting dispersed outdoor disciplines total just 9,559 rooms. Third, the thinner the area, the higher the share of small properties — 41.7% of those rooms sit in properties of 30 rooms or fewer.
This structure points to different opportunities for different operators. For large properties in Osaka City and Kyoto City, the basic position is as the catchment for stays spanning the 17-day window. Urban properties with predictable travel times to venues hold a locational advantage in capturing participants and companions across multiple sports at once. For small properties near venues, limited inventory is itself the reason to design event-period selling early. Multi-night-based rates and operational touches such as shuttle service to competition venues or early breakfast service feed directly into both rate and occupancy.
From a municipal tourism perspective, the practical task in cases where venue municipalities have thin or uncaptured inventory — Kyotanabe, Katsuragi, Ishii — is how to make the catchment within a 15km radius visible. Organizing a list of properties within a 30-minute ring of the venue, with travel times, early on makes it easier to keep participants’ booking behavior inside the region. For investors, the event is a one-off demand spike and thin material on its own for justifying new development. The more notable point is the underlying trend in regional core cities where rates are rising independently of the Expo — Wakayama City (+9.6%) and Tokushima City (+8.8%) — with the event layered on top of that.
On how demand from multi-prefecture sporting events propagates, our accommodation demand map for the Kinki Inter-High 2026 covers the same structure. The degree of venue dispersion and the length of the competition window determine not the intensity of demand but its spread — and the World Masters Games 2027 Kansai is a textbook case.
Related Reading
- Osaka Settled ADR June 2026: City -26.3%, Business -32.8% Post-Expo
- Kinki Inter-High 2026: Hotel Demand Map — 30 Sports, 6 Prefectures
- Fukui’s 3 Hotel Clusters: 2.5x ADR Gap and the Upper-Mid Whitespace
- Hotel Build Times: 2.80-Year Median, 1.96 Solo vs 4.00 Mixed-Use
- 493 Medical Conferences in Japan: 75.7% of Nights Fall Wed-Fri
References and Sources
■ Official event information
- World Masters Games 2027 Kansai, “Event Overview” (Japan Association for the World Masters Games 2021 Kansai, accessed August 11, 2026)
- World Masters Games 2027 Kansai, “Venue List” (same, accessed August 11, 2026; used to identify venue municipalities)
- Same, “Shooting (Clay Target)” competition page (confirming the Okayama Prefectural Clay Shooting Range as the venue)
■ Data sources
Covering properties tracked by MetroEngines Research whose operation can be confirmed on OTAs, we aggregated the room stock of the 50 venue municipalities (N=3,707 properties), estimated settled ADR by prefecture and by municipality/ward (N=134–650 properties by prefecture; N=1–194 properties by municipality/ward), and estimated occupancy across the 9 prefectures (N=3,786 properties / 252,962 rooms). Venue municipalities were identified from the official event website’s venue list (as of August 11, 2026). New openings are on an OTA-listing-confirmed basis; planned hotels use data on a building-certification-application basis derived from MLIT’s Building Construction Statistics Survey (建築動態統計調査).
■ Estimation assumptions
The baseline for rate and occupancy was placed on May 2026, the most recent settled month, rather than May 2025, which fell in the opening stretch of Expo 2025 Osaka, Kansai. The supply-demand structure of the competition window is approximated using daily actuals for May 14–30, 2026, corresponding to May 14–30, 2027. The 15km radius aggregation uses straight-line distance from each venue municipality’s city or town hall. The prefecture-level ADR and estimated occupancy in Table 1 are prefecture-wide aggregates rather than venue-municipality figures, and therefore cover a different scope from the property and room counts (which are on a venue-municipality basis).
■ Limitations and caveats
Ryokan, guesthouses, simple lodgings and public lodging facilities not listed on OTAs are excluded from the aggregation. Both ADR and occupancy are estimates based on publicly listed OTA inventory and differ from each property’s actual transacted rates and actual occupancy. Selling rates for May 2027 were barely listed on OTAs at the time of this research, and this article does not forecast 2027 rates. New openings become structurally undercounted the further out the opening year, owing to listing lead time, and the 281 rooms of planned hotels represent the floor of the confirmed pipeline. The venue list is as of August 11, 2026 and may be added to or changed.
■ Market data
- MetroEngines Research — room stock aggregation (50 venue municipalities, N=3,707 properties), estimated settled ADR (N=134–650 properties by prefecture; N=1–194 properties by municipality/ward), estimated occupancy (9 prefectures, N=3,786 properties / 252,962 rooms)
- MetroEngines Research & Consulting (on an OTA-listing-confirmed basis) — aggregation of new openings in 2025 and 2026
- Compiled by MetroEngines Research & Consulting from MLIT’s Building Construction Statistics Survey (建築動態統計調査) — planned hotel pipeline (81 projects nationwide, of which 16 in the 9 host prefectures)
Note on the data: room stock covers properties tracked by MetroEngines Research whose operation can be confirmed on OTAs, and excludes accommodation not listed on OTAs. Because new-opening data is on an OTA-listing-confirmed basis, the further out the opening year, the more structurally undercounted it is (zero properties are currently confirmed as opening in 2027, but this reflects listing lead time). Planned hotel data is on a building-certification-application basis as of the research date; project and room counts are expected to increase as further applications are filed, so please treat it as the floor of the confirmed pipeline at this point in time. The venue list is as of August 11, 2026, and competition venues may be added or changed.