

Almost every discussion of hotel development in Japan runs along three axes: where, how many rooms, and at what price. This site has covered 1,000-room supply in Kaihin-Makuhari, the development pipeline on the eve of Nagoya’s maglev, the price-band white space around Sendai Station, and the absence of luxury inventory in Kanazawa — all of them stories about volume, location, or rate. This article is about none of those. It is about a fourth axis: time. How many years does a hotel take from groundbreaking to completion? What determines that number? And when a schedule slips by a year, what does the developer actually pay for it? Using Japan’s Ministry of Land, Infrastructure, Transport and Tourism (MLIT) Construction Statistics Survey, we measured 67 planned hotel projects totalling 15,015 rooms and quantified the time axis of development itself.
Metric Definitions Used in This Article
- Construction period: the elapsed time in years from the groundbreaking date to the scheduled completion date, converted at 365.25 days per year. Projects missing either the start or the completion date are excluded from the aggregation.
- Planned-project data: planned and under-construction hotel projects derived from building-confirmation applications recorded in MLIT’s Construction Statistics Survey. Confirmation applications are generally filed one to two years or more before opening, so counts for future years will rise as further applications are filed. Read them as a floor on the pipeline confirmed as of today.
- Hotel-only use / mixed use: we parsed each project’s stated principal uses and classified any project containing uses other than hotel and parking (offices, retail, residential, halls, etc.) as mixed use, and the rest as hotel-only. Where the record embeds a room count in parentheses (e.g. “Hotel (126 rooms)”), the parenthetical is stripped before classification.
- ADR (average daily rate): an estimated settled rate (net of tax) calculated by applying category-specific correction coefficients to the lowest published plan level each property lists on booking sites (OTAs and similar) — double occupancy, per-room, tax-inclusive. Cross-checked against property-level disclosures from listed hotel REITs (91 properties, most recent three months), the median error is roughly 7%. These are estimates and differ from each property’s actual transacted rates or accounting figures. An area-level ADR is the median across the target properties (the level of a typical property in that area).
- OCC (occupancy): wherever this article refers to OCC, it is an assumed occupancy (80%, full-year basis) used as an input to the schedule-cost calculation, not an observed figure.
- Data sources: compiled by MetroEngines Research & Consulting from MLIT’s Construction Statistics Survey / MetroEngines Research & Consulting
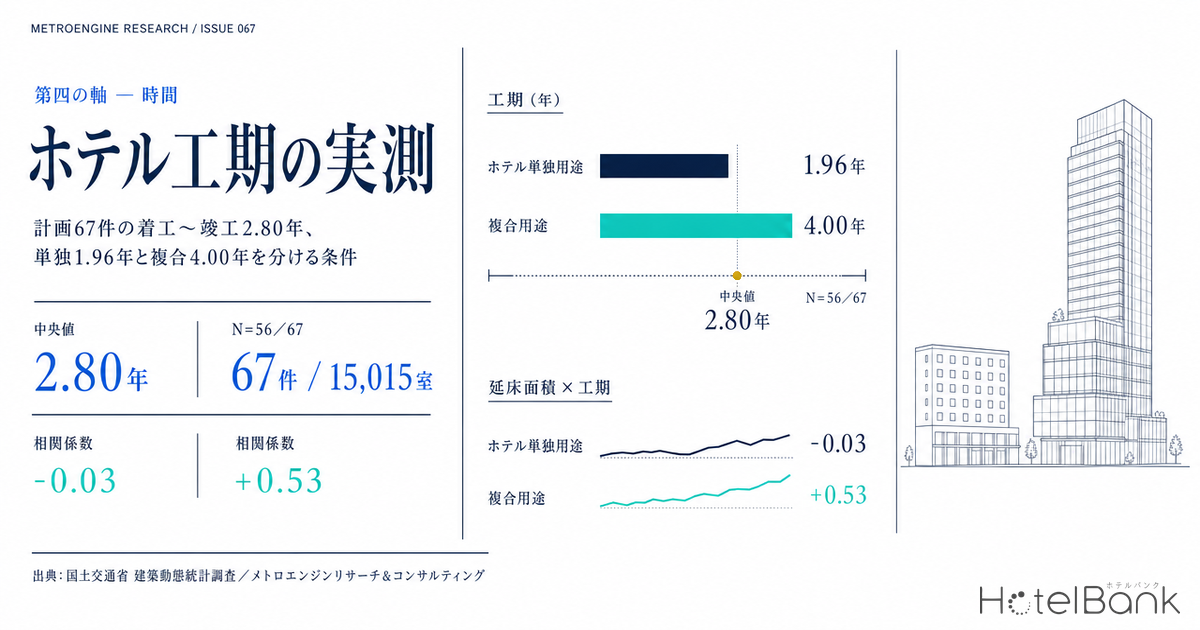
- — From groundbreaking to completion, the median is 2.80 years (N=56 of 67). The interquartile range is 1.91–4.02 years, and the full spread runs from 1.00 to 8.25 years — a factor of more than eight.
- — The dominant explanatory variable is the use mix. Hotel-only projects run 1.96 years against 4.00 years for mixed use, and the two barely share a distribution.
- — Room count does not explain build time (r = -0.03). What does is gross floor area (log, r = +0.53) and storey count (r = +0.37).
- — One extra year of construction carries a real burden of roughly ¥340 million, about 10% of construction cost. Most of it is not interest during construction but the opportunity cost of a delayed opening.
- — For 2027 completions, mixed use flips to more than 60% (1,234 hotel-only rooms against 1,982 mixed-use rooms), changing the character of the inventory that lands.
The median is 2.80 years — but the distribution runs from 1.0 to 8.25
Start by fixing the population. Within the scope tracked by MetroEngines Research & Consulting, planned and under-construction hotel projects derived from MLIT’s Construction Statistics Survey number 67 projects and 15,015 rooms. Room counts are recorded for all 67. Both a groundbreaking date and a scheduled completion date, however, are present for only 56 of the 67. The remaining 11 have no recorded groundbreaking date and are excluded from the build-time aggregation. Everywhere this article discusses build time, the population is N=56. Please do not read the figures as medians across all 67.
Across those 56 projects, the span from groundbreaking to completion has a median of 2.80 years and a mean of 3.15 years. The shortest is 1.00 year, the longest 8.25 years, and the interquartile range is 1.91 to 4.02 years. The industry’s rule of thumb — “a hotel takes about three years” — holds up reasonably well as a median. But what deserves attention is not the median itself. It is the spread: a more than eightfold range from 1.0 to 8.25 years. Understand where that spread comes from and you can read the landing date of an individual project with far more confidence.
Colour the distribution by use type and half the answer is already visible. Twenty-two of the 31 hotel-only projects cluster below 2.5 years, while 20 of the 25 mixed-use projects cluster above 3.0 years. They overlap only in a narrow band between 2.0 and 3.0 years; in practice they are two separate distributions. The hotel-only median is 1.96 years, the mixed-use median 4.00 years — the same act of “building a hotel,” yet more than double the time to landing.
A note on the population: build time could be calculated for 56 of the 67 projects (11 excluded for a missing groundbreaking date). Those 11 are: Higashiyama-ku, Kyoto (53 rooms); Minokamo (120); Furano (200); Rikuzentakata (134); Otari (159); Komatsu (171); Chuo-ku, Osaka (223); Fujiyoshida (54); Tamba-Sasayama (105); Koto-ku, Tokyo (285); and Kumiyama (224). All of them do have a recorded scheduled completion date. We deliberately avoid describing any of these figures as “the median across 67 projects.”
What stretches a schedule is not room count — it is floor area and use complexity
Intuition says bigger hotels take longer. The measurements say otherwise. The correlation between room count and build time is -0.03 (N=56) — statistically, essentially none. Line up median build times by room-count band and no monotonic pattern appears either: 3.92 years for 99 rooms or fewer, 2.74 years for 100–199, 3.25 years for 200–299, and 2.87 years for 300 or more.
By contrast, the correlation between log gross floor area and build time is +0.53 (N=54), and the correlation with storey count is +0.37 (N=55). Sorted by floor-area band, the medians rise cleanly: 1.54 years below 5,000 m², 2.18 years from 5,000 to under 20,000 m², 3.41 years from 20,000 to under 100,000 m², and 4.00 years at 100,000 m² and above. Room count does not explain build time; building volume does.
The contrast between these two charts is the central finding of this article. Building a 250-room hotel and building a 100,000 m² mixed-use tower that contains 250 hotel rooms are, in time terms, entirely different undertakings. Reading only the room count — “ours is mid-sized, so three years” — will miss in practice.
The scatter plot makes the structure plainer still. The blue points (hotel-only) sit at the lower left — small floor areas, short schedules. The navy points (mixed use) spread to the upper right, and for redevelopment projects above 100,000 m², roughly four years becomes the norm. Bubble size — room count — has almost nothing to do with where a point falls: there is a 380-room bubble on the hotel-only side and a 70-room bubble on the mixed-use side.
| Category | Projects | Median build time | Mean build time | Median rooms | Median floor area | Median storeys |
|---|---|---|---|---|---|---|
| Hotel-only use | 31 | 1.96 yrs | 2.34 yrs | 180 rooms | 5,954 m² | 12 |
| Mixed use | 25 | 4.00 yrs | 4.15 yrs | 217 rooms | 82,662 m² | 26 |
| 9 storeys or fewer | 9 | 2.46 yrs | 3.10 yrs | — | 10,804 m² | — |
| 10–19 storeys | 28 | 2.03 yrs | 2.43 yrs | — | 7,430 m² | — |
| 20 storeys or more | 18 | 4.15 yrs | 4.33 yrs | — | 113,754 m² | — |
The storey breakdown holds one curiosity. Buildings of 10–19 storeys (median 2.03 years) finish faster than those of nine storeys or fewer (2.46 years). The sub-nine-storey group mixes in small mountain-area and suburban projects, whereas urban 10-to-19-storey limited-service hotels are built on standardised processes and move quickly. Above 20 storeys the median jumps to 4.15 years, but the median floor area in that group is 113,754 m² — an order of magnitude apart — so it is more natural to read business volume, rather than height itself, as the driver.
From 1.00 year to 8.25 — what the two extremes reveal
Below are the projects at either end of the distribution, listed with the locations and developer names exactly as recorded in the data. We do not fill in hotel or brand names by inference.
| Location | Rooms | Storeys | Floor area | Build time | Principal use / building type | Developer (as recorded) |
|---|---|---|---|---|---|---|
| Kumagaya, Saitama (埼玉県熊谷市筑波1-179-1) | 257 | 14 | 4,030 m² | 1.00 yr | Hotel (257 rooms) / new build | APA Home Co., Ltd.; APA Mansion Co., Ltd. (アパホーム(株)、アパマンション(株)) |
| Yachimata, Chiba (千葉県八街市大谷流112) | 50 | 5 | 5,670 m² | 1.04 yrs | Hotel (50 rooms) / new build | Yachimata Mirai Toshi Co., Ltd. ((株)八街未来都市) |
| Kita-ku, Sapporo, Hokkaido (北海道札幌市北区北6条西6-3-1) | 168 | 11 | 2,800 m² | 1.16 yrs | Hotel / new build | APA Home Co., Ltd.; APA Mansion Co., Ltd. (アパホーム株式会社、アパマンション株式会社) |
| Honjo, Saitama (埼玉県本庄市駅南1-2) | 121 | 9 | 2,275 m² | 1.16 yrs | Business hotel (121 rooms) / new build | AB Hotel Co., Ltd. (ABホテル株式会社) |
| Urayasu, Chiba (千葉県浦安市千鳥15-9) | 126 | 13 | 7,130 m² | 1.49 yrs | Hotel (126 rooms) / new build | Daiichi Realter Co., Ltd. (第一リアルター(株)) |
The short end is, without exception, hotel-only, new-build. Floor areas run 2,275–7,130 m², storeys 5–14, and room counts 50–257, so scale varies widely — yet every one is a single-use, limited-service property reaching completion in one to one and a half years. The 257-room Kumagaya project at 4,030 m² landing at exactly 1.00 year is a concrete illustration of the floor that standardised design and process management can reach. That a single business group posts 1.0–1.5 years consistently across multiple projects is itself evidence that a development model with predictable schedules exists.
| Location | Rooms | Storeys | Floor area | Build time | Principal uses | Developer (as recorded) |
|---|---|---|---|---|---|---|
| Kita-ku, Okayama (岡山県岡山市北区野田屋町1丁目2,3) | 300 | 12 | 40,400 m² | 7.75 yrs | Residential, hotel, retail | Nodayacho District Urban Redevelopment Preparatory Association (野田屋町地区市街地再開発準備組合) |
| Chuo-ku, Tokyo, Nihonbashi 1-chome 30–32 (東京都中央区日本橋一丁目30〜32番) | 197 | 39 | 368,700 m² | 6.67 yrs | Retail, offices, hotel, residential, etc. | Nihonbashi 1-chome Central District Urban Redevelopment Association and others (日本橋1丁目中地区市街地再開発組合ほか) |
| Chuo-ku, Kobe, Hyogo (兵庫県神戸市中央区雲井通5丁目6) | 70 | 32 | 12,000 m² | 5.58 yrs | Hotel, offices, retail, tourism functions, bus terminal, library | Kumoidori 5-chome Redevelopment Co., Ltd. (雲井通5丁目再開発株式会社) |
| Chuo-ku, Sapporo, Hokkaido (北海道札幌市中央区北3条西3丁目1-44) | 172 | 20 | 33,546 m² | 5.57 yrs | Offices, bank branch, restaurants, retail, clinic, hotel, etc. | Hulic Co., Ltd. (ヒューリック株式会社) |
| Minami-ku, Hiroshima (広島県広島市南区松原町2-37) | 380 | 20 | 113,754 m² | 4.98 yrs | Retail, hotel, parking | West Japan Railway Company and others (西日本旅客鉄道株式会社ほか) |
The long end resolves almost entirely into urban redevelopment projects and integrated development at transport nodes. In schemes such as Kobe’s Kumoidori 5-chome, which houses a bus terminal and a library, or the south exit of Hiroshima Station, with its retail and parking, the hotel is one component of a vast complex. There is structurally no way to isolate the hotel portion and compress its programme, so it is dragged along by the completion of the whole. This is not a question of developer competence; it is time dictated by the business scheme. Note that the data does contain one hotel-only project at 8.25 years, but it is a three-storey, 60-room property in a mountain area under unusual conditions, and the reasons cannot be identified from this dataset.
When does supply land — the composition flips in 2027
Once build times are legible, the timing of supply becomes more predictable. The chart below arranges all 67 projects and 15,015 rooms by scheduled completion year, stacked by use type.
By year: 5,304 rooms in 2025, 4,967 in 2026, 3,216 in 2027, 1,428 in 2028 and 100 in 2029. Taken at face value the numbers look like a collapse from 2027 onward, but this is a structural property of confirmation-application data, not a disappearance of supply. Applications are normally filed a year or two — often more — before opening. Most projects completing in 2028 or 2029 simply have not been filed yet. The figures shown for future years are a floor on what is currently confirmed.
What matters more is the shift in composition. For 2025 completions the split is 2,590 hotel-only rooms against 2,714 mixed-use; for 2026 it is 3,481 against 1,486, with hotel-only taking roughly 70%. But for 2027 completions the ratio inverts — 1,234 hotel-only rooms against 1,982 mixed-use, with mixed use taking more than 60%. Long-schedule mixed-use projects broke ground earlier and therefore land later. Rooms opening from 2027 onward will increasingly be embedded in urban redevelopment and station-integrated schemes — which means a different competitive set-up from hotel-only properties in terms of location quality, the standard of shared spaces, and linkage to surrounding office and retail demand.
Geographically, Tokyo stands out with 17 projects and 3,546 rooms, followed by Chiba (5 projects, 2,164 rooms), Hokkaido (8, 1,740), Kanagawa (5, 1,087) and Osaka (4, 1,042). The three major metropolitan regions (Tokyo, Osaka, Kyoto, Kanagawa, Aichi, Chiba, Saitama and Hyogo) account for 43 projects and 9,788 rooms against 24 projects and 5,227 rooms elsewhere — roughly a 6:4 split by project count. Yet median build times barely differ: 2.87 years in the major metros against 2.80 years elsewhere. What sets the schedule is not city size but the use mix and volume of the individual project.
At the prefecture level, differences do appear. All three of Saitama’s projects (767 rooms) are hotel-only, with a median build time of 1.16 years — the shortest in the country. Osaka, by contrast, runs 4.22 years, Hyogo 5.58 and Okayama 4.92. Kyoto is an interesting case: all five projects (737 rooms) are hotel-only, yet the median is 3.29 years, well above the 1.96-year national median for hotel-only. This dataset cannot identify why, but the fact that build-time norms can vary by region even within hotel-only projects is worth carrying into a business plan.
The price of one extra year — a simple calculation at a 1.00% policy rate
Time is a cost. At its June 2026 monetary policy meeting the Bank of Japan raised the policy rate from 0.75% to 1.00%, then held it at the July meeting. That is the highest level since 1995, and interest during construction has become an item development projects can no longer ignore. What follows is a simple calculation of what happens when a schedule slips by one year. It is an approximation built on stated assumptions and is not intended for use in individual investment decisions.
Assumptions: (1) The model project uses this dataset’s hotel-only medians: 5,954 m² of floor area (1,801 tsubo) and 180 rooms. (2) Construction cost uses the 2025 all-structure average of ¥1.952 million per tsubo from MLIT’s Building Construction Starts Statistics, for a total of ¥3.52 billion. Land cost is excluded because it varies widely by region. (3) A 70% loan-to-cost ratio with staged drawdown tracking construction progress, giving an average outstanding balance of 60% of the loan amount. (4) Post-opening, we assume an ADR of ¥15,000 — referencing MetroEngines Research & Consulting’s estimated settled ADR for Tokyo business hotels (median ¥14,900 for December 2025 through June 2026, N=899–924 properties) — with 80% OCC and a 40% GOP margin (a conservative figure for limited-service).
| Funding rate (assumed) | +0.5 yr | +1.0 yr | +2.0 yrs | Per room at +1.0 yr |
|---|---|---|---|---|
| 1.5% | approx. ¥11m | approx. ¥22m | approx. ¥44m | approx. ¥120k |
| 2.0% (1.00% policy rate + 1.00% spread) | approx. ¥15m | approx. ¥30m | approx. ¥59m | approx. ¥160k |
| 2.5% | approx. ¥18m | approx. ¥37m | approx. ¥74m | approx. ¥210k |
| 3.0% | approx. ¥22m | approx. ¥44m | approx. ¥89m | approx. ¥250k |
Looking only at interest during construction, one extra year costs roughly ¥30 million at the 2.0% assumption, or about ¥160,000 per room. Against a ¥3.52 billion construction budget that is around 0.8% — not fatal on its own. Add the other consequence of a longer schedule, however — a deferred opening — and the picture changes.
The model project’s rooms revenue is ¥15,000 ADR × 80% OCC (a full-year calculation assumption, not an observed figure) × 365 days × 180 rooms, or ¥790 million a year; at a 40% GOP margin that is ¥320 million a year. Pushing the opening back a year means the start of that ¥320 million annual stream is delayed by a year. Deferring a perpetual earnings stream by one year erodes present value by roughly one year’s GOP at a discount rate around 5%. Combined with interest during construction, the real burden of one extra year is approximately ¥340 million — about 10% of construction cost.
Interest during construction — approx. ¥30m/yr
Assuming a 1.00% policy rate plus a 1.00% spread. At around 0.8% of construction cost, absorbable on its own — though it widens to roughly ¥44 million if the rate rises to 3.0%.
Opportunity cost of a delayed opening — approx. ¥320m/yr
The impact of starting a ¥320 million annual GOP stream one year later. An order of magnitude larger than interest during construction — this is where the economic value of schedule management sits.
Total — about 10% of construction cost
Approximately ¥340 million for one extra year. Put the other way: design and procurement measures that reliably compress the schedule justify spending on the order of a tenth of the construction budget.
The practical implication is clear. Investment in schedule compression is worth making for the cash flow captured by opening earlier, not for the interest saved during construction. Standardised design, narrowing to a single use, early alignment with the contractor — the gap between hotel-only projects at 1.96 years and mixed-use projects at 4.00 years can be quantified as the time value of those 2.04 years. Choosing mixed use has its own logic, in the scarcity of the site or the quality of shared spaces; but it is worth knowing the price of time when that decision is being made.
How far can the cost of a year swing — three scenarios and a two-axis grid
The calculation above is a point estimate resting on one combination: a 2.0% funding rate and a one-year extension. In practice both funding terms and the length of any slippage vary, so below we convert the assumptions already stated in this article (¥3.52bn construction cost, 70% LTC, 60% average outstanding balance, ¥320m annual GOP from ¥15,000 ADR and 80% OCC — a full-year calculation assumption — at a 40% GOP margin, and a discount rate around 5%) across funding rates and extension lengths. This introduces no new measurements or forecasts; it is a unit conversion of assumptions already on the table.
| Scenario | Funding rate | Extension | Interest during construction | Opportunity cost | Total real burden | vs construction cost | Per room |
|---|---|---|---|---|---|---|---|
| Pessimistic | 3.0% | +2.04 yrs | approx. ¥90m | approx. ¥640m | approx. ¥734m | 20.8% | approx. ¥4.08m |
| Funding at 3.0% with the schedule stretching from a hotel-only assumption to the mixed-use equivalent (+2.04 years) | |||||||
| Central | 2.0% | +1.00 yr | approx. ¥30m | approx. ¥320m | approx. ¥345m | 9.8% | approx. ¥1.92m |
| The article’s base assumption (1.00% policy rate + 1.00% spread) with a one-year extension | |||||||
| Optimistic | 1.5% | +0.50 yr | approx. ¥11m | approx. ¥160m | approx. ¥169m | 4.8% | approx. ¥940k |
| Funding at 1.5% with slippage held to six months | |||||||
The central case of approximately ¥345 million matches the “roughly ¥340 million per year” figure from the previous section. The extremes show the width: about ¥169 million in the optimistic case (1.5% rate, six months) against about ¥734 million in the pessimistic case (3.0% rate, 2.04 years) — a spread of more than four times. What moves the number is the length of the extension, not the rate: at the same one-year extension, the gap between 1.0% and 3.0% is only about ¥30 million, whereas holding the rate at 2.0% and stretching the extension from 0.5 to 2.04 years takes the burden from about ¥170 million to about ¥700 million.
| Funding rate \ Extension | +0.5 yr | +1.0 yr | +1.5 yrs | +2.0 yrs | +2.04 yrs measured hotel-only → mixed-use gap |
|---|---|---|---|---|---|
| 1.0% (policy rate level) | approx. ¥165m 4.7% | approx. ¥330m 9.4% | approx. ¥495m 14.1% | approx. ¥660m 18.8% | approx. ¥673m 19.1% |
| 1.5% | approx. ¥169m 4.8% | approx. ¥338m 9.6% | approx. ¥506m 14.4% | approx. ¥675m 19.2% | approx. ¥689m 19.6% |
| 2.0% (base assumption) | approx. ¥172m 4.9% | approx. ¥345m 9.8% | approx. ¥517m 14.7% | approx. ¥690m 19.6% | approx. ¥704m 20.0% |
| 2.5% | approx. ¥176m 5.0% | approx. ¥352m 10.0% | approx. ¥528m 15.0% | approx. ¥705m 20.0% | approx. ¥719m 20.4% |
| 3.0% | approx. ¥180m 5.1% | approx. ¥360m 10.2% | approx. ¥540m 15.3% | approx. ¥719m 20.4% | approx. ¥734m 20.8% |
The practical implication of this grid is that the measured 2.04-year gap separating hotel-only from mixed use converts, for the model project, into roughly ¥704 million of time cost — about 20% of construction cost. Choosing mixed use has its own justifications: site scarcity, the standard of shared spaces, synergies with adjacent uses. This figure does not negate them. But whether the number for “what does time cost” is on the table when the decision is made changes how much resource gets directed into design, procurement and programme detail. Read in reverse, design and procurement measures that reliably cut a year off the schedule justify around ¥340 million, and restructuring a mixed-use scheme into a hotel-only one around ¥700 million.
“Build times are getting shorter” — a misreading, and the censoring behind it
Aggregate this data by groundbreaking year and an interesting — but dangerous — pattern appears. Median build time falls from 5.27 years for 2020 starts to 3.67 years for 2022, 1.96 years for 2024 and 1.74 years for 2025. Newer starts look faster.
Reading this as “schedules are compressing” would be wrong. There are two reasons. First, the use mix has changed. Of the 21 projects that broke ground in 2020–2022, 17 were mixed use; of the 34 that broke ground in 2023–2026, 26 were hotel-only. We are simply comparing groups with fundamentally different schedule characteristics. Second, censoring bias. Scheduled completion years recorded in this dataset run only through 2029, so any long-schedule project that broke ground in 2024 or later and completes from 2030 onward falls outside the observation window entirely. Recent-start cohorts structurally shed their long-schedule members. Splitting by use type still shows apparent shortening — hotel-only from 2.78 years for pre-2023 starts to 1.74 years for 2024-and-later, mixed use from 4.08 to 3.10 — but the latter rests on N=6 and is subject to the same censoring.
If anything, current conditions push the other way. Overtime caps (in principle 45 hours a month, 360 hours a year) have applied to the construction industry since April 2024, and MLIT addresses the constraint in its white paper. If total labour hours are capped, the same volume of work has to be met either with more people or with a longer schedule. Construction costs also keep climbing. On the basis of MLIT’s Building Construction Starts Statistics, hotel construction costs rose from ¥1.38 million per tsubo in 2022 to ¥1.95 million in 2024 — about 41% in two years — and remained high in 2025 at an all-structure average of ¥1.952 million per tsubo (¥2.405 million for steel-frame, ¥2.026 million for reinforced concrete). How that cost escalation is thinning new supply itself over 2027–2029 is traced region by region in Construction +41% & Labor Crunch Erase Japan’s 2027-2029 Hotel Supply.
In this environment some projects never break ground at all. On 27 March 2026 Imperial Hotel announced it was revisiting the timing of demolition work on the Tower Wing in Uchisaiwaicho, Tokyo, and would now aim to start around the end of fiscal 2030. The original plan had been to rebuild the Tower Wing as a 46-storey building in Phase I from fiscal 2024; the schedule was revised citing construction cost escalation and broader price trends. On 26 September 2025 JR Kyushu announced the cancellation of its “Hakata Station Sky City Project,” a 12-storey, one-basement-level complex to be built above the tracks on the south side of Hakata Station. The stated reasons were that construction costs, initially projected at ¥43.5 billion, were on track to roughly double, and that building above live tracks confined work to overnight hours when no trains run, inflating labour costs. It is a textbook case of schedule constraints determining whether a project is viable at all. How widely such cancellations and deferrals are occurring is set out project by project in Frozen Pipeline & the Supply Gap: Cancelled Hotel Projects and Investor Implications.
The 2.80-year median in this data is therefore a measurement of projects that made it to groundbreaking. Cases where the timeline stretched before construction started, or where the scheme was restructured altogether, never appear in the distribution. Reading a build schedule is inseparable from estimating, at the planning stage, how long it will take to reach groundbreaking in the first place — not just from managing the programme afterwards.
Summary — four guidelines for reading the time axis
| Issue | Measured value | How to read it in practice |
|---|---|---|
| Standard build time | Median 2.80 years (N=56 of 67) | The “about three years” rule of thumb is reasonable as a median — but assume the 1.91–4.02-year interquartile spread |
| Use mix | 1.96 years hotel-only / 4.00 years mixed use | The dominant explanatory variable. Once hotel-only versus mixed use is settled at the planning stage, the landing window narrows sharply |
| Scale metric | Rooms r = -0.03 / floor area (log) r = +0.53 | Look at floor area, not room count. A 250-room hotel and a 100,000 m² complex containing 250 rooms are different animals |
| The price of time | Approx. ¥340m per extra year (about 10% of construction cost) | Mostly the opportunity cost of a delayed opening, not interest during construction. Work backwards from this to size investment in schedule compression |
Adding time as a fourth axis alongside the conventional three — volume, location and price band — sharpens how the development pipeline can be read. The compositional shift to more than 60% mixed use among 2027 completions is invisible in a simple count of rooms added or lost. When, and with what character, rooms land in the market — having a view on that matters both to the medium-term positioning of existing properties and to investment decisions on new development. Reading build times is also reading the moment the competitive environment changes.
⚠ A note on future-year pipeline figures: the planned-project data in this article is on a building-confirmation-application basis as of the survey date. Because applications are generally filed one to two years or more before opening, project and room counts for 2027 and beyond are expected to rise as further applications are filed; treat them as a floor on the pipeline confirmed as of today. Scheduled completion dates are as planned and may differ from actual completion and opening dates. None of the 67 projects has a recorded opening date, so the lead time from completion to opening is not analysed here.
Related Reading
- Construction +41% & Labor Crunch Erase Japan’s 2027-2029 Hotel Supply
- Nagoya Pipeline 2026-2033: Conrad, Andaz & ¥32,628/¥34,115 ADR Flattening
- Sendai Hotel Supply Pipeline: ¥40k+ White Space & New-Entry Case
- Utsunomiya 300-Room Hotel Plan: LRT, Business Demand & +5% Supply
- Frozen Pipeline & the Supply Gap: Cancelled Hotel Projects and Investor Implications
References & Sources
■ Data sources
Sixty-seven planned and under-construction hotel projects totalling 15,015 rooms, derived from MLIT’s Construction Statistics Survey (compiled by MetroEngines Research & Consulting). The 56 projects with both a groundbreaking date and a scheduled completion date form the build-time population. The ADR used for post-opening revenue assumptions is the same firm’s estimated settled ADR (Tokyo, business hotels, December 2025 to June 2026, N=899–924 properties, monthly median ¥14,900). The construction cost per tsubo is the 2025 all-structure average of ¥1.952 million from MLIT’s Building Construction Starts Statistics.
■ Calculation assumptions
Build time is the span from groundbreaking to scheduled completion (converted at 365.25 days per year). The model project for the schedule-cost calculation uses this dataset’s hotel-only medians — 5,954 m² (1,801 tsubo) and 180 rooms — with a total construction cost of ¥3.52 billion (land cost excluded because it varies widely by region), a 70% loan-to-cost ratio, a 60% average outstanding balance reflecting staged drawdown against construction progress, and post-opening assumptions of ¥15,000 ADR, 80% OCC (a full-year calculation assumption) and a 40% GOP margin (conservative for limited-service). The opportunity cost of a delayed opening follows from the fact that, at a discount rate around 5%, deferring a perpetual earnings stream by one year erodes present value by roughly one year’s GOP. The three scenarios and the two-axis grid convert these stated assumptions across funding rates and extension lengths; they do not forecast future build times or interest rates.
■ Limitations and caveats
The planned-project data is on a building-confirmation-application basis as of the survey date; because applications are generally filed one to two years or more before opening, project and room counts for future years will rise as further applications are filed (they are a floor on the currently confirmed pipeline). Scheduled completion dates are as planned and may differ from actual completion and opening. The apparent shortening of build times by groundbreaking year is affected by the shift in use mix and by censoring bias (long-schedule projects completing from 2030 onward fall outside the observation window), and cannot be read as a trend. The 11 projects for which build time could not be calculated are excluded, so these are not medians across all 67. Estimated settled ADR is an estimate and differs from each property’s actual transacted rates or accounting figures.
■ Market data
- MetroEngines Research & Consulting — planned and under-construction hotel project data (67 projects, 15,015 rooms; build-time population N=56), estimated settled ADR (Tokyo business hotels, N=899–924 properties), schedule-cost calculation
■ Government statistics and public data
- MLIT, Construction Statistics Survey (Building Construction Starts Statistics) — building-confirmation-application data for planned hotel projects, construction cost per tsubo by structure
- e-Stat, Building Construction Starts Statistics
- MLIT White Paper — securing construction-industry workers and the overtime cap
■ Interest rates and monetary policy
- Dai-ichi Life Research Institute, “The rise to a 1.00% policy rate — the Bank of Japan’s June 2026 monetary policy meeting”
- Trading Economics, “Japan Interest Rate”
■ Project press releases and news coverage
- Kyushu Railway Company, “Notice regarding cancellation of the Hakata Station Sky City Project” (26 September 2025)
- Toshoken, “Imperial Hotel Tokyo Tower Wing: redevelopment groundbreaking deferred, announced March 2026 — Uchisaiwaicho 1-chome redevelopment district, from within FY2024 to around the end of FY2030”
- BUILT, “‘Hakata Station Sky City Project’ cancelled amid soaring construction costs” (29 September 2025)
- archi-book, “Construction cost per tsubo, 2025 edition”