

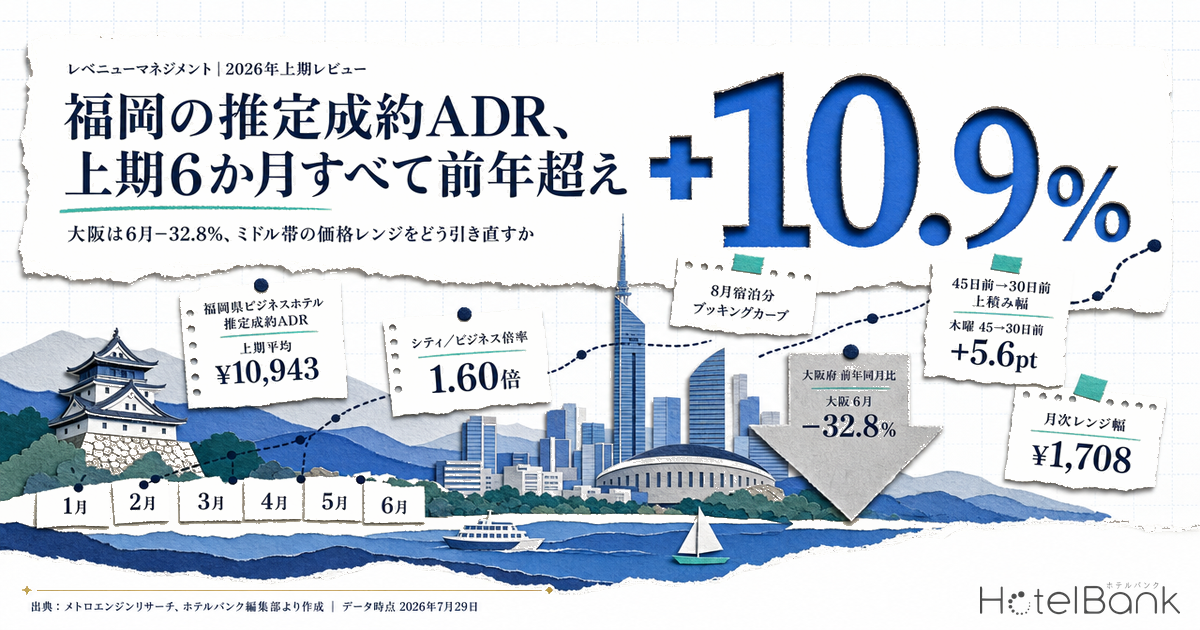
The estimated settled ADR (tax-exclusive equivalent) for business hotels in Fukuoka exceeded the same month of the prior year in every one of the six confirmed months from January to June 2026. The H1 average landed in the ¥10,900s (January–June 2026 average: ¥10,943), up +10.9% against the ¥9,800s of the same period a year earlier (¥9,863). June 2026, the most recent confirmed month, came in at ¥10,030 (N=340 properties), +6.5% versus ¥9,414 in June 2025 (N=331 properties). Over the same window, business hotels in Osaka recorded ¥7,884 in June 2026 (N=495 properties) — −32.8% against ¥11,735 in the same month a year earlier. Rate growth is not a uniform national trend; the sign flips from one area to the next. This article builds a set of “yardsticks” for resetting mid-tier price ranges and weekday/weekend increments, using confirmed-month YoY comparisons for Fukuoka together with the booking curve (estimated OCC) for August stays.
About the data in this article / Coverage: business hotels in Fukuoka N=340 properties (as of June 2026) and city hotels N=40 properties (same); business hotels in Osaka N=495 properties (same) as the comparison axis. Price metrics in this article are estimated settled ADR (the settled price level estimated from OTA and other sales data, tax-exclusive equivalent); occupancy is an estimate based on OTA-listed inventory. Definitions for both appear at the end of the article. Data as of July 29, 2026.
- — +10.9% — The estimated settled ADR for business hotels in Fukuoka beat the prior-year month in all six confirmed months of January–June 2026. H1 average ¥10,943 (versus ¥9,863 a year earlier).
- — 1.60x — Fukuoka’s city-to-business rate multiple narrowed from 1.68x in June 2025. The ceiling was not lifted by the upper tier; rather, the mid tier closed in from below.
- — −32.8% — In that same June 2026, business hotels in Osaka were down 32.8% year on year (¥7,884, N=495 properties). Rate growth is not a nationwide movement.
- — ¥1,708 — The monthly range width in H1 2026 (+17.0% over the cheapest month) is double the ¥802 of H1 2024. A single year-round base rate cannot capture these peaks and troughs.
- — +5.6pt — For August 2026 stays, the pickup from 45 days out to 30 days out was +5.6pt on Thursdays versus +4.3pt on Saturdays. Weekends fill early; the remaining upside sits on the weekday side.
All six confirmed months beat the prior year; the H1 average is +10.9%
The first thing to register is the fact itself: the estimated settled ADR for business hotels in Fukuoka exceeded the same month of the prior year in all six confirmed months from January to June 2026. The size of the gain varies widely by month. The largest was April at +18.9% (¥11,738 / N=341 properties versus ¥9,874 / N=326 properties); the smallest was February at +5.4% (¥11,076 / N=339 properties versus ¥10,510 / N=324 properties). Four of the six months posted double-digit growth, which reads as a level shift running through the whole half-year rather than a one-month anomaly.
City hotels show a comparable gain on an H1-average basis. The January–June 2026 average was ¥18,000 (monthly N=38–40 properties) against ¥16,248 for the same period of 2025, or +10.8%. The shape of the monthly YoY series, however, is entirely different from that of business hotels. January stands out at +28.8%, and from there the series runs +12.0% in February, +16.4% in March, +2.2% in April, +6.4% in May and +1.2% in June — growth concentrated in the early part of the year, converging toward flat as the half progresses. The straightforward reading is that city hotel rates had already stepped up during the second half of 2025, and the additional pickup since the start of 2026 has thinned out.
| Confirmed month | Fukuoka business 2026 | Same, 2025 | YoY | Fukuoka city 2026 | Same, 2025 | YoY |
|---|---|---|---|---|---|---|
| January | ¥10,332 (N=338) | ¥9,033 (N=324) | +14.4% | ¥19,571 (N=38) | ¥15,198 (N=36) | +28.8% |
| February | ¥11,076 (N=339) | ¥10,510 (N=324) | +5.4% | ¥17,736 (N=38) | ¥15,840 (N=36) | +12.0% |
| March | ¥10,983 (N=338) | ¥9,890 (N=324) | +11.1% | ¥17,937 (N=39) | ¥15,408 (N=36) | +16.4% |
| April | ¥11,738 (N=341) | ¥9,874 (N=326) | +18.9% | ¥17,899 (N=40) | ¥17,506 (N=37) | +2.2% |
| May | ¥11,497 (N=341) | ¥10,456 (N=330) | +10.0% | ¥18,846 (N=40) | ¥17,717 (N=37) | +6.4% |
| June | ¥10,030 (N=340) | ¥9,414 (N=331) | +6.5% | ¥16,011 (N=40) | ¥15,818 (N=37) | +1.2% |
| H1 average | ¥10,943 | ¥9,863 | +10.9% | ¥18,000 | ¥16,248 | +10.8% |
Source: Compiled by the HotelBank Editorial Team from MetroEngines Research
Stacking the years side by side makes the position of these six months clearer still. The estimated settled ADR for business hotels in Fukuoka moved within a ¥8,500–¥10,300 range in 2024 and ¥9,000–¥12,400 in 2025; in 2026 the first half alone sits between ¥10,030 and ¥11,738. The annual high of 2024 (¥10,269 in November) had already been surpassed by January 2026 (¥10,332). In other words, a level that used to be reached only in peak months has become the year-round baseline within two years. The structural change in this area is that the floor has risen — not that the ceiling has been chased upward.
Source: Compiled by the HotelBank Editorial Team from MetroEngines Research
Note that figures from July 2026 onward are estimates based on current sales conditions (July ¥11,550 / N=334 properties, August ¥12,201 / N=336 properties, September ¥12,657 / N=326 properties). These are not confirmed values and will move with subsequent sales activity. A simple comparison against prior-year confirmed values should wait until month-end confirmation, so this article treats only the confirmed-month YoY figures for H1 as decision material.
The gap to city hotels narrowed to 1.60x — it was the mid tier that rose
The most operationally useful number in Fukuoka’s first half is not the YoY figure itself but the multiple between categories. Comparing June estimated settled ADR, city hotels at ¥16,011 (N=40 properties) are 1.60x business hotels at ¥10,030 (N=340 properties). For the same month of 2025 the multiple was 1.68x (¥15,818 versus ¥9,414), and in 2024 it was 1.63x (¥14,658 / N=36 properties versus ¥8,974 / N=326 properties). The absolute gap has not moved much — it sits around ¥6,000 — but the ratio has compressed over three years. The upper category did not push the ceiling higher; the lower and middle categories closed in from below.
That compression feeds directly into price-range design. Against an H1 average of ¥10,943 for business hotels, city hotels averaged ¥18,000. The band between them — roughly ¥12,000 to ¥16,000 — has historically been filled only by “business hotel peak-day rates” or “city hotel low-season rates.” Now that the business hotel base has settled firmly into the ¥10,000s, that band comes within realistic reach for permanently positioned upper-grade room types (larger rooms, higher floors, late checkout included). Viewed from the city hotel side, the +1.2% June YoY is a signal of being squeezed from below: without first setting a floor-protection design, rates on non-peak days will be pulled toward the middle band.
One more thing worth watching in range design is range width. For business hotels in Fukuoka, H1 2026 swung ¥1,708 from the cheapest month (June, ¥10,030) to the most expensive (April, ¥11,738) — +17.0% over the cheapest month. The same calculation for H1 2024 gives ¥8,554–¥9,356, a spread of ¥802 (+9.4%). With the month-to-month peaks and troughs nearly twice as wide, running a single year-round base rate simultaneously raises the odds of leaving money on the table in peak months and holding unsold inventory in slow ones.
Osaka fell 32.8% in June — rate growth is not a national trend
Reading Fukuoka’s gains as evidence that “the market is strong nationwide” would be a mistake. The estimated settled ADR for business hotels in Osaka was ¥7,884 in June 2026 (N=495 properties) against ¥11,735 in June 2025 (N=502 properties), or −32.8%. Even on an H1-average basis, 2026 at ¥9,054 versus 2025 at ¥11,091 is −18.4% — the opposite sign to Fukuoka. 2025 coincided with a major international event, and the payback is showing up in the 2026 confirmed values: January was +3.9%, but February came in at −11.1%, March −8.9%, April −23.8% and May −27.5%, with the year-on-year decline widening month by month apart from March. Even within the same bracket of “major western Japan city, business hotel,” rates move in opposite directions when the source of demand differs. This pair of prefectures illustrates well how risky it is to borrow national averages or another city’s growth rate when setting your own budget or ranges.
Source: Compiled by the HotelBank Editorial Team from MetroEngines Research
Pickup for August stays — Saturdays lead, weekdays catch up late
If you are redrawing price ranges, decide the day-of-week increments at the same time. From here we look at progress for August 2026 stays through the booking curve of estimated OCC (OTA-listed-inventory basis). Coverage is business hotels in Fukuoka (299–317 properties, roughly 41,000–43,000 rooms depending on the stay date) and city hotels (32–36 properties, roughly 6,600 rooms), observed from 45 days before the stay date up to the present.
At the 45-days-out mark, estimated OCC is highest on Saturdays at 77.2% (n=3 days out of the four weeks covered) and lowest on Mondays at 70.8% (n=4 days) — a gap of 6.4pt. By 30 days out, however, Saturdays reach 81.5% and Mondays 75.9%, narrowing the gap to 5.6pt. Over those 15 days from 45 to 30 days out, the pickup was +4.3pt on Saturdays versus +5.6pt on Thursdays, +5.1pt on Mondays and +4.8pt on Tuesdays and Wednesdays. The pattern is that weekends fill early, but the remaining upside sits on the weekday side. In practice, this reads as: Saturdays already have enough signal to act on pricing at 45 days out, while weekdays still have room to move from 30 days out onward.
| Stay day of week | Business, 45 days out | Business, 30 days out | Pickup | City, 45 days out | City, 30 days out |
|---|---|---|---|---|---|
| Mon (n=4 days) | 70.8% | 75.9% | +5.1pt | 76.1% | 80.3% |
| Tue (n=4 days) | 73.3% | 78.1% | +4.8pt | 76.8% | 81.6% |
| Wed (n=4 days) | 73.5% | 78.2% | +4.8pt | 77.2% | 81.3% |
| Thu (n=3 days) | 73.6% | 79.2% | +5.6pt | 78.2% | 82.2% |
| Fri (n=3 days) | 74.9% | 79.5% | +4.6pt | 78.6% | 81.6% |
| Sat (n=3 days) | 77.2% | 81.5% | +4.3pt | 80.3% | 83.0% |
| Sun (n=3 days) | 73.1% | 77.7% | +4.6pt | 76.3% | 79.6% |
Source: Compiled by the HotelBank Editorial Team from MetroEngines Research (stays from August 3 to August 26, 2026; only dates observed at both points are aggregated)
The shape of the progression also differs between categories. City hotels start higher than business hotels at 45 days out on every day of the week (5.3pt higher on Mondays, 3.1pt on Saturdays), and correspondingly add less over those 15 days (+2.7pt on Saturdays, +3.0pt on Fridays). A guest mix that fills up early shows through directly in the shape of the curve. Business hotels start relatively low at 45 days out and catch up in the back half. For the same August day of the week, in other words, the moment to move price shifts by 15 days depending on the category.
Source: Compiled by the HotelBank Editorial Team from MetroEngines Research
Looking at individual dates, business hotels on Monday, August 3 went 72.0% at 45 days out → 75.9% at 30 days out → 88.0% most recently (7 days out); Saturday, August 8 went 76.8% → 80.4% → 89.0% most recently (12 days out). Mondays hold a narrow gap between 45 and 30 days out and then fill sharply over the remaining three weeks. Cutting price early on these “back-half” dates, on the basis of a low 45-days-out reading alone, erases rate you could otherwise have added yourself.
This week’s actions (from an opportunity standpoint)
- Place product in the ¥12,000–¥16,000 band: the middle ground between Fukuoka’s business H1 average of ¥10,943 and the city average of ¥18,000 is now within reach of real demand, with the category multiple compressed to 1.60x. There is room to hold this band as a standing part of your own rate structure through upper room types or permanent plans that add stay value.
- Move the base rate from “one for the year” to “a range per month”: in H1 2026 the gap between the cheapest and most expensive month was ¥1,708 (+17.0% over the cheapest month), nearly double the ¥802 of H1 2024. Simply switching to a design with a floor and ceiling per month lets you go after what peak months would otherwise leave behind.
- Shift weekday decisions toward 30 days out: for August stays, pickup from 45 to 30 days out was +5.6pt on Thursdays and +5.1pt on Mondays versus +4.3pt on Saturdays. Weekdays still move after 30 days out. Rather than cutting rate early because of slow progress at 45 days out, there is room to judge at the 30-days-out cross-section.
For revenue managers running business and city hotels in Fukuoka — implications and an action plan
Here we organize this article’s data from the standpoint of operating a business or city hotel in Fukuoka.
Insights from an operator’s perspective
- Confirmed market YoY is a yardstick for assessing your own property — the most recent confirmed month for Fukuoka business hotels is +6.5% year on year. If your own confirmed ADR growth for that month falls short of this, start by checking whether the cause lies in your rate ranges or inventory release rather than on the demand side.
- Current estimates are “the market as it stands now” — the ¥12,201 for business hotels in August is a market level based on current sales conditions. If your own settings for remaining August inventory diverge widely from it, confirm whether that divergence can be explained by room-type mix, location or plan structure.
- Do not get dragged along by neighboring markets — even with a large payback phase nearby such as Osaka’s −32.8% in June, supply and demand in Fukuoka are moving on their own. Avoid across-the-board rate cuts justified by another city.
- Build the habit of comparing confirmed month to confirmed month — figures for a month in progress move as sales progress. The safe approach is to run the monthly review once confirmed values are in, placing market YoY and your own YoY side by side.
Below is an action plan organized by time horizon. Each item is a starting point for “using market figures as a yardstick to review your own settings,” and should be adjusted to the circumstances of the individual property.
| Time horizon | Action | Decision guide |
|---|---|---|
| Today to this week | Price check on remaining August inventory | If your August settings remain below the market’s current estimate (business ¥12,201), consider room for an upward revision |
| Today to this week | Set rules for reselling returned cancellation inventory | Check whether returned inventory is being relisted at the old price |
| Within two weeks | Re-examine weekday/weekend increments (ranges) | Check whether any dates remain priced identically regardless of day of week |
| Within two weeks | Take stock of rate ranges from next month onward | Check whether the shape of this article’s monthly trend chart diverges sharply from your own rate calendar |
| Toward next month | Begin a fixed-point review on confirmed values | After month-end confirmation, place market YoY (as read here) alongside your own YoY and separate demand factors from setting factors |
| Toward next month | Reset the ceiling of the range ahead of peak months | If confirmed market YoY is holding a positive trend, consider room to capture more at the upper end |
Summary: remeasure your own operation with three yardsticks
H1 2026 in Fukuoka was a phase of clear level shift, with all six confirmed months of estimated settled ADR above the prior year (business +10.9% for the half, city +10.8%). Over the same period, however, Osaka business hotels were −32.8% in June — the exact opposite direction. That is precisely why your own decisions should rest on reusable yardsticks rather than on the language of market sentiment.
The first yardstick is the category multiple. Fukuoka’s city-to-business ratio was 1.60x in June (1.68x in 2025, 1.63x in 2024). When that multiple is compressing, thickening the middle band returns more than chasing the upper grade. The second is range width. The gap between the cheapest and most expensive month in H1 was ¥1,708 (+17.0% over the cheapest month), more than double the level of two years ago. A single year-round base rate does not function against a spread that wide. The third is the pickup between 45 and 30 days out. For August stays it was +4.3pt on Saturdays versus +5.6pt on Thursdays — the remaining upside sits on a different day depending on the day of week. Simply splitting the timing of price moves by day of week and by category changes the rate you can capture from the same inventory.
All three can be approximated from your own PMS data alone. Area figures are not the answer; they are the coordinate axes on which to place your own numbers. Before applying a uniform growth rate to last year’s results in the next budget round, use these three yardsticks to break down exactly what moved in your own operation.
About the Data
■ Data sources
OTA public price and listed-inventory data collected and aggregated by MetroEngines Research (monthly aggregation by prefecture × hotel category). Coverage for estimated settled ADR: business hotels in Fukuoka N=324–341 properties (varying by month; N=340 properties in June 2026), city hotels in Fukuoka N=36–40 properties (N=40 properties in the same month), business hotels in Osaka N=495–503 properties (N=495 properties in the same month). For the booking curve, business hotels in Fukuoka cover 299–317 properties and roughly 41,000–43,000 rooms depending on the stay date, and city hotels in Fukuoka 32–36 properties and roughly 6,600 rooms. Data as of July 29, 2026.
■ Estimation assumptions
Estimated settled ADR is the settled price level (tax-exclusive equivalent) estimated from OTA and other sales data (lowest-plan price level × category coefficient, ensembled across multiple channels). Past months are confirmed values; the current and future months are estimates based on current sales conditions, with a median error of 6.6% when reconciled against publicly disclosed operating results. Estimated OCC is calculated as “100 − 100 × OTA-listed remaining rooms ÷ total rooms,” a sell-through rate on an OTA-listed-inventory basis. The booking curve is based on observations from 45 days before the stay date up to the present; this article covers stays from August 3 to August 26, 2026 (day-of-week aggregation includes only dates observed at both the 45-day and 30-day points).
■ Limitations and caveats
Estimated OCC is an estimate based on the sell-through of inventory offered on OTAs and is defined differently from actual room occupancy (it reads higher than actual occupancy). YoY comparisons are made only between confirmed values (past months); estimated settled ADR from July 2026 onward is an estimate based on current sales conditions, so no simple comparison against prior-year confirmed values is made. Area aggregates are affected by changes in the mix of properties within a category (N moves with new openings and delistings), so they should be used as a coordinate axis rather than as a substitute for your own results. Sales conditions and inventory change daily, so the figures in this article are a snapshot as of the retrieval date.