

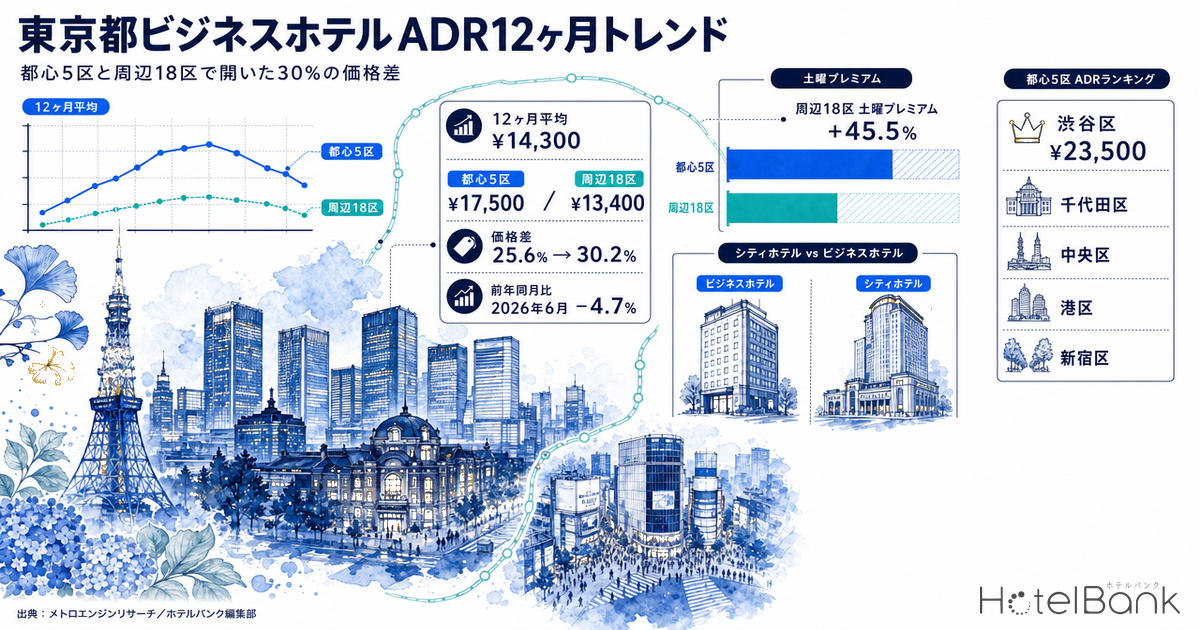
Tokyo’s business hotel market has clearly decelerated in 2026 after the rate growth that peaked in autumn 2025. Tracking the last 12 months using MetroEngines Research’s estimated transacted ADR (approximately 900 properties), the Tokyo business hotel average moved within a monthly range of ¥11,900–¥17,800, with a 12-month average of ¥14,300 (+6.3% YoY). Yet the YoY growth rate has narrowed steadily from its +15.0% peak in October 2025, turning negative at −4.7% in June 2026.
This article breaks that turning point down along three axes — Central 5 Wards versus Outer 18 Wards, weekday versus weekend, and hotel category — to set out quantitatively where Tokyo’s room rates grew and where they stalled.
Metric Definitions Used in This Article
- ADR (average daily rate): An estimated transacted rate (tax-exclusive equivalent) calculated by applying category-specific adjustment coefficients to the lowest published plan level each property lists on OTAs and similar channels (2 guests per room, per-room rate, tax-inclusive). Cross-checked against property-level results disclosed by listed hotel REITs, the median error is 6.6%. These are estimates and differ from each property’s actual transacted prices and accounting figures. Area-level ADR is calculated from the median of the target properties (the level of a typical property in that area).
- Listed price: The average price of all plans published on OTAs and similar channels (2 guests per room, per-room rate, tax-inclusive). The chapter dealing with day-of-week price differences uses this listed-price basis (a different basis from ADR).
- YoY: To remove seasonality, all comparisons are made against the same month of the previous year (month-on-month comparisons are not used).
- Data source: MetroEngines Research
- — ¥14,300 (+6.3% YoY) — the 12-month average estimated transacted ADR for Tokyo business hotels. June 2026 came in at ¥11,900, −4.7% YoY, falling below the prior year.
- — YoY growth peaked at +15.0% in October 2025, narrowed to +0.4% by February 2026, and moved into negative territory in June. The upward phase has entered a plateau for now.
- — The Central 5 Wards stand at ¥17,500 against ¥13,400 for the Outer 18 Wards. The gap widened from 25.6% to 30.2%, and the slowdown began roughly four months earlier in the outer wards (from February 2026).
- — The Saturday premium is +45.5% in the Outer 18 Wards versus +37.2% in the Central 5 Wards. The further out, the stronger the weekend dependence — and the more headroom left on the weekday side.
- — The estimated range for autumn 2026 (October–November) is ¥15,200–¥16,300. How far the prior-year highs of ¥15,300 and ¥16,500 can be defended is the decisive question.
Twelve Months of Tokyo Business Hotels: Autumn 2025 Was the Peak, Growth Slowed From Spring 2026
Start with the overall picture. The estimated transacted ADR for Tokyo business hotels (N=894–924 properties, varying by month) follows a clear seasonal pattern — a twin-peak shape that runs high in April and October–November and dips in June and January. April 2026’s ¥17,800 was the highest value of the past 12 months; June 2026’s ¥11,900 was the lowest.
Source: MetroEngines Research; compiled by the HotelBank Editorial Team (N=894–924 properties)
Overlaying the years, 2025 consistently ran above 2024, while the 2026 line tracked above 2025 through the first half of the year before sinking in June to ¥11,900 — below June 2025’s ¥12,500. The phase in which the rate staircase kept climbing another step has, for now, entered a plateau.
On a YoY basis the turn is even sharper. After double-digit gains of +15.0% in October 2025 and +13.2% in November, growth fell to near zero at +0.4% in February 2026 and reached −4.7% in June. The narrowing is less a matter of prices ceasing to rise than a structural consequence of a higher comparison base created by the large increases of the prior year. The larger the increase an area recorded from 2024 into 2025, the harder it is for its 2026 YoY figure to grow.
This movement is consistent with disclosures from listed hotel REITs. Invincible Investment Corporation (インヴィンシブル投資法人), which holds a large number of lodging-focused hotels, reported June 2026 figures for its 101 domestic hotels of ¥12,412 ADR (−3.9% YoY), 82.7% occupancy (as of June 2026, −0.1pt), and RevPAR of ¥10,264 (−4.0%). Ichigo Hotel REIT Investment Corporation (いちごホテルリート投資法人) disclosed ADR of ¥8,872 (−5.9%) for the same month across a combined 24 hotels (excluding two hotels fully closed for renovation). By contrast, Japan Hotel REIT Investment Corporation (ジャパン・ホテル・リート投資法人) reported ADR of ¥18,509 (+1.6%) across the 29 hotels under variable-rent and similar schemes, holding in positive territory — a pattern in which downward pressure eases as the price band rises.
| REIT (June 2026, disclosed) | Scope | ADR | Occupancy | ADR YoY |
|---|---|---|---|---|
| Invincible Investment Corporation | 101 domestic hotels | ¥12,412 | 82.7% | −3.9% |
| Ichigo Hotel REIT Investment Corporation | 24 hotels combined (excl. 2 closed hotels) | ¥8,872 | 80.6% | −5.9% |
| Japan Hotel REIT Investment Corporation | 29 hotels under variable-rent and similar schemes | ¥18,509 | 81.2% | +1.6% |
Source: Compiled by the HotelBank Editorial Team from each REIT’s monthly operating data (figures reproduced exactly as disclosed by each company)
Central 5 Wards vs Outer 18 Wards: The Gap Widened From 25.6% to 30.2%
Next, the geographic breakdown. We compared estimated transacted ADR, weighted by property count, between the Central 5 Wards — Chiyoda, Chuo, Minato, Shinjuku and Shibuya (N=382–394 properties) — and the remaining 18 wards (N=428–449 properties).
Over the last 12 months (July 2025–June 2026), the average was ¥17,500 for the Central 5 Wards and ¥13,400 for the Outer 18 Wards. The prior-year figures were ¥16,000 and ¥12,700 respectively, giving growth of +9.6% for the central wards against +5.7% for the outer wards. As a result, the gap between them widened from ¥3,300 to ¥4,100 in absolute terms, and from 25.6% to 30.2% in ratio terms. Over the past year, Tokyo’s business hotel market has intensified into a structure where the centre rises and the periphery cannot fully keep pace.
Source: MetroEngines Research; compiled by the HotelBank Editorial Team (Central 5 Wards N=382–394 properties, Outer 18 Wards N=428–449 properties)
Lining up the monthly YoY figures pinpoints when the divergence began. In July–August 2025 the two were broadly level, at +11.1%/+6.2% for the Central 5 Wards and +10.0%/+7.0% for the Outer 18 Wards. The gap opened from September 2025 onward: in October the central wards were +20.6% against +12.5% for the outer wards; in January 2026, +16.4% against +2.7%; and by February the outer wards had already crossed into negative territory at −1.7%. In other words, the deceleration in the outer wards began roughly four months earlier than in the centre.
Then in June 2026 both turned negative — the Central 5 Wards at −6.4% and the Outer 18 Wards at −2.6%. For that month alone the decline is steeper in the centre, but this is the flip side of the higher level recorded there in the same month a year earlier. Across the full 12 months, the level itself remains around 30% higher in the centre than in the periphery.
Ward Ranking: Shibuya Tops at ¥23,500, Chuo Grew Most at +12.8%
Looking at the 23 wards individually, rate level and growth rate do not necessarily align. The highest 12-month average estimated transacted ADR is Shibuya’s ¥23,500, which exceeds second-placed Chuo (¥18,200) by ¥5,300. Shibuya’s YoY figure of +2.9%, however, is among the smaller ones across the 23 wards — a sign that areas which have already reached high levels have limited additional room to rise.
By contrast, growth stands out in Chuo (+12.8%), Koto (+9.7%) and Edogawa (+10.4%). Chuo is notable in that it has the second-largest property count among the 23 wards at N=127 — a thickly supplied area — yet still recorded double-digit growth. Redevelopment around Nihonbashi, Yaesu and Ginza, together with linkage to Chiyoda (+9.1%) across Tokyo Station, is likely behind this.
Source: MetroEngines Research; compiled by the HotelBank Editorial Team (wards with fewer than 10 target properties excluded)
| Ward | 12-month avg ADR | YoY | Properties | Segment |
|---|---|---|---|---|
| Shibuya | ¥23,500 | +2.9% | 25 | Central 5 Wards |
| Chuo | ¥18,200 | +12.8% | 127 | Central 5 Wards |
| Minato | ¥17,000 | +8.1% | 94 | Central 5 Wards |
| Chiyoda | ¥16,400 | +9.1% | 63 | Central 5 Wards |
| Shinjuku | ¥15,800 | +8.7% | 69 | Central 5 Wards |
| Taito | ¥14,800 | +3.0% | 148 | Outer 18 Wards |
| Sumida | ¥14,800 | +5.9% | 22 | Outer 18 Wards |
| Arakawa | ¥14,000 | +18.2% | 10 | Outer 18 Wards |
| Koto | ¥13,400 | +9.7% | 30 | Outer 18 Wards |
| Bunkyo | ¥13,300 | +4.9% | 14 | Outer 18 Wards |
| Shinagawa | ¥13,200 | +8.6% | 29 | Outer 18 Wards |
| Toshima | ¥12,300 | +5.9% | 55 | Outer 18 Wards |
| Ota | ¥12,000 | +6.4% | 49 | Outer 18 Wards |
| Edogawa | ¥11,800 | +10.4% | 15 | Outer 18 Wards |
| Kita | ¥10,700 | +3.1% | 19 | Outer 18 Wards |
Source: MetroEngines Research; compiled by the HotelBank Editorial Team. Wards with fewer than 10 target properties (Meguro, Setagaya, Suginami, Nakano, Adachi, Katsushika, Nerima, Itabashi) are excluded for aggregation stability.
Taito carries the largest supply among the 23 wards at N=148 target properties, yet its 12-month average stopped at ¥14,800, +3.0% YoY. The Ueno and Asakusa area is a principal catchment for inbound visitors, but the depth of supply is moderating the pace of rate growth. Conversely, in small populations such as Arakawa (N=10, +18.2%), a price revision at one or two properties can move the whole figure substantially, so growth rates there call for cautious interpretation.
Weekday vs Weekend: The Outer Wards’ Saturday Premium of +45.5% Exceeds the Centre’s +37.2%
The day-of-week price structure differs distinctly in character between the centre and the periphery. Here we aggregated daily listed prices (average of all plans, 2 guests per room, tax-inclusive) by property, then averaged the daily medians by day of week (period: 1 July 2025–30 June 2026; Central 5 Wards N=262 properties, Outer 18 Wards N=297 properties).
Source: MetroEngines Research; compiled by the HotelBank Editorial Team (Central 5 Wards N=262 properties, Outer 18 Wards N=297 properties)
In the Central 5 Wards, prices climb gently through the first half of the week from ¥21,600 on Monday to ¥26,400 on Thursday, hold roughly flat at ¥26,300 on Friday, jump to ¥32,800 on Saturday, and fall back to ¥22,300 on Sunday. Against a weekday average (Monday–Thursday plus Sunday) of ¥23,900, Saturday is +37.2%.
In the Outer 18 Wards, prices run from ¥16,400 on Monday to ¥20,300 on Friday, with Saturday at ¥26,500. The Saturday uplift over the ¥18,200 weekday average is +45.5% — more than eight points above the centre. Even though levels are 20–30% below the centre, the weekend peak is relatively steeper. With thinner weekday business demand, dependence on the Saturday concentration of leisure demand is correspondingly higher.
Tracking the Saturday premium month by month, this difference is stable across the year. The Central 5 Wards swing from +23.7% in January 2026 to +46.6% in June, but in those same months the Outer 18 Wards recorded +30.7% and +53.2% respectively — exceeding the centre in almost every month. The contraction in January for both is likely because New Year homecoming and first-sale demand lifts the weekday side.
| Month | Central 5 weekday | Central 5 Saturday | Sat. uplift | Outer 18 weekday | Outer 18 Saturday | Sat. uplift |
|---|---|---|---|---|---|---|
| July 2025 | ¥21,000 | ¥29,200 | +39.0% | ¥16,700 | ¥24,700 | +47.6% |
| August 2025 | ¥20,300 | ¥27,600 | +36.1% | ¥16,300 | ¥23,000 | +41.5% |
| September 2025 | ¥22,600 | ¥32,300 | +42.9% | ¥17,000 | ¥26,100 | +53.3% |
| October 2025 | ¥26,800 | ¥37,000 | +38.0% | ¥19,400 | ¥29,700 | +53.1% |
| November 2025 | ¥28,100 | ¥37,800 | +34.6% | ¥20,700 | ¥29,800 | +44.4% |
| December 2025 | ¥25,500 | ¥34,400 | +34.9% | ¥19,000 | ¥28,000 | +47.2% |
| January 2026 | ¥21,300 | ¥26,300 | +23.7% | ¥16,300 | ¥21,400 | +30.7% |
| February 2026 | ¥22,300 | ¥32,600 | +46.1% | ¥17,400 | ¥26,500 | +52.1% |
| March 2026 | ¥24,800 | ¥34,800 | +40.0% | ¥19,200 | ¥28,200 | +47.1% |
| April 2026 | ¥27,400 | ¥38,200 | +39.1% | ¥21,200 | ¥30,500 | +43.3% |
| May 2026 | ¥25,900 | ¥34,500 | +33.2% | ¥19,300 | ¥27,000 | +40.0% |
| June 2026 | ¥20,600 | ¥30,100 | +46.6% | ¥16,000 | ¥24,500 | +53.2% |
Source: MetroEngines Research; compiled by the HotelBank Editorial Team (listed-price basis, average of all plans, 2 guests per room, tax-inclusive; weekday = Monday–Thursday plus Sunday)
This structure also indicates where the revenue opportunity lies. In the Central 5 Wards, weekday rates already run 30% above the periphery and hold at high levels through Thursday and Friday. The Outer 18 Wards, with demand concentrated more heavily on Saturday, still have room to build on the weekday side. If they can capture the days on which central business demand overflows, there is potential to lift the weekday level. For a cross-city comparison, Weekday ADR in Tokyo, Nagoya, Osaka & Fukuoka: Business Demand Recovery 2026 visualises the pace of business-demand recovery city by city.
By Category: City Hotels Swing Further in Both Directions
Looking at movements by category, the amplitude differs between business hotels and city hotels. Tokyo city hotels (N=104–108 properties) posted a 12-month average estimated transacted ADR of ¥28,300, +8.0% YoY. Against the ¥14,300 (+6.3%) for business hotels, that is roughly twice the level and 1.7 points higher growth.
Source: MetroEngines Research; compiled by the HotelBank Editorial Team (business hotels N=894–924 properties, city hotels N=104–108 properties)
Lining up the trajectory, however, shows that city hotels swing more widely in both directions. In November 2025 city hotels grew +19.8%, in the high teens, against +13.2% for business hotels. Conversely, in May 2026 city hotels were −3.8% and in June −12.8% — moving into negative territory earlier and more deeply than business hotels (+5.7% and −4.7%).
The higher the price band, the greater the sensitivity to variable factors such as inbound travel and events, and the more directly demand peaks and troughs feed through into rates. Business hotels, by contrast, rest on the relatively stable base of corporate travel demand, so while their gains are gentler in an upswing, their resilience in a downswing is comparatively stronger. In the first half of 2026, this smaller amplitude has emerged as the defining strength of the business hotel segment.
As a market-wide trend, Tokyo Shoko Research’s tabulation shows that the room rate across nine business hotel brands in fiscal 2025 was ¥14,463 (+8.9% year on year) with occupancy at 83.9% (fiscal 2025, versus 82.8% the prior fiscal year) — both rate and occupancy improving. The ¥14,300 12-month average for Tokyo indicated by our estimated transacted ADR sits at almost exactly the same level as this national brand average. For where the category growth gap is widest by region, Japan Hotel ADR Polarization 2026: 57.6pt Prefecture×Category Gap breaks it down by prefecture and category.
Outlook: Whether Autumn Demand Can Beat the Prior Year Is the Deciding Point
Pulling the three axes together, Tokyo’s business hotel market is entering its next phase. First, YoY rate growth peaked in autumn 2025 and turned negative in June 2026. Second, that deceleration spread from the outside in — reaching the Outer 18 Wards in February 2026 and the Central 5 Wards in June. Third, by category, the higher the price band the wider the swing, with city hotels adjusting first.
The focal point for the outlook is the autumn demand season. In October–November 2025, Tokyo business hotel ADR formed the year’s high band at ¥15,300–¥16,500, and those were the months with the strongest YoY growth of the year at +15.0% and +13.2%. The same period in 2026 therefore starts against a high comparison base. Whether YoY can be held in positive territory is less a question of the rate itself than a defensive one — how much of the prior year’s high can be protected.
Three scenarios for autumn 2026 (October–November)
Setting the autumn level quantitatively: the base is the prior-year actuals of ¥15,348 in October 2025 and ¥16,540 in November 2025 (estimated transacted ADR). The table below is a simple extrapolation applying three YoY levels to those figures. The optimistic case assumes the average YoY of January–June 2026 (+2.2%) continues into autumn; the central case assumes flat (±0%); and the pessimistic case assumes the June 2026 actual (−4.7%) persists.
| Scenario | Assumption (YoY) | October 2026 | November 2026 | 2-month average | Assumed background |
|---|---|---|---|---|---|
| Optimistic | +2.2% | ¥15,700 | ¥16,900 | ¥16,300 | First-half 2026 growth (January–June average of +2.2%) is sustained and the June dip proves temporary |
| Central | ±0.0% | ¥15,300 | ¥16,500 | ¥15,900 | The prior year’s high band is defended but not exceeded — a flat landing against a high comparison base |
| Pessimistic | −4.7% | ¥14,600 | ¥15,800 | ¥15,200 | The same rate of decline as June 2026 continues into autumn and the Outer 18 Wards’ slowdown spreads to the centre |
Source: Estimated by the HotelBank Editorial Team from MetroEngines Research 2025 actuals (rounded to the nearest ¥100; demand shocks and major events are not factored in)
Sensitivity: A one-point shift in the YoY assumption moves October 2026 by roughly ±¥150, November by roughly ±¥170, and the two-month average by roughly ±¥160. The spread between the optimistic and pessimistic cases (6.9 points) equals ¥1,100 on the two-month average, or about 7%. Put differently, the autumn landing falls within a band determined less by whether demand is strong or weak than by how much of the prior year’s accumulated high can be maintained. Splitting that band between the Central 5 Wards and the Outer 18 Wards, the deciding variables are the weekday level on Thursday and Friday in the centre, and the degree of Saturday concentration in the periphery.
What works in this phase is a shift from uniform pricing across all days to a design tuned to day of week and area characteristics. The Central 5 Wards are able to hold weekday levels high through Thursday and Friday, and defending prices in that band underpins RevPAR. The Outer 18 Wards, given their heavier Saturday dependence, have their upside in lifting the weekday side. Ward by ward, areas such as Chuo (+12.8%) and Koto (+9.7%) have achieved near double-digit growth despite thick supply, showing that a large supply volume does not necessarily constrain rate growth.
The June 2026 dip is also visible in listed REIT disclosures, so it is not a Tokyo-specific phenomenon. As the market as a whole shifts from an unbroken run of increases to maintaining a high level, the difference over the next 12 months will come less from reacting to each monthly YoY figure than from how precisely day-of-week and area-level price structures can be designed.
Note on the data: The ADR figures in this article are estimates calculated from selling prices published on OTAs and similar channels. They differ from each property’s actual transacted prices and accounting figures. Of the approximately 168,000 domestic properties tracked by MetroEngines Research, the analysis covers those whose operations can be confirmed on OTAs; properties not listed on OTAs are not included.
Further Reading
- Business Hotel Price Surge: National ADR Analysis & 10 Cost-Effective Prefectures
- Weekday ADR in Tokyo, Nagoya, Osaka & Fukuoka: Business Demand Recovery 2026
- Japan Hotel ADR Polarization 2026: 57.6pt Prefecture×Category Gap
References and Sources
■ Data sources
MetroEngines Research estimated transacted ADR (Tokyo, business hotels; monthly N=894–924 properties, July 2024–June 2026) and city hotels (N=104–108 properties). Day-of-week figures use daily listed prices (average of all plans, 2 guests per room, tax-inclusive; Central 5 Wards N=262 properties, Outer 18 Wards N=297 properties; 1 July 2025–30 June 2026). Monthly operating disclosures from three listed hotel REITs (June 2026) and a Tokyo Shoko Research survey (via press reporting) were also used.
■ Estimation assumptions
Area ADR uses the median of the target properties (the level of a typical property in that area). Central 5 Wards and Outer 18 Wards aggregates are weighted by property count; weekdays are defined as Monday–Thursday plus Sunday, and the weekend as Saturday. All comparisons are YoY (month-on-month is not used). The three autumn 2026 scenarios are a simple extrapolation applying YoY assumptions of +2.2% (optimistic; the January–June 2026 YoY average), ±0.0% (central) and −4.7% (pessimistic; the June 2026 actual) to the prior-year actuals of ¥15,348 in October 2025 and ¥16,540 in November 2025, with amounts rounded to the nearest ¥100.
■ Limitations and caveats
ADR is an estimate calculated from prices listed on OTAs and similar channels and differs from each property’s actual transacted prices and accounting figures (median error of 6.6% when cross-checked against results disclosed by listed hotel REITs). Properties not listed on OTAs are not in the population. Wards with fewer than 10 target properties (Meguro, Setagaya, Suginami, Nakano, Adachi, Katsushika, Nerima, Itabashi) are excluded for aggregation stability, and in small populations such as Arakawa (N=10) a price revision at one or two properties can move the growth rate substantially. Only the day-of-week chapter is on a listed-price basis, which uses a different standard from estimated transacted ADR. The autumn estimate is a simple extrapolation that does not factor in demand shocks, major events, currency movements or new supply.
■ Market data
- MetroEngines Research — Tokyo business hotel estimated transacted ADR (monthly, N=894–924 properties), ADR by ward, day-of-week listed prices (Central 5 Wards N=262 properties, Outer 18 Wards N=297 properties, July 2025–June 2026)
■ REIT monthly disclosures
- Invincible Investment Corporation, “Monthly Operating Status (June 2026)” (in Japanese)
- Ichigo Hotel REIT Investment Corporation, “Monthly Operating Status (June 2026)” (in Japanese)
- Japan Hotel REIT Investment Corporation, “Notice Concerning Monthly Disclosure for June 2026” (in Japanese)
■ Industry statistics and press
- “Room rates at 12 major domestic hotel groups hit a record high, with business hotels at ¥14,463 and occupancy also rising” (Travel Voice, 18 June 2026 / Tokyo Shoko Research survey, in Japanese)
- Tokyo Shoko Research, “Major hotels performing strongly: room rates and occupancy rising together” (in Japanese)
- Japan Tourism Agency / Japan National Tourism Organization (JNTO), Foreign Visitor Statistics